
Table 1
Position, time, intensity, and MSLP (MSW: maximum sustained wind speed; and MSLP: minimum sea-level pressure).
| LAT. (°N) | LON. (°E) | TIME | MSW (M·S–1) | MSLP (MB) |
|---|---|---|---|---|
| 7.2 | 87.9 | 11/29/12 | 15.4 | 1000 |
| 7.8 | 86.9 | 11/29/18 | 18 | 996 |
| 8.5 | 86.0 | 11/30/00 | 20.6 | 993 |
| 9.4 | 84.7 | 11/30/06 | 23 | 989 |
| 9.8 | 83.8 | 11/30/12 | 23 | 989 |
| 10.2 | 82.9 | 11/30/18 | 23 | 989 |
| 10.3 | 82.1 | 12/01/00 | 20.6 | 993 |
| 10.4 | 81.3 | 12/01/06 | 20.6 | 993 |
| 10.8 | 80.5 | 12/01/12 | 18 | 996 |
| 10.8 | 80.1 | 12/01/18 | 12.8 | 1004 |
| 10.9 | 79.6 | 12/02/00 | 10.3 | 1007 |
| 11 | 78.9 | 12/02/06 | 10.3 | 1007 |
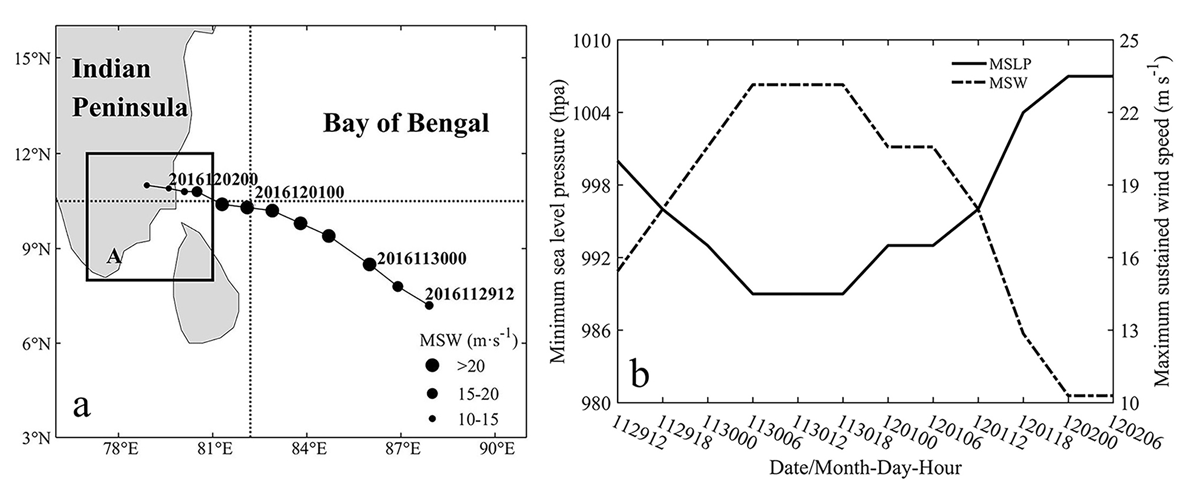
Figure 1
Track (a) and intensity (b) of TC Nada. The locations of the TC center every 6 hours are represented by black circles in the time format of year-month-day-hour, the two dashed black lines indicate 10.5°N and 82.2°E, respectively, and the solid box A indicates the study box (8°N–12°N, 77°E–81°E) in (a). The solid black line and the dashed line indicate the minimum sea-level pressure and maximum sustained wind speed of the TC in (b), respectively.
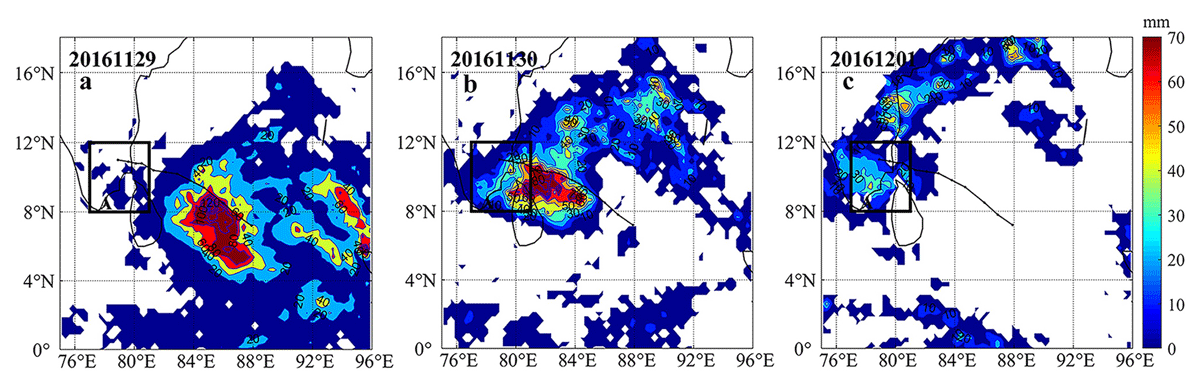
Figure 2
Daily precipitation distribution during the passage of Nada (the color bar represents rainfall (in mm)).
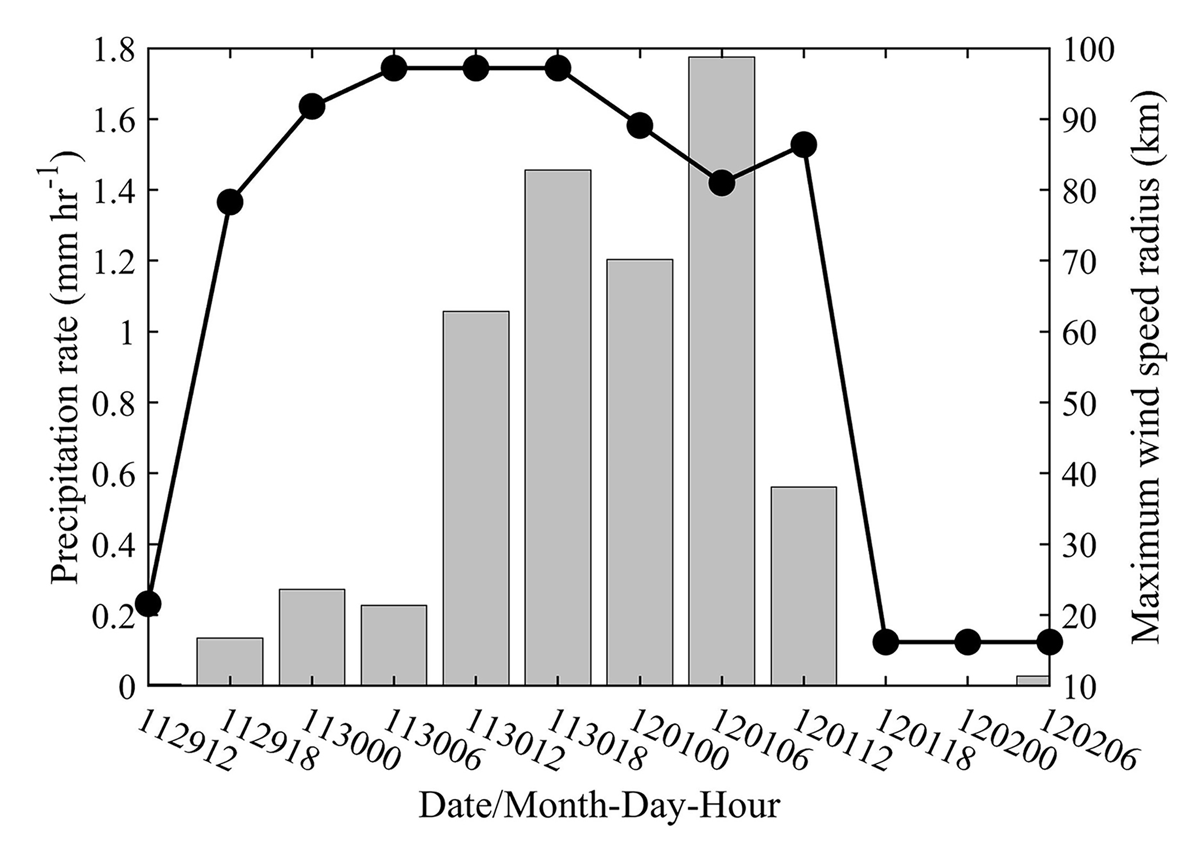
Figure 3
Time series of the maximum wind speed radius (polyline, unit in km) and average precipitation rate in Box A (bar, unit in mm/hr) during the track of Nada.
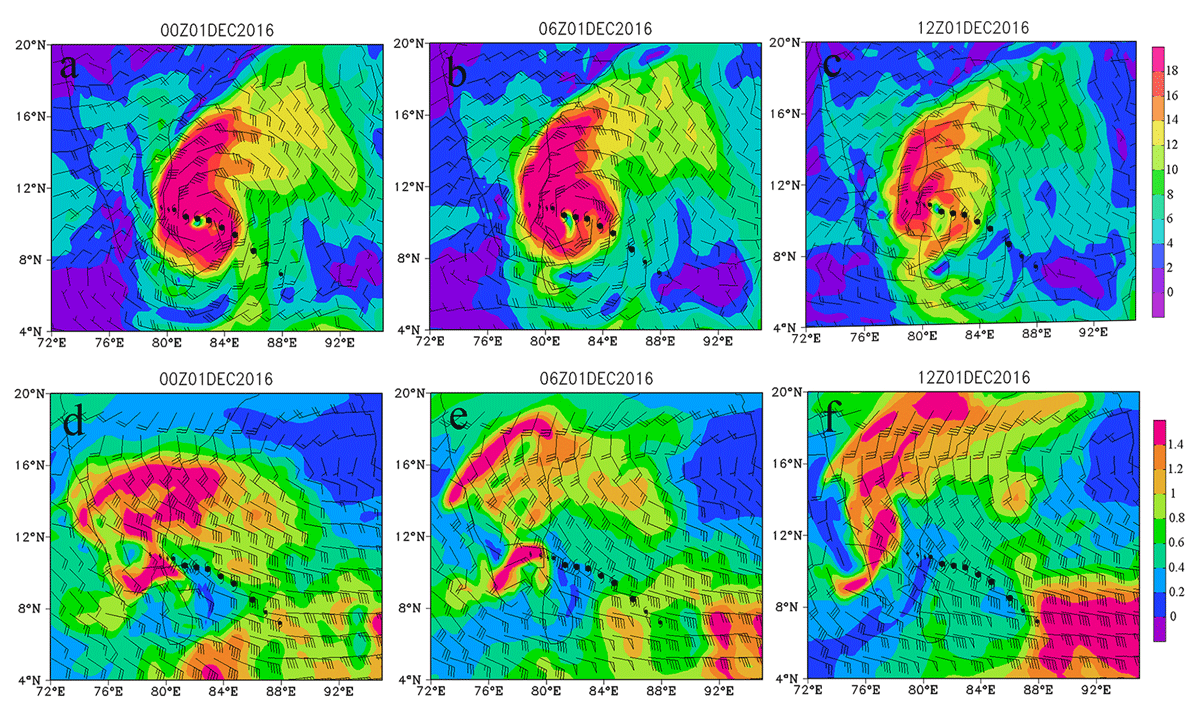
Figure 4
Wind field (vanes) and water vapor flux (shaded; in g/(cm·hPa·s)) at 850 hPa (a–c) and 300 hPa (d–f) on December 1.
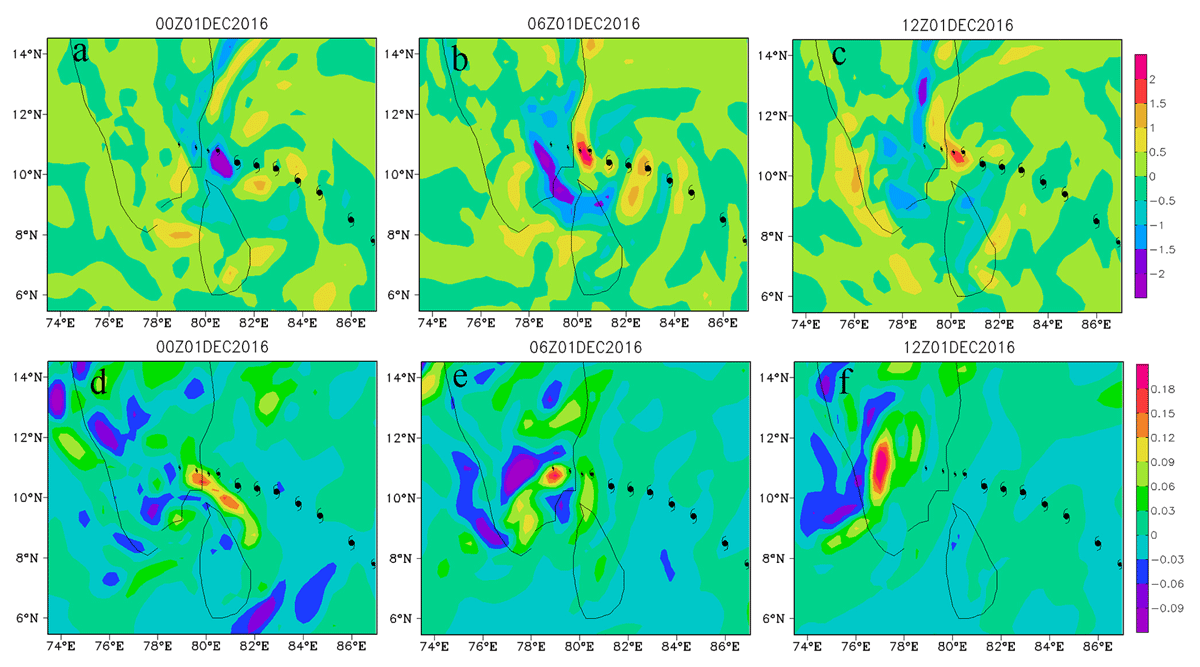
Figure 5
Water vapor flux divergence (shaded; unit in × 10–8 g/(cm2·hPa·s) at 850 hPa (a–c) and 300 hPa (d–f) on December 1.
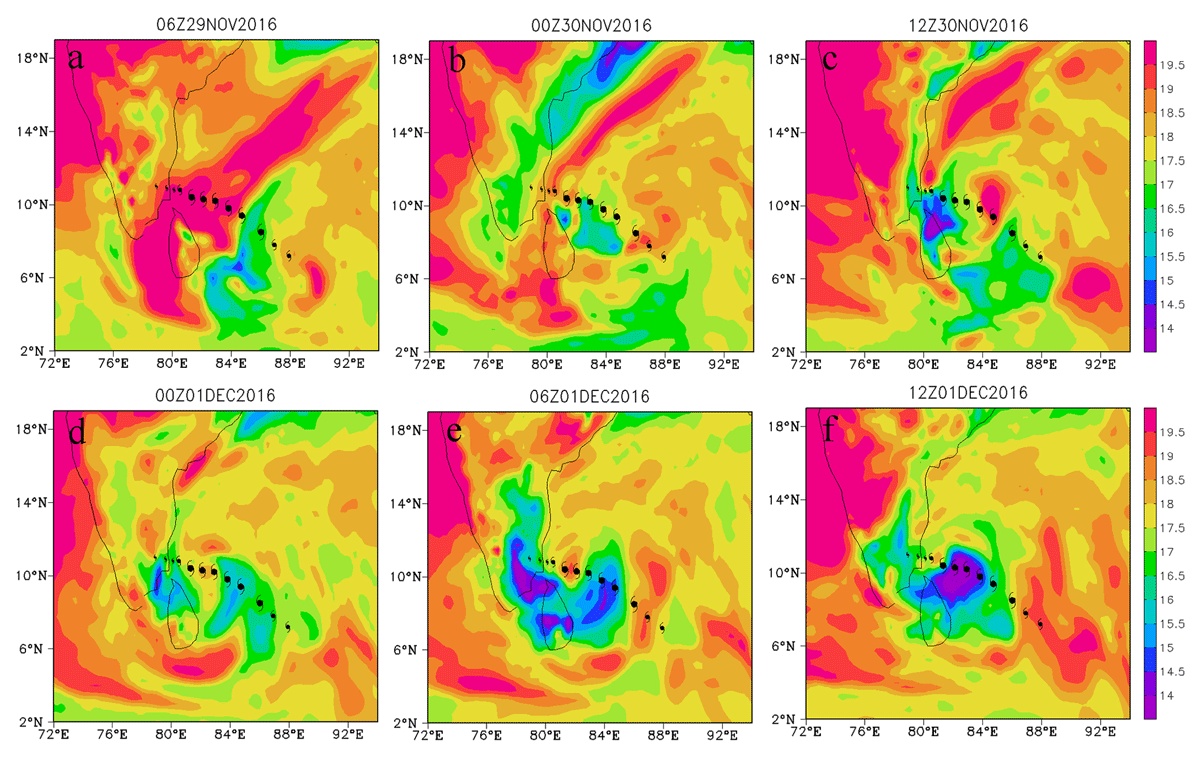
Figure 6
The air temperature ((shaded; unit in°C)) at 850 hPa during the passage of Nada.
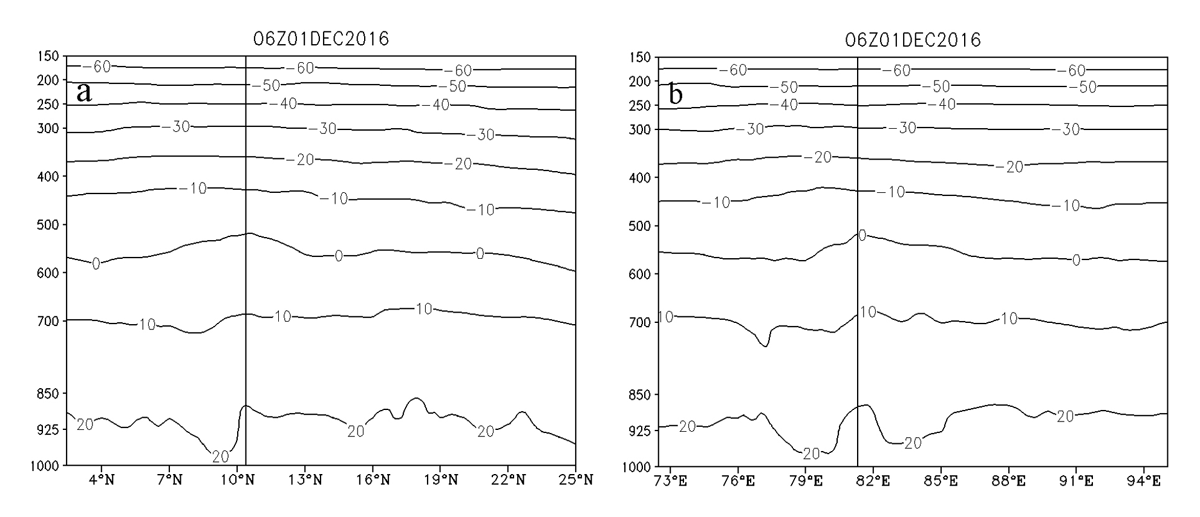
Figure 7
Vertical and horizontal cross-sections of air temperature (contour; unit in°C) along 82.2°E (a) and 10.5°N (b) at 06:00 UTC on December 1.
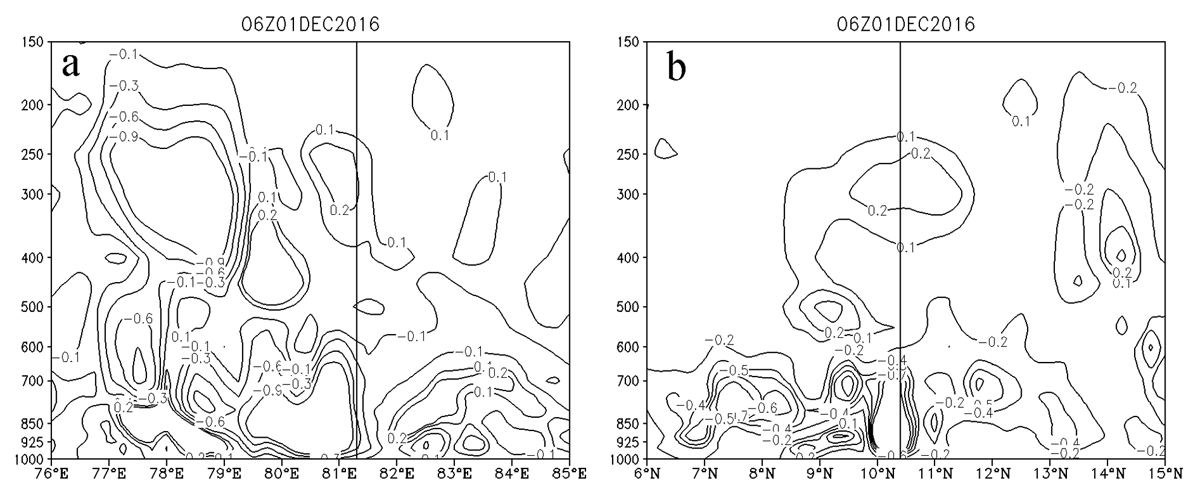
Figure 8
Vertical velocity (contour; unit in pa/s) along latitude 10.4°N (a) and longitude of 81.3°E (b) at the TC center at 06:00 UTC on December 1.
Table 2
Corresponding height of the maximum vertical velocity along with the longitudinal and zonal distribution near the TC center at 06:00 UTC on December 1.
| ZONAL | LONGITUDINAL | |||
|---|---|---|---|---|
| MAXIMUM (PA/S) | HEIGHT (HPA) | MAXIMUM (PA/S) | HEIGHT (HPA) | |
| Upward movement | 0.9 | 1000–500 | 0.7 | 1000–650 |
| Subsidence motion | 0.2 | 500–300 | 0.2 | 600–300 |
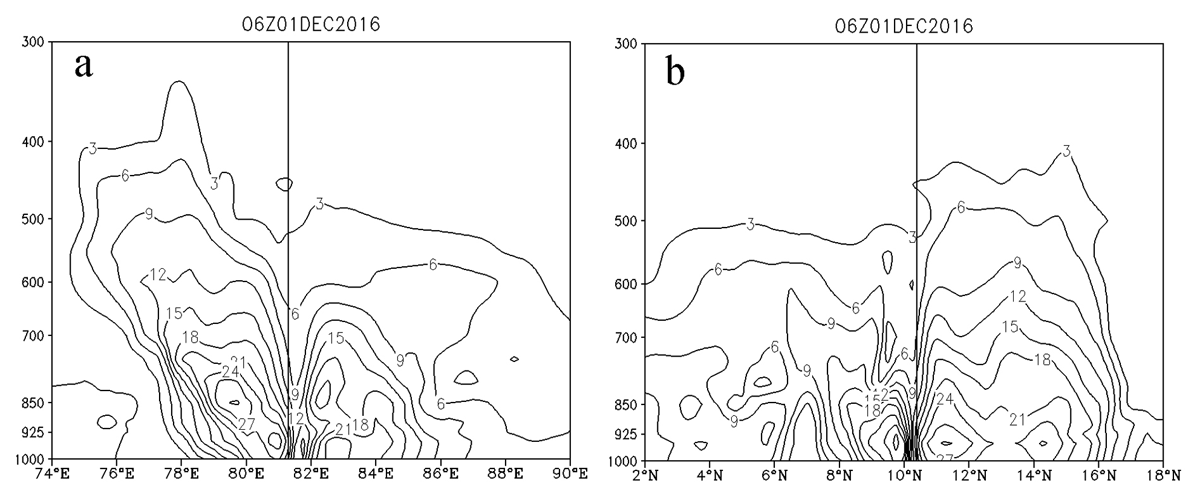
Figure 9
Water vapor flux (contour; in g/(cm·hPa·s)) along latitude 10.4°N (a) and longitude 81.3°E (b) at the TC center at 06:00 UTC on December 1.
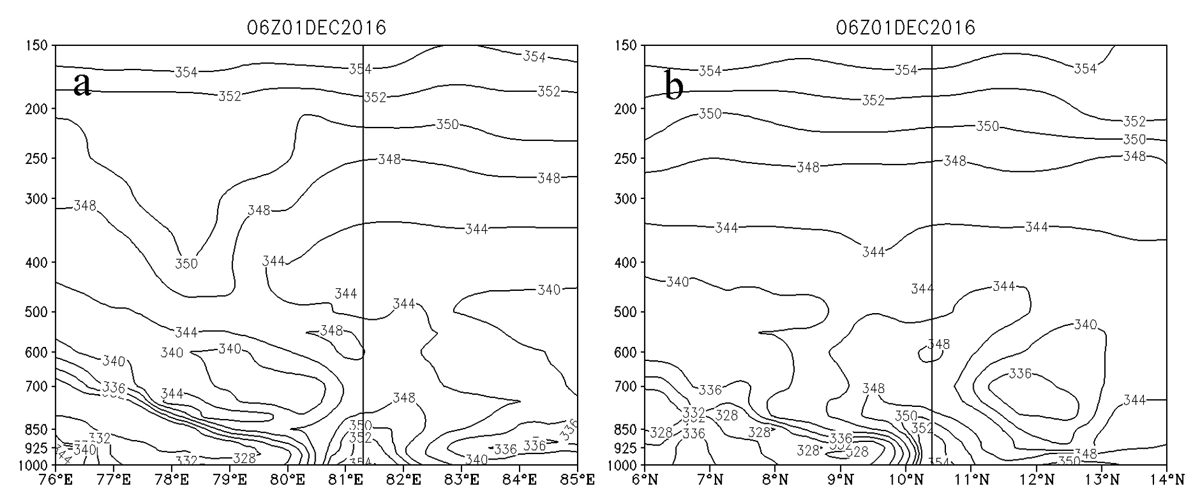
Figure 10
The pseudoequivalent potential temperature (contour; unit in K) at the TC center at 06:00 UTC on December 1 along latitude 10.4°N (a) and longitude 81.3°E (b).
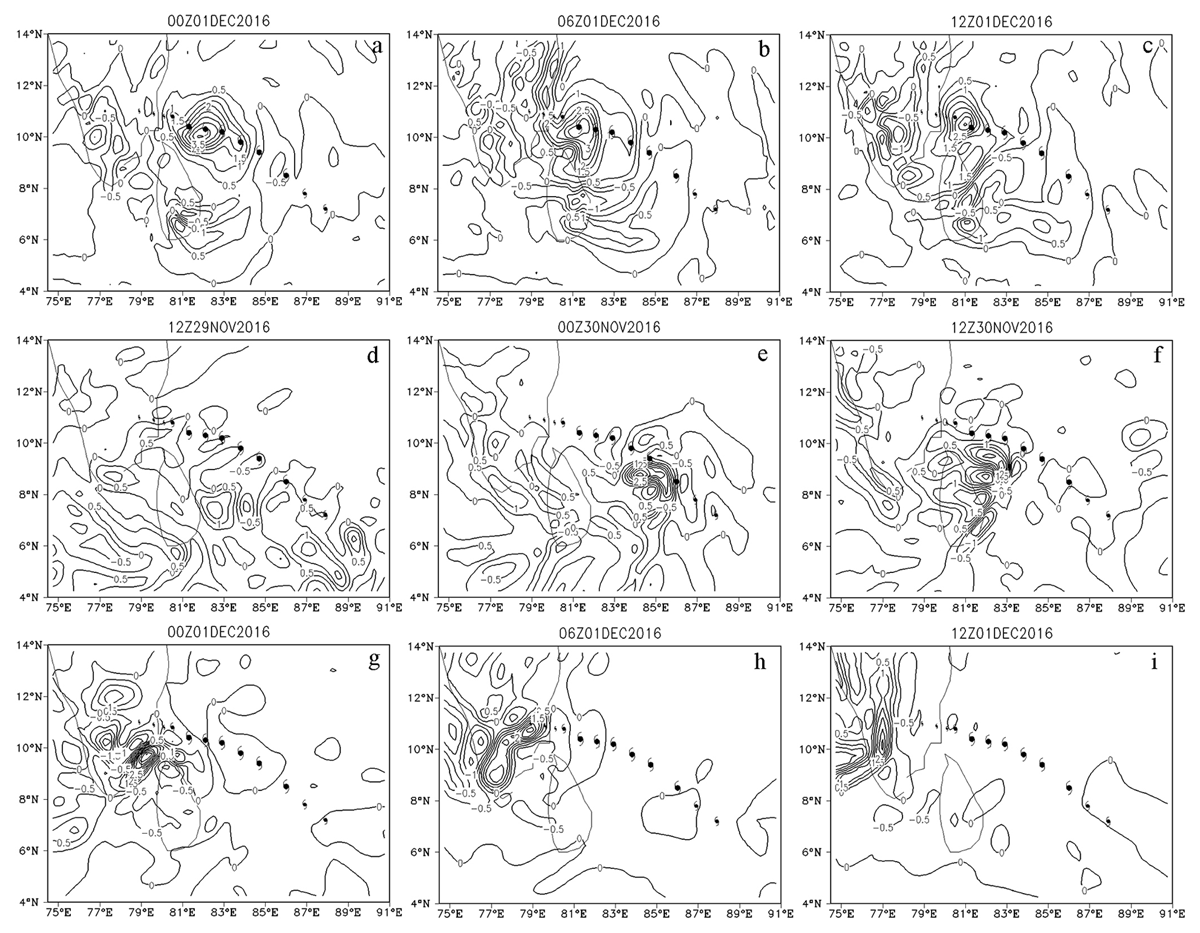
Figure 11
Vorticity (contour; unit in × 10–4 s–1) at 850 hPa (a–c) and at 300 hPa (d–i) during the passage of Nada.
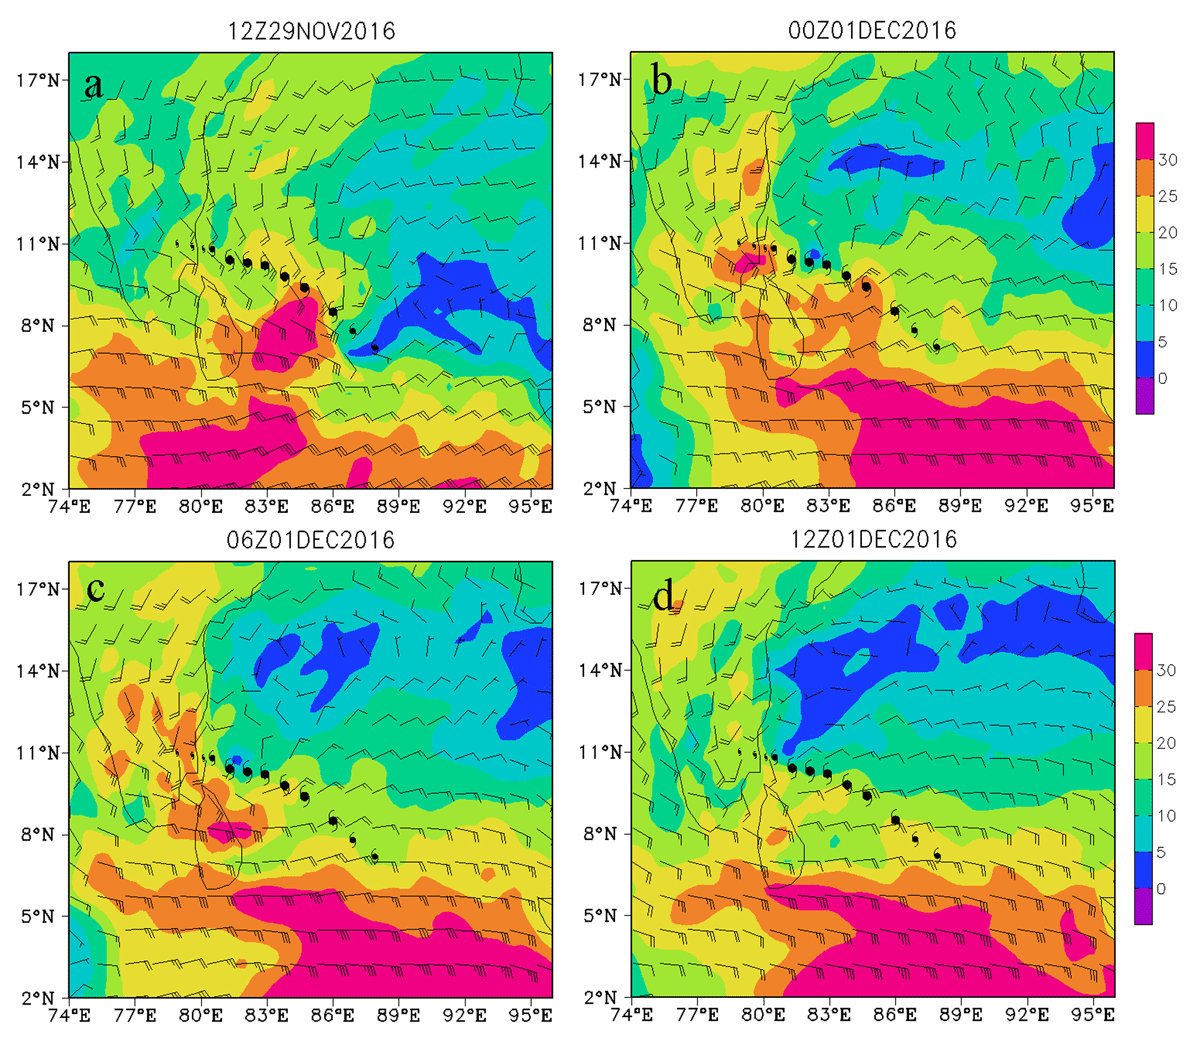
Figure 12
Vertical wind shear (shade; unit: m/s) and wind field (vanes; unit: m/s) of the entire convective layer (200–850 hPa).
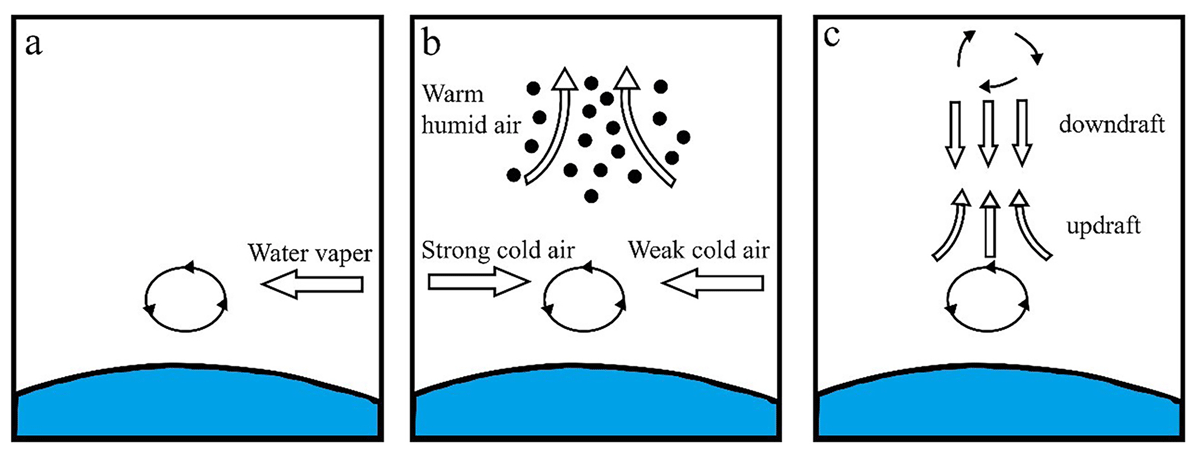
Figure 13
The mechanism of precipitation induced by TC Nada.