
1. Introduction
Tropical cyclones (TCs) are strong interactions between the atmosphere and the ocean. During TC landing, strong winds, torrential rains, and storm surges occur frequently and cause serious damage to human life and property. Research on the characteristics of cyclones and climate drivers has made great progress in the North Indian Ocean. Eighty percent of the world’s deadliest cyclones form in bays, even though no more than 7% of the world’s cyclones occur in the Bay of Bengal (Bhardwaj and Singh, 2019). TC activities in North Indian Ocean are highly seasonal, the northeast monsoon period (October to December) is the main cyclone season, followed by the pre-southwest monsoon Period (April to May) (Balachandran and Geetha, 2014). Destructive tropical cyclones often occur in the North Indian Ocean, and the east coasts of India are particularly prone to TC activities (Kumar et al., 2017; Mohapatra and Kumar, 2017; Mishra and Vanganuru, 2020).Strong winds and storm surges produced by TCs making landfall can cause tremendous damage in coastal areas, and the deadliest and most destructive disaster may be inland freshwater flooding induced by extreme precipitation (Marks et al., 1998; Xu et al., 2014).
Early observations have indicated that TCs generally trigger the most precipitation in front (either front-right or front-left) of the storm center (Burpee and Black, 1989; Rodgers et al., 1994). In the Northern Hemisphere, the surface friction gradient between land and ocean causes convergence on the right side of the storm motion track when a TC approaches land (Xu et al., 2014). Previous studies have indicated that both offshore TCs and landfall TCs show obvious characteristics of rainfall (or convective activity) asymmetries (Lonfat et al., 2004; Chen et al., 2006). Uddin et al. (2021) examined the impacts of environmental vertical wind shear (200–850 hPa) and storm motion on the asymmetry of TC rainfall in the North Indian Ocean, and found that the maximum rainfall was concentrated on the downshear left quadrant in the Bay of Bengal. Balachandran and Geetha (2014) found that the maximum TC rainfall was concentrated in front-left quadrant and the asymmetry was significant during the TC enhancement phase. There are three schools in the maximum rainfall area of cyclone-induced precipitation. First, some observations and numerical studies have shown that the precipitation induced by landfall TCs is mostly concentrated on the right side of the TCs’ path (Tuleya and Kurihara, 1978; Raghavan, 1981; Powell, 1982). Second, some studies have found that the maximum rainfall is concentrated on the left side of the landfall TC (Parrish et al., 1982; Blackwell, 2000). Third, some studies based on satellite composite data have shown that the maximum rainfall is located in the left front quadrant of tropical storms, while in hurricanes or typhoons, this is located in the right front quadrant (Lonfat et al., 2004).
In fact, the combination of cold air and TCs often leads to instability of atmospheric stratification and sometimes promotes the generation and development of mesoscale convective systems, which is conducive to the occurrence of extreme rainfall events. For example, Typhoon Begonia gradually combined with cold air, and dry cold air entered the northern part of the typhoon from the mid-level and high-level troposphere, which was the motive force for mesoscale convection systems, resulting in short-term heavy rainfall that lasted for nearly 5 hours (Chen et al., 2020). Kumar et al. (2020) found that synergistic interactions between a low-pressure system, an intrusion of dry air in the middle troposphere, and the offshore trough was the main reason for Kerala’s flood event. Moreover, mesoscale numerical studies and sensitivity experiments have shown that the peripheral flow changes significantly when cold and warm air invades the periphery of a TC (Han and Wu, 2008). The intrusion of cold air into the periphery of TCs can greatly increase precipitation in the periphery and inverted troughs. Due to radiative cooling and weak cold air infiltration, the precipitation center of northward typhoon Ambi moved from its right-front side to the left-front side, and precipitation intensity increased significantly (Niu et al., 2005; Mina et al., 2020). However, most studies have focused on the effects of dynamic and thermal conditions on the increase in the intensity of rainfall. There is still a lack of understanding that the location of the precipitation center changes with cold air intrusion, especially after TC landfall.
Nada originated as a tropical depression at 7.2°N, 87.9°E at 12:00 UTC on November 29, 2016 and became a tropical storm at 7.8°N, 86.9°E at 18:00 UTC on November 29. Nada intensified at 06:00 UTC on November 30 with a maximum wind speed of 23 m/s and then weakened into a tropical depression (Table 1). At 00:00 UTC on December 2, Nada made landfall on the southeastern coast of the Indian Peninsula. As a fast moving and weaker cyclone, TC Nada was active during the northeast monsoon period, moving to the northwest and making landfall on the east coast of India, bringing heavy rainfall during the period. This paper focuses on investigating the mechanism of asymmetric precipitation over the Indian Peninsula during the passage of Nada. The data and methodology are given in Section 2, which is followed by a description of the precipitation distribution, convection, vertical shear, and air-sea interactions during the passage of Nada in Section 3. The mechanism is discussed in Section 4. Finally, a summary is presented in Section 5.
Table 1
Position, time, intensity, and MSLP (MSW: maximum sustained wind speed; and MSLP: minimum sea-level pressure).
| LAT. (°N) | LON. (°E) | TIME | MSW (M·S–1) | MSLP (MB) |
|---|---|---|---|---|
| 7.2 | 87.9 | 11/29/12 | 15.4 | 1000 |
| 7.8 | 86.9 | 11/29/18 | 18 | 996 |
| 8.5 | 86.0 | 11/30/00 | 20.6 | 993 |
| 9.4 | 84.7 | 11/30/06 | 23 | 989 |
| 9.8 | 83.8 | 11/30/12 | 23 | 989 |
| 10.2 | 82.9 | 11/30/18 | 23 | 989 |
| 10.3 | 82.1 | 12/01/00 | 20.6 | 993 |
| 10.4 | 81.3 | 12/01/06 | 20.6 | 993 |
| 10.8 | 80.5 | 12/01/12 | 18 | 996 |
| 10.8 | 80.1 | 12/01/18 | 12.8 | 1004 |
| 10.9 | 79.6 | 12/02/00 | 10.3 | 1007 |
| 11 | 78.9 | 12/02/06 | 10.3 | 1007 |
2. Data and methodology
2.1 Data
The 3-hourly accumulated precipitation product with spatial resolutions of (0.25)° × (0.25)° was provided by the Tropical Rainfall Measuring Mission (TRMM), which was generated from the TRMM Multisatellite Precipitation Analysis and the Near Real-Time (RT) processing stream (available at https://daac.gsfc.nasa.gov/). TRMM precipitation measurement data products have been widely used in many studies, such as tropical cyclone forecasting, numerical weather forecasting, and precipitation climatology (Huffman et al., 2016).
The best track data of TC Nada with 6-hourly intervals, including time, wind speed, and the central location, were obtained from the Joint Typhoon Warning Center (JTWC) (available at https://www.metoc.navy.mil/jtwc/jtwc.html). The dynamic characteristics of TC Nada are shown in Table 1.
The air temperature, relative humidity, specific humidity, vertical velocity, and u and v components of wind speed at different pressure levels with 6-hourly intervals were obtained from ERA5 reanalysis dataset (available at https://cds.climate.copernicus.eu/cdsapp#!/search). ERA5 reanalysis dataset combines model predictions data with observations to provide global atmospheric data with spatial resolutions of (0.25)° × (0.25)° (Hersbach et al., 2018).
2.2 Methodology
The pseudoequivalent potential temperature (θse) is also known as the equivalent potential temperature (Holton and Staley, 1973), and it is an important parameter to measure atmospheric stability. The pseudoequivalent potential temperature is calculated by Eq (1),
where Tk, p and r are the absolute temperature (K), air pressure (hPa) and specific humidity (g/g) on the original surface, respectively. TL is the absolute temperature at the condensation height, which is calculated by Eq (2)
where e is water vapor pressure (hPa).
Vertical wind shear and storm movement are two important factors that cause the asymmetry of rainfall in TCs (Chen et al., 2006). Vertical wind shear presents the change in the vertical direction of the wind and is usually calculated as the difference in wind speeds between 850 hPa and 200 hPa, as shown in Eq (3).
where u200 and u850 are the zonal wind speeds on the isobaric surface at 200 hPa and 850 hPa, respective v200 and v850 are the meridional wind speeds on the isobar surface of 200 hPa and 850 hPa, respectively.
3. Results
3.1 Path of TC Nada and precipitation distribution
The India Meteorological Department has divided the cyclones of the North Indian Ocean according to the maximum sustained surface winds into seven categories since 1999: low-pressure area (less than 9 m/s), depressions (9–14 m/s), deep depressions (15–17 m/s), cyclonic storms (18–24 m/s), severe cyclonic storms (25–32 m/s), very severe cyclonic storms (33–61 m/s), and supercyclonic storms (over 62 m/s) (Mohapatra et al., 2011).
The track of Nada had a east-west direction in its movement, as shown in Figure 1a. Nada passed through northern Sri Lanka on December 1 and then landed on the Indian Peninsula before 00:00 UTC on December 2 and dissipated 6 hours later. Nada intensified into a tropical storm with a maximum wind speed of 23 m/s and a minimum sea-level pressure of 989 hPa for 12 hours from 06:00 UTC to 18:00 UTC on November 30 (Figure 1b). The minimum sea-level pressure had a strong negative correlation with the maximum wind speed, which significantly impacted the distribution of TC-induced rainfall.
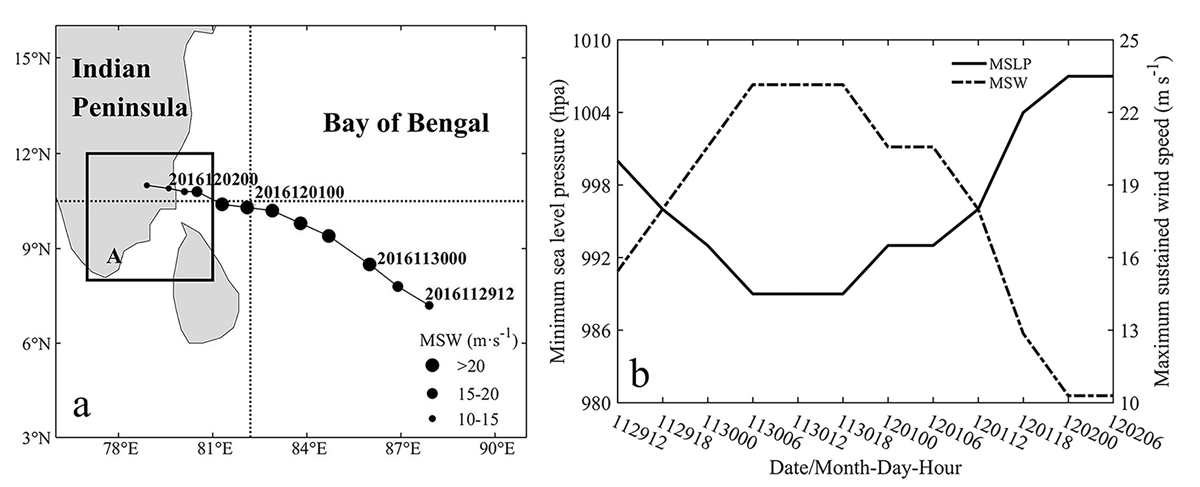
Figure 1
Track (a) and intensity (b) of TC Nada. The locations of the TC center every 6 hours are represented by black circles in the time format of year-month-day-hour, the two dashed black lines indicate 10.5°N and 82.2°E, respectively, and the solid box A indicates the study box (8°N–12°N, 77°E–81°E) in (a). The solid black line and the dashed line indicate the minimum sea-level pressure and maximum sustained wind speed of the TC in (b), respectively.
Figure 2 shows the daily precipitation distribution from November 29 to December 1 during the passage of Nada. Nada started to affect precipitation over the island of Sri Lanka and the Indian Peninsula on November 30. Nada was generated at sea and moved northwestward from the Bay of Bengal until it landed on the Indian Peninsula. The core- and outer-spiral rainbands had heavy precipitation centers, which were asymmetrically distributed and concentrated on the left side of Nada’s path (Figure 2). On December 1, there were two precipitation centers with accumulated precipitation of 42.77 mm and 66 mm in 24 hours (Figure 2c). Moreover, extreme precipitation occurred in the regions with distances from the TC center within 500 km, representing the principal rainband rainfall of TC Nada. TC-induced precipitation outside the main rainband occurred at a distance greater than 800 km from the center of the TC (Tao et al., 1979).
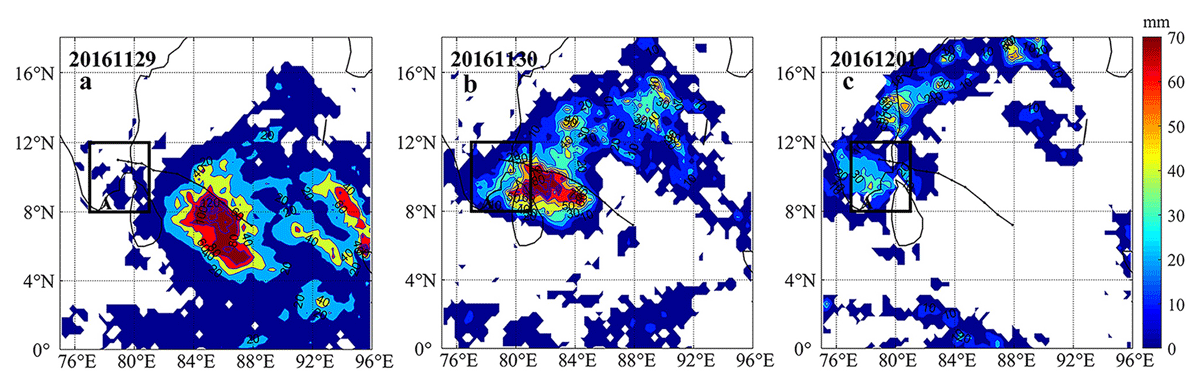
Figure 2
Daily precipitation distribution during the passage of Nada (the color bar represents rainfall (in mm)).
The time series evolution of the maximum wind speed radius calculated by the best trajectory data from the Joint Typhoon Warning Center (JTWC) is presented in Figure 3, which is used to investigate the relationship between Nada and precipitation distribution. The maximum wind speed radius increased sharply after Nada originated and reached a maximum of 97.19 km when Nada was enhanced to a maximum wind speed of 23 m/s at 06:00 UTC on November 30 for 12 hours. However, the maximum wind speed radius gradually decreased to 80.99 km but increased to 86.39 km at 12:00 UTC on December 1, and then it suddenly decreased to a minimum value of 16.2 km until the end of TC Nada. The bar in Figure 3 shows the evolution of the average precipitation rate in box A over time during the passage of Nada. The precipitation rate increased from 1.2 mm/hr at 00:00 UTC on December 1 to a maximum of 1.78 mm/hr at 06:00 UTC on December 1. The rainfall rate over the southern Indian Peninsula (box A) was negatively correlated with the maximum wind speed radius at 06:00 UTC on December 1, which indicates that the fluctuation in the radius of the maximum wind speed was related to the trend of local extreme precipitation in the main rainband within 500 km (<800 km) from the center of the TC. A similar phenomenon was found in East China by Pan et al. (2018).
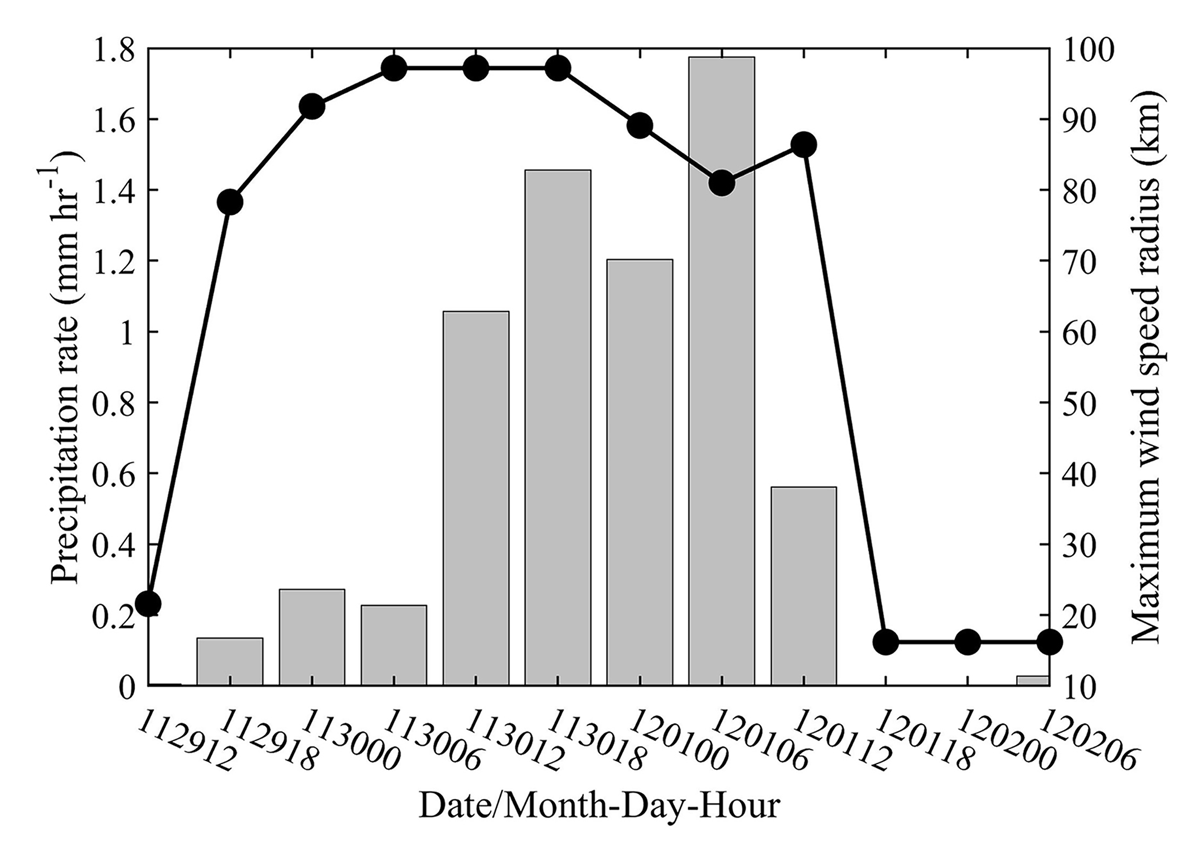
Figure 3
Time series of the maximum wind speed radius (polyline, unit in km) and average precipitation rate in Box A (bar, unit in mm/hr) during the track of Nada.
3.2 Water vapor conditions
Water vapor flux is one of the necessary conditions for torrential rain and can be used to analyze the source of vapor for precipitation caused by TCs. Figure 4a–c shows the wind field and water vapor flux at 850 hPa. Water vapor was transported to the northwest along the path of Nada, providing a large amount of water vapor for heavy rain. Figure 4d–f shows the wind field and water vapor flux at 300 hPa during the imminent landfall of Nada. The maximum water vapor flux area near the TC center was mainly concentrated on the left side of the TC path. The water vapor flux was asymmetrically distributed, similar to the distribution of precipitation, that is, the water vapor flux distribution near the TC center corresponded to the precipitation distributed in the TC core, while outside of the 3 times maximum wind speed radius corresponded to the precipitation distributed in the spiral rain belt.
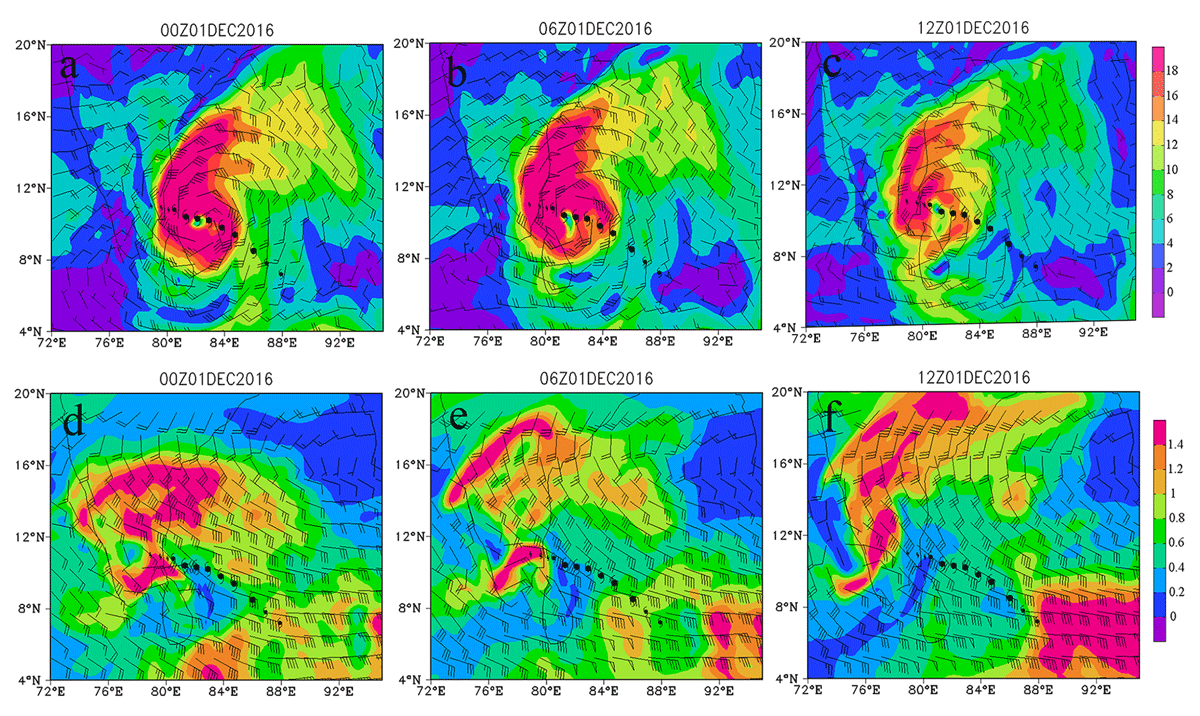
Figure 4
Wind field (vanes) and water vapor flux (shaded; in g/(cm·hPa·s)) at 850 hPa (a–c) and 300 hPa (d–f) on December 1.
Moreover, the water vapor flux divergence is used to describe the accumulation of water vapor. A positive value indicates that water vapor was lost, while a negative value indicates that water vapor accumulated. The water vapor flux divergence at 850 hPa during the imminent landfall of Nada is shown in Figure 5a–c. On December 1, abundant water vapor accumulated in the southeastern part of the Indian Peninsula, providing ample water vapor conditions for the heavy rainfall that occurred on the Indian Peninsula (Figure 2). Figure 5d–f shows the water vapor flux divergence at 300 hPa during the imminent landfall of Nada on December 1. The negative value area was mainly concentrated on the left side of the TC path, which was conducive to the accumulation of water vapor and provided abundant water vapor conditions for precipitation on the left side of the TC path.
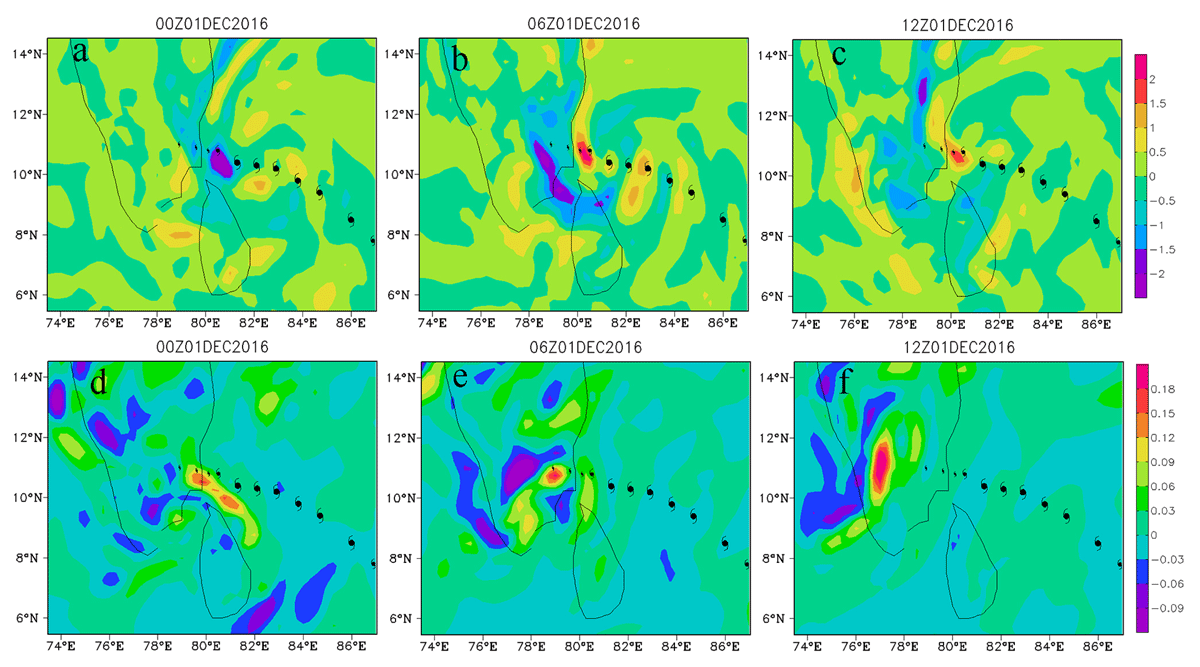
Figure 5
Water vapor flux divergence (shaded; unit in × 10–8 g/(cm2·hPa·s) at 850 hPa (a–c) and 300 hPa (d–f) on December 1.
3.3 Air temperature
To further investigate the reason for the extreme precipitation event, the thermal factor of the atmosphere was analyzed during the passage of Nada. The cold air invasion at 850 hPa is presented in Figure 6, which came from the left and right sides of the TC path. Cold air intrusion was not obvious before the passage of Nada (Figure 6a). During the passage of Nada, the cold air expanded significantly, and the cold air invasion on the left side of the TC track extended to the southern Indian Peninsula on December 1 (Figure 6d–f). However, the cold air on the left side of the TC track was relatively stronger than that on the right side of the TC track in Figure 6e, which may have been one of the reasons for the asymmetry in the extreme precipitation.
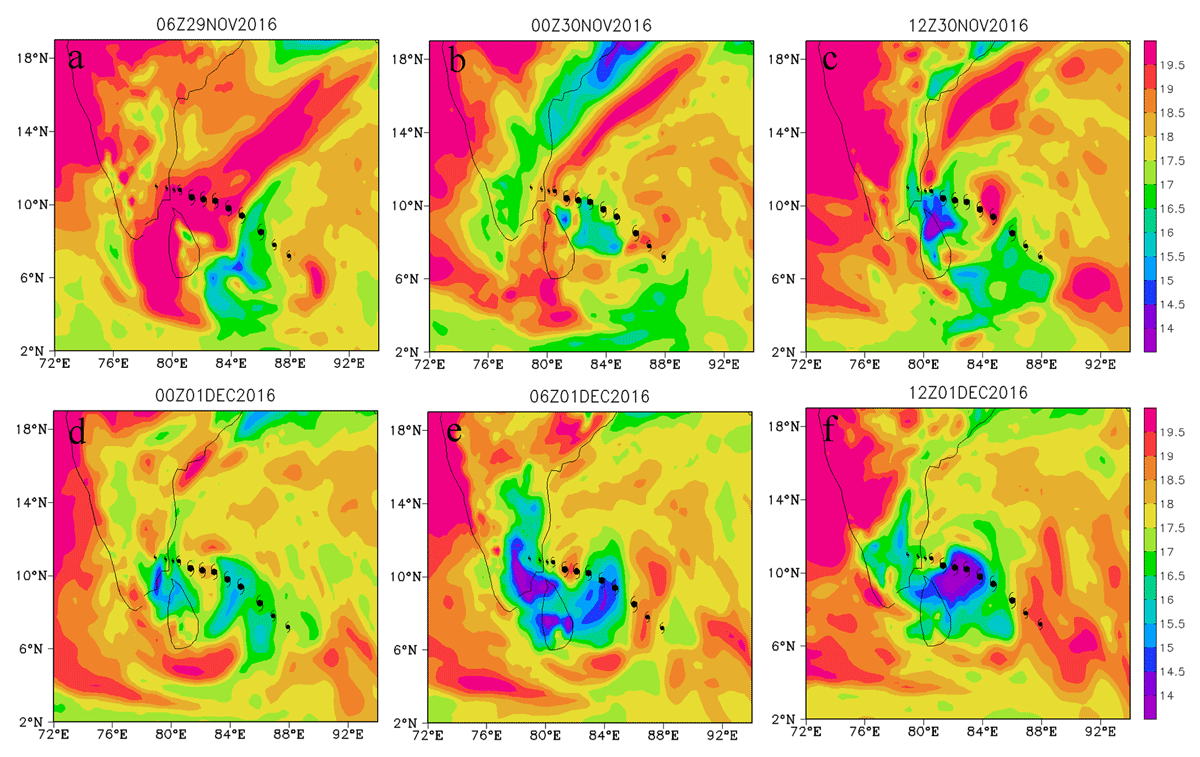
Figure 6
The air temperature ((shaded; unit in°C)) at 850 hPa during the passage of Nada.
Figure 7 shows the air temperature in the cross-section at the TC center at 06:00 UTC on December 1. The vertical longitudinal (latitudinal) section follows 81.3°E (10.4°N) in Figure 7a (Figure 7b). As shown in Figure 7a, the air temperature decreased significantly from 1000 hPa to 700 hPa and increased slightly from 600 hPa to 300 hPa. Similar phenomena also existed in the latitudinal section (Figure 7b), where the near-surface temperature decreased due to the invasion of cold air (Figure 6), and the temperature of the upper atmosphere increased due to the lifting of warm and humid air at the lower level by the invasion of cold air.
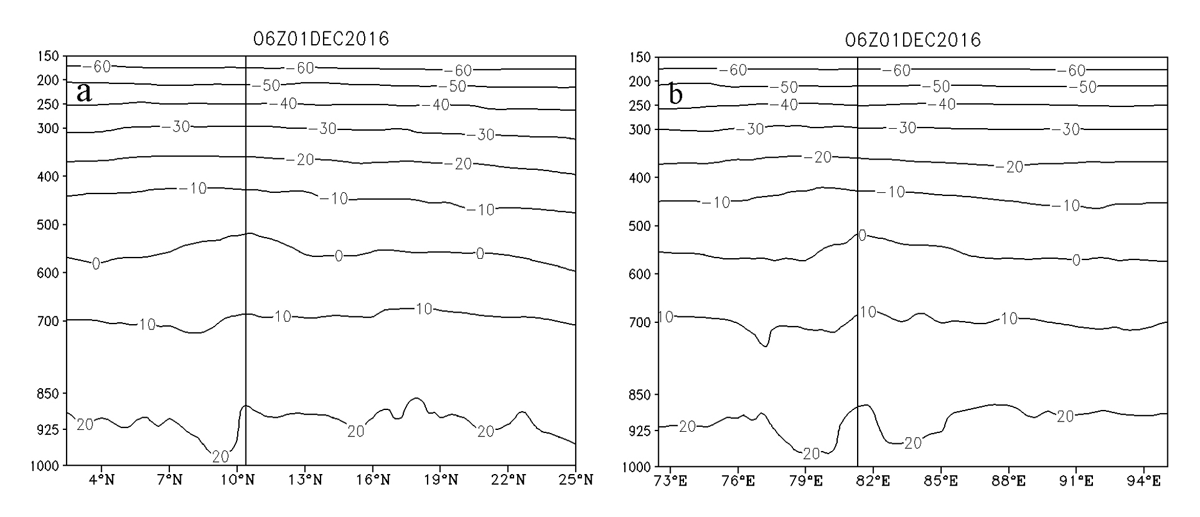
Figure 7
Vertical and horizontal cross-sections of air temperature (contour; unit in°C) along 82.2°E (a) and 10.5°N (b) at 06:00 UTC on December 1.
3.4 Air vertical velocity
In addition to the thermal variation and horizontal movement, the vertical movement of the atmosphere played a significant role in the weather system.
Figure 8 shows the evolution of vertical velocity at the TC center at 06:00 UTC on December 1. There was a strong ascending zone with a maximum velocity of 0.9 pa/s at 1000–500 hPa near the TC center (Figure 8a). On the left of the TC center (over Box A), there was subsidence motion at 500–300 hPa, and the maximum velocity was 0.2 pa/s (Table 2). The vertical velocity along the longitudinal direction is shown in Figure 8b. Near the center of Nada, there was still in a strong upward motion under 600 hPa, and the maximum velocity range was at 1000–650 hPa with 0.7 pa/s. Similarly, there was subsidence motion at 600–300 hPa, and the maximum velocity was 0.2 pa/s (Table 2) to the left of the TC center. The upward motion deviated to the left side of the TC center (Figure 8a–b), and the convergence of the lower layers and divergence of the middle and upper layers might have been the cause of precipitation production on the left side of the TC path (Figure 2).
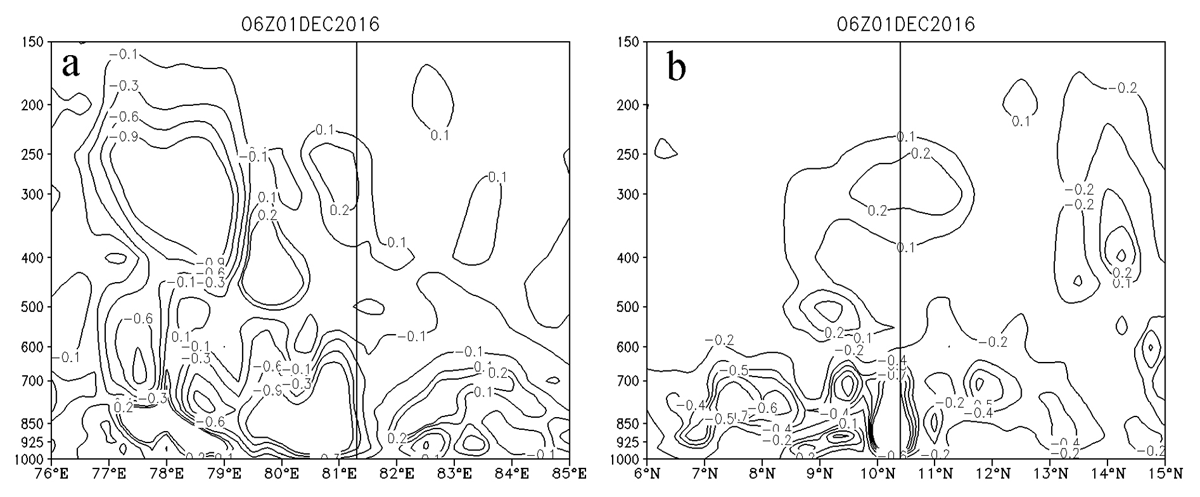
Figure 8
Vertical velocity (contour; unit in pa/s) along latitude 10.4°N (a) and longitude of 81.3°E (b) at the TC center at 06:00 UTC on December 1.
Table 2
Corresponding height of the maximum vertical velocity along with the longitudinal and zonal distribution near the TC center at 06:00 UTC on December 1.
| ZONAL | LONGITUDINAL | |||
|---|---|---|---|---|
| MAXIMUM (PA/S) | HEIGHT (HPA) | MAXIMUM (PA/S) | HEIGHT (HPA) | |
| Upward movement | 0.9 | 1000–500 | 0.7 | 1000–650 |
| Subsidence motion | 0.2 | 500–300 | 0.2 | 600–300 |
4. Discussion
4.1 The role of cold air intrusion
Strong cold air plays an important role in the intensity of strong convective weather (Tang et al., 2019). During the passage of Nada, cold air intrusion at 850 hPa, as presented in Figure 6, came from the left and right sides of the TC path. An invasion of cold air can force warm, moist air to rise, which contributes to heavy rainfall in some areas (Huang et al., 2018). During the passage of Nada, the cold air on the left side of the TC track was relatively stronger than that on the right side of the TC track in Figure 6e, which may have been one reason for the asymmetry in the precipitation. Moreover, the stronger cold air intruded into the eye of Nada, enhancing the intensity of strong convection on the TC-left side, which was an important reason for the concentrated distribution of precipitation on the left side of the path. The weaker cold air invaded the TC-right-side periphery and strengthened the TC circulation, which was an important reason for the precipitation in the outer spiral rain belt.
The equilibrium atmospheric moisture content was elevated with increasing air temperature (Trenberth et al., 2003; O’Gorman and Muller, 2010). The water vapor flux along latitude (longitude) 10.4°N (81.3°E) at the TC center at 06:00 UTC on December 1 is presented in Figure 9. The air temperature increased slightly from 600 hPa to 300 hPa (Figure 7), and the water vapor rose from low levels near the TC center. Consequently, with an adequate water vapor supply (Figure 9), the warm and humid near-surface air lifted with cold air invasion (Figure 7), reducing the equilibrium atmospheric moisture content and leading to condensation and precipitation.
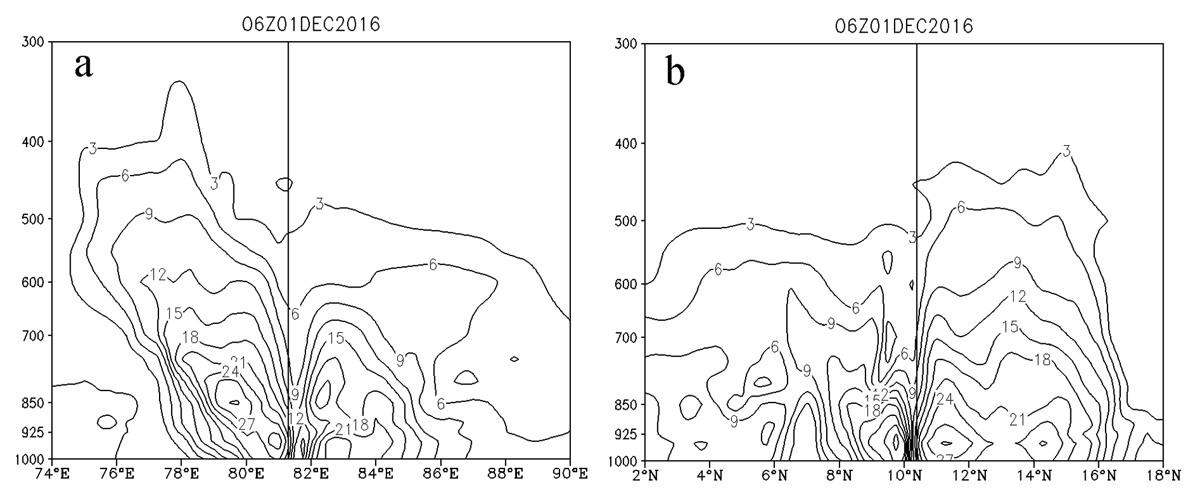
Figure 9
Water vapor flux (contour; in g/(cm·hPa·s)) along latitude 10.4°N (a) and longitude 81.3°E (b) at the TC center at 06:00 UTC on December 1.
4.2 Atmospheric stratification stability analysis
The pseudoequivalent temperature is commonly used to describe the stability of the atmosphere, which was calculated by Eqs (1) and (2). Figure 10 shows the evolution of pseudoequivalent potential temperature at the TC center at 06:00 UTC on December 1 along latitude (longitude) 10.4°N (81.3°E). There was significant cold air activity, which is consistent with the results in Figure 6. Along the track of Nada, there was a high gradient zone of pseudoequivalent temperature on the right side of the cold tongue over the Indian Peninsula, where the atmospheric junction was very unstable; this was a necessary condition in promoting precipitation on the Indian Peninsula. Between 850 and 1000 hPa, the isoline was dense, and the atmospheric junction was unstable, which easily produced strong convective weather (Zhu et al., 1981); at this time, cold air from the lower level invasions was more likely to lift warm and humid air, causing heavy precipitation.
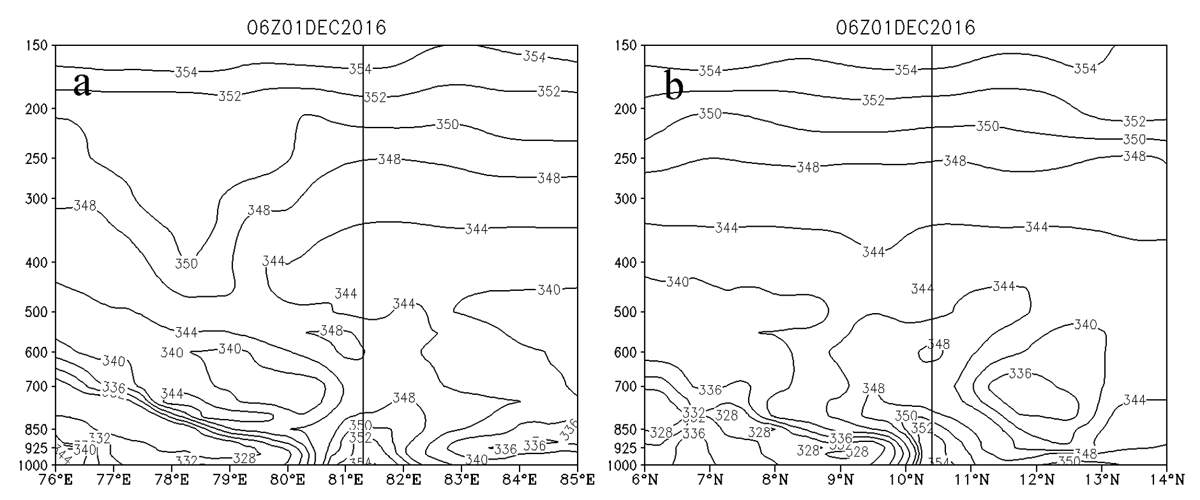
Figure 10
The pseudoequivalent potential temperature (contour; unit in K) at the TC center at 06:00 UTC on December 1 along latitude 10.4°N (a) and longitude 81.3°E (b).
According to the vorticity distribution at 300 hPa in Figure 11d–f, the positive vorticity was gradually strengthened on November 29 and 30. However, negative vorticity took the place of the positive vorticity after December 1 along the track of Nada (Figure 11g–i). The superposition of the convergence zone and positive vorticity circulation could have produced secondary circulation, which was conducive to local vorticity growth and rainstorm occurrence (Yan et al., 2019). On December 1, the negative vorticity of the middle and upper layers played a significant role because the convergence of the lower layers (Figure 11a–c) and the divergence of the middle and upper layers were favorable for precipitation in this study. A similar phenomenon was found by Wang (2021), who found that the combination of the convergence of low-level airflow and the middle-level downdraft resulted in precipitation in Northeast China.
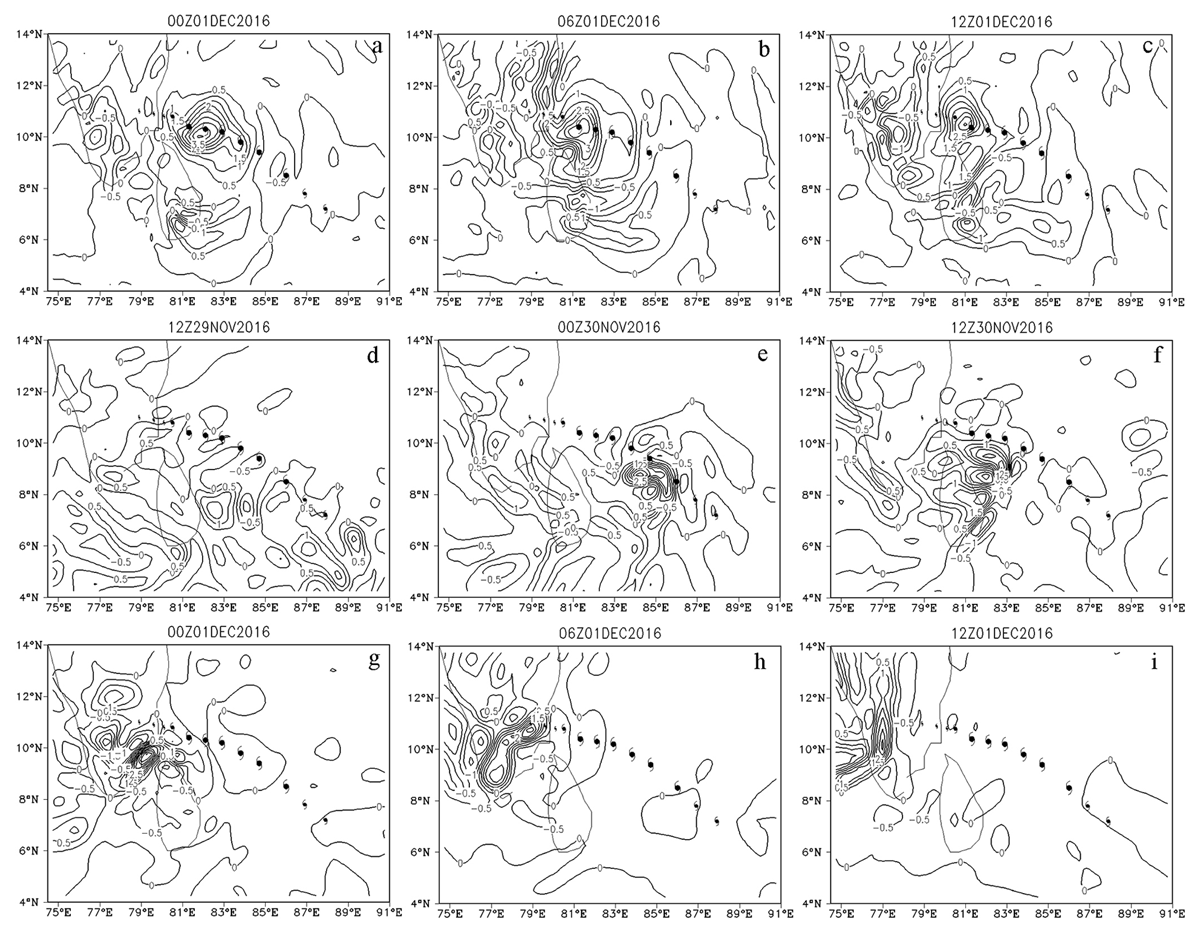
Figure 11
Vorticity (contour; unit in × 10–4 s–1) at 850 hPa (a–c) and at 300 hPa (d–i) during the passage of Nada.
Vertical wind shear is one of the major factors leading to asymmetric rainfall in TCs (Chen et al., 2006). Figure 12 shows the evolution of vertical wind shear and the whole-layer wind field. The positive (negative) vertical wind shear was located to the left (right) side of the TC path. The maximum value area of wind shear was consistent with the distribution area of extreme precipitation. Therefore, the wind shear effect was the main factor affecting the asymmetry of TC rainfall.
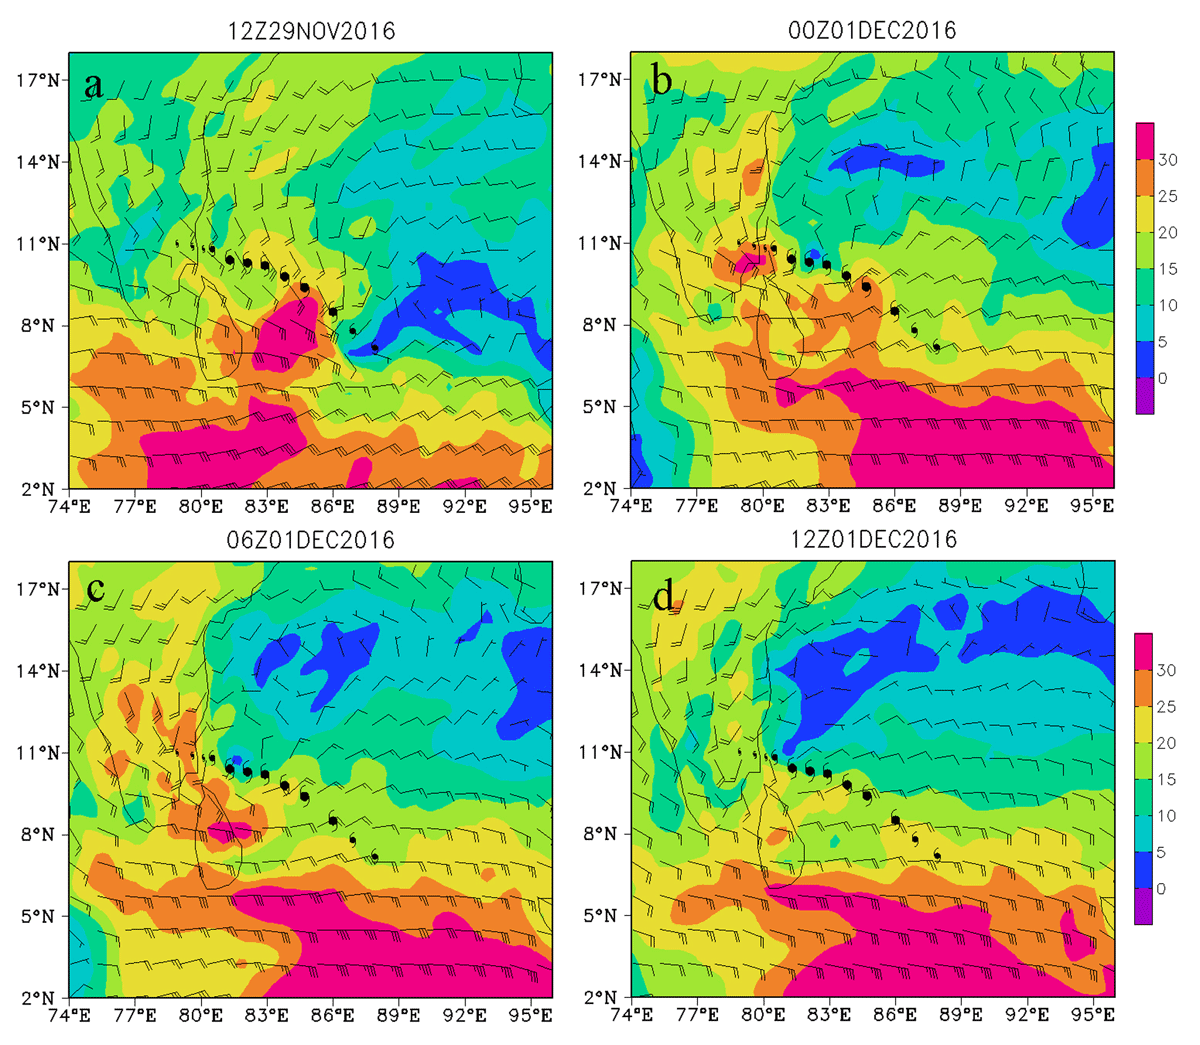
Figure 12
Vertical wind shear (shade; unit: m/s) and wind field (vanes; unit: m/s) of the entire convective layer (200–850 hPa).
Figure 13 shows the mechanism of precipitation induced by Nada. TC Nada brought water vapor from the ocean (Figure 13a), and the warm and humid air uplift caused by the invasions of lower-level cold air on the left and right sides of the TC path (Figure 13b), as well as the combined action of lower-level updraft and upper-middle-level downdraft (Figure 13c), led to the occurrence of precipitation events.
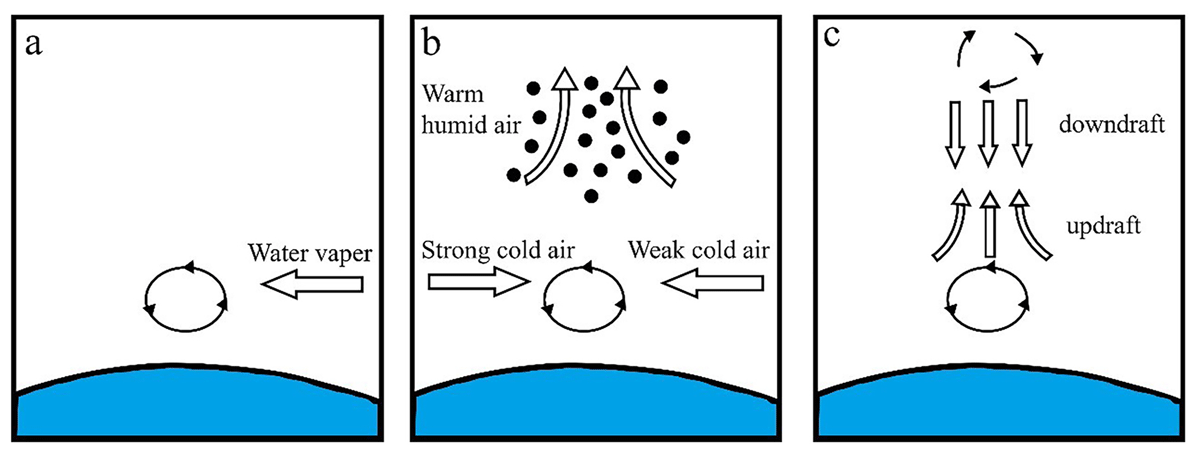
Figure 13
The mechanism of precipitation induced by TC Nada.
5. Conclusions
In this study, the interaction of air convection, water vapor conditions, and thermal and dynamic factors were analyzed to explore the mechanism of asymmetric precipitation during Nada landfall. The spacially averaged precipitation rate increased from 0.01 mm/hr to a maximum of 1.78 mm/hr on the southeastern coast of the Indian Peninsula (Box A) during the passage of Nada. Through the above analysis and discussion, the conclusions were as follows:
Precipitation was concentrated on the left side of the TC. The superposition between Nada and the invasion of cold air at the lower level raised the warm and humid air, and the convection effect with the middle and upper-level air resulted in precipitation.
Stronger cold air (<15°C) on the left side of the TC intruded into the eye of Nada and enhanced the intensity of strong convection. The weaker cold air on the right side of the TC invaded the periphery of Nada and strengthened TC circulation.
At 850 hPa, the vorticity of the TC center increased to more than 5 × 10⁻⁴ s–1 at 06:00 UTC on December 1, which was superimposed with the low-level cold air, maintaining and strengthening the updraft. Near the center of Nada, there was an exhibited strong upward motion, with a vertical velocity of 0.7 pa/s, which provided powerful conditions for strong convective weather and precipitation.
The asymmetric distribution of precipitation was also affected by the vertical wind shear. The positive (negative) vertical wind shear was located to the left (right) side of the TC path. The maximum value area of wind shear was consistent with the distribution area of extreme precipitation.
Acknowledgments
We thank Tropical Rainfall Measuring Mission (TRMM) (https://daac.gsfc.nasa.gov/) for providing precipitation data set, ERA5 (https://cds.climate.copernicus.eu/) for the air temperature, relative humidity, specific humidity, vertical velocity, u and v components of wind speed at different pressure levels. JTWC (https://www.metoc.navy.mil/jtwc/jtwc.html?north-indian-ocean) for providing TS track data. This work was funded by the Postgraduate Research & Practice Innovation Program of Jiangsu Province (Grant no. SJCX20_1244, SJCX20_1246, SJCX21_1487), the Priority Academic Program Development of Jiangsu Higher Education Institutions (PAPD), Open Fund of Jiangsu Institute of Marine Resources Development (Grant no. JSIMR202005) and National Natural Science Foundation of China (Grants no. 62071207).
Competing interests
The authors have no competing interests to declare.