
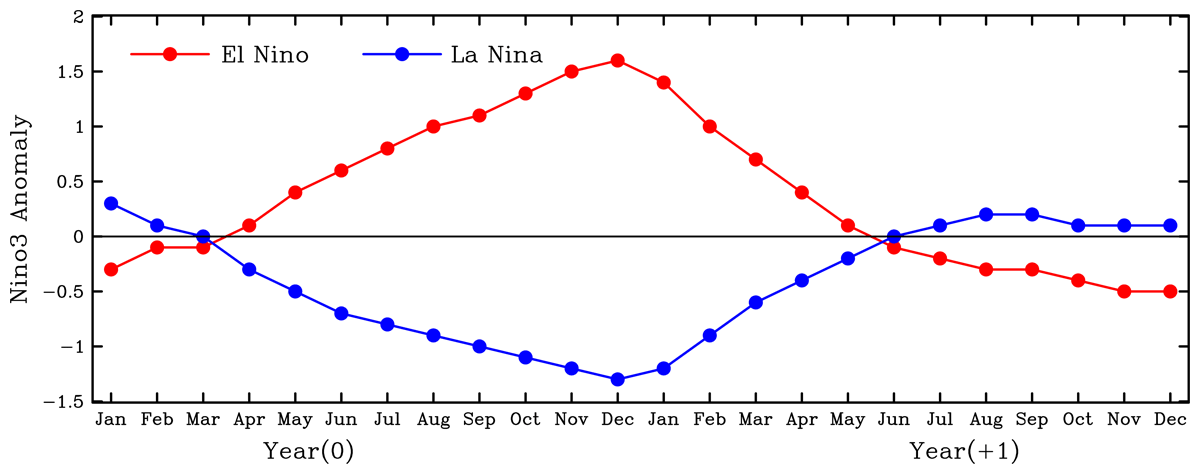
Figure 1
Evolutions of SST3a (unit: K) for El Niño and La Niña composites from January (0) to December (+1). The years for El Niño were 2003, 1987, 1994, 1976, 2006, 2018, 2002, 1965, 1986, 2009, 1991, 1972, 2015, 1982, 1997, and the years for La Niña were 1973 1975 1970 2007 1999 1967 1988 2010 1984 2017 1998 1964 1971 1996, 1995, and the year order was based on higher and lower values of SST3DJF respectively. For example, the SST3DJF of the 0 year of 2003 means SST3 averaged from December 2003 to February 2004, and so on.
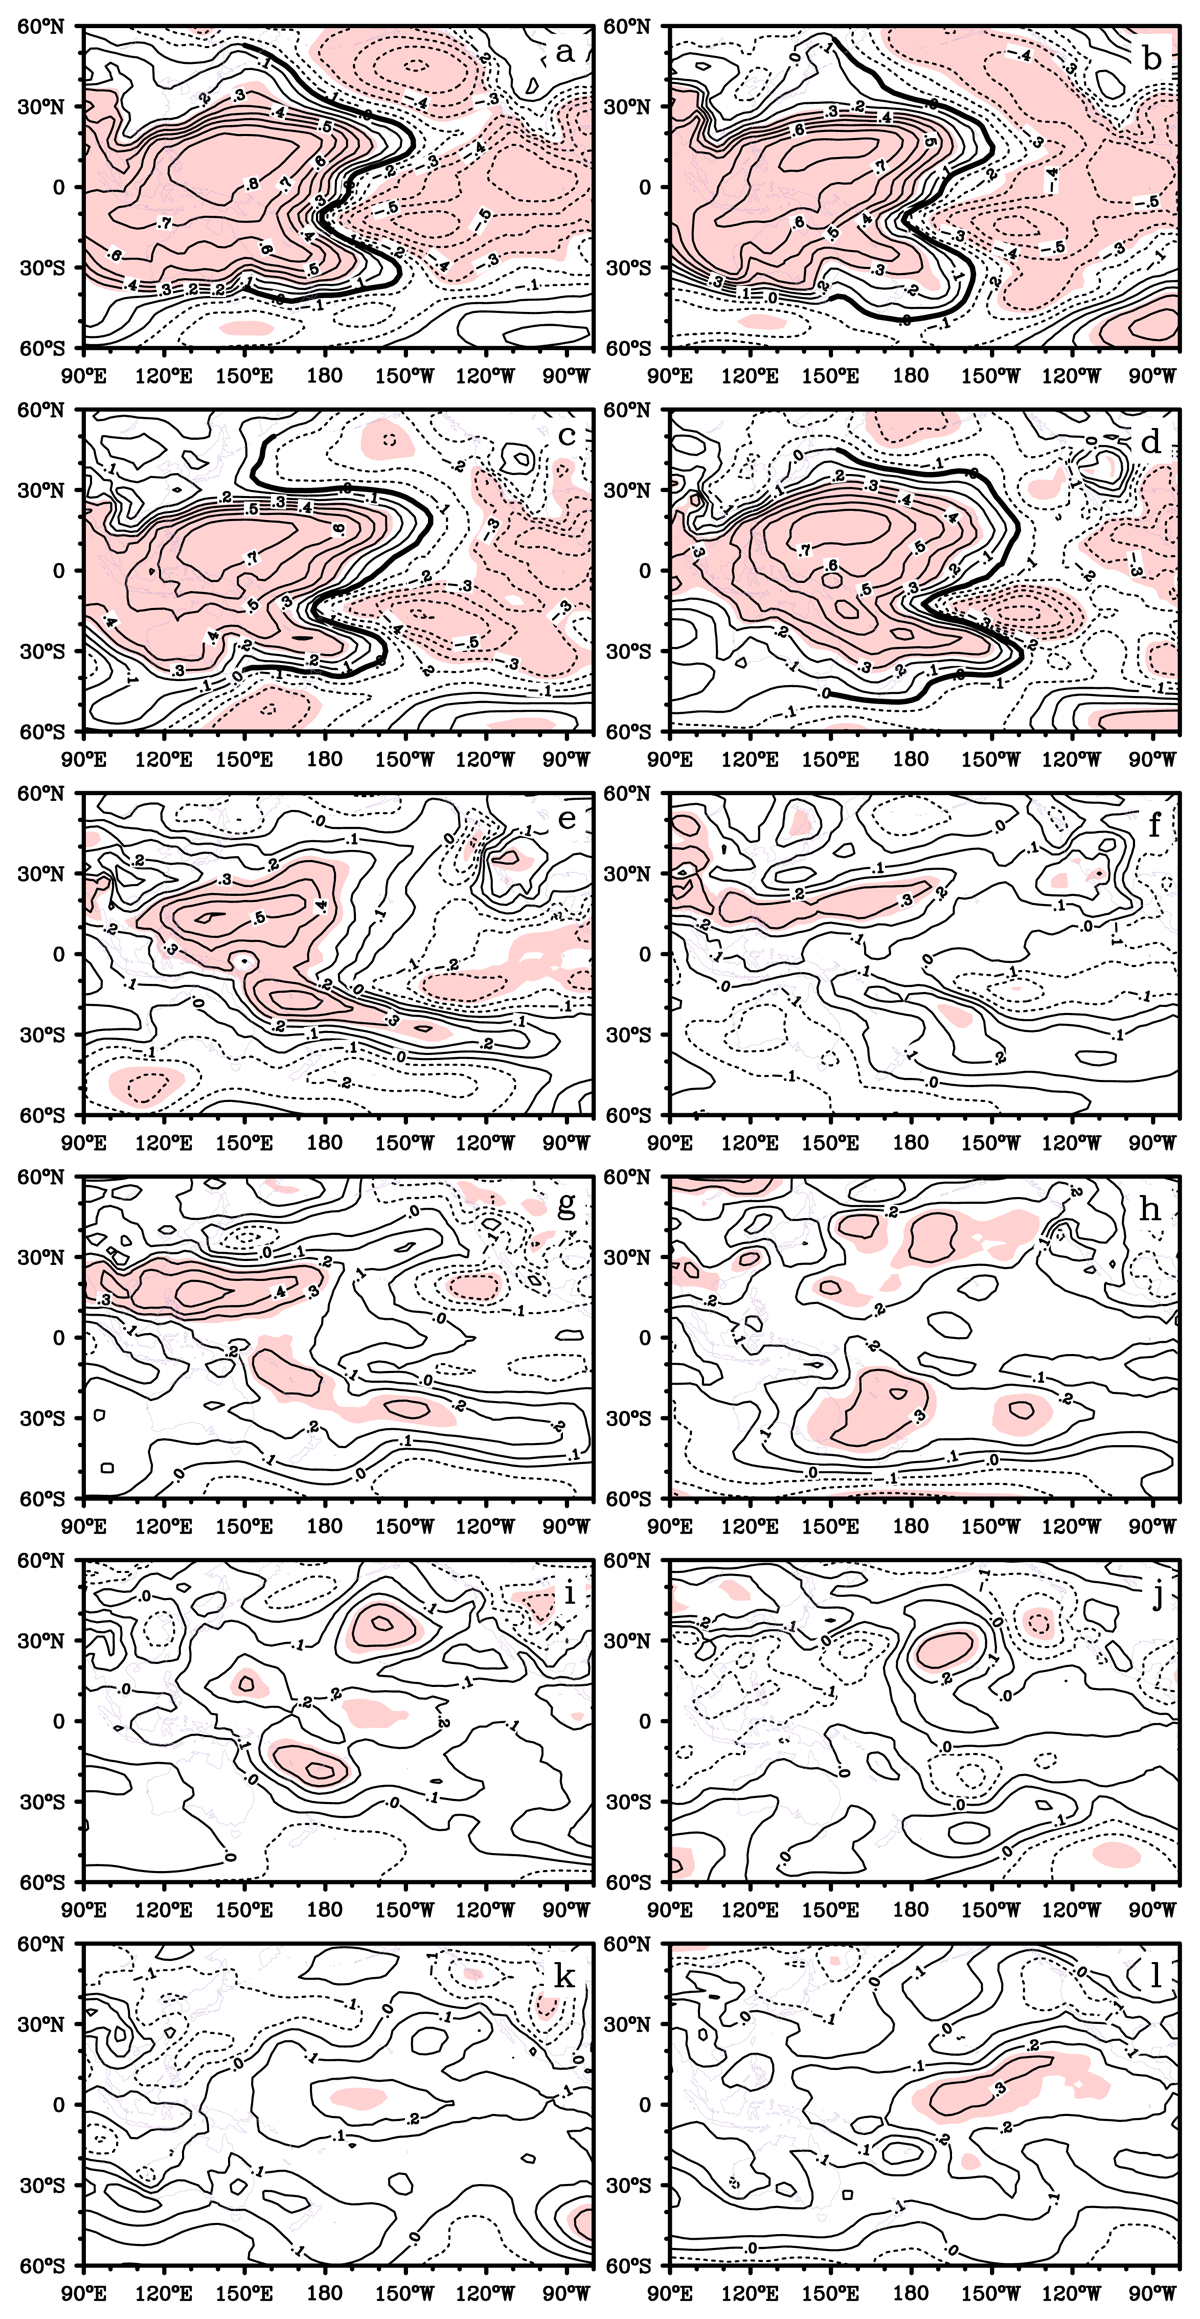
Figure 2
Correlation between the SST3DJF and SLP from January (+1) to December (+1). Shaded areas were at 95% significance. The contour interval was 0.1, and dashed contour lines indicated the negative values. The bold lines that are roughly along the zero contour lines east of 150°E in Fig. 2a-d illustrate the pattern of the mirror sigma.
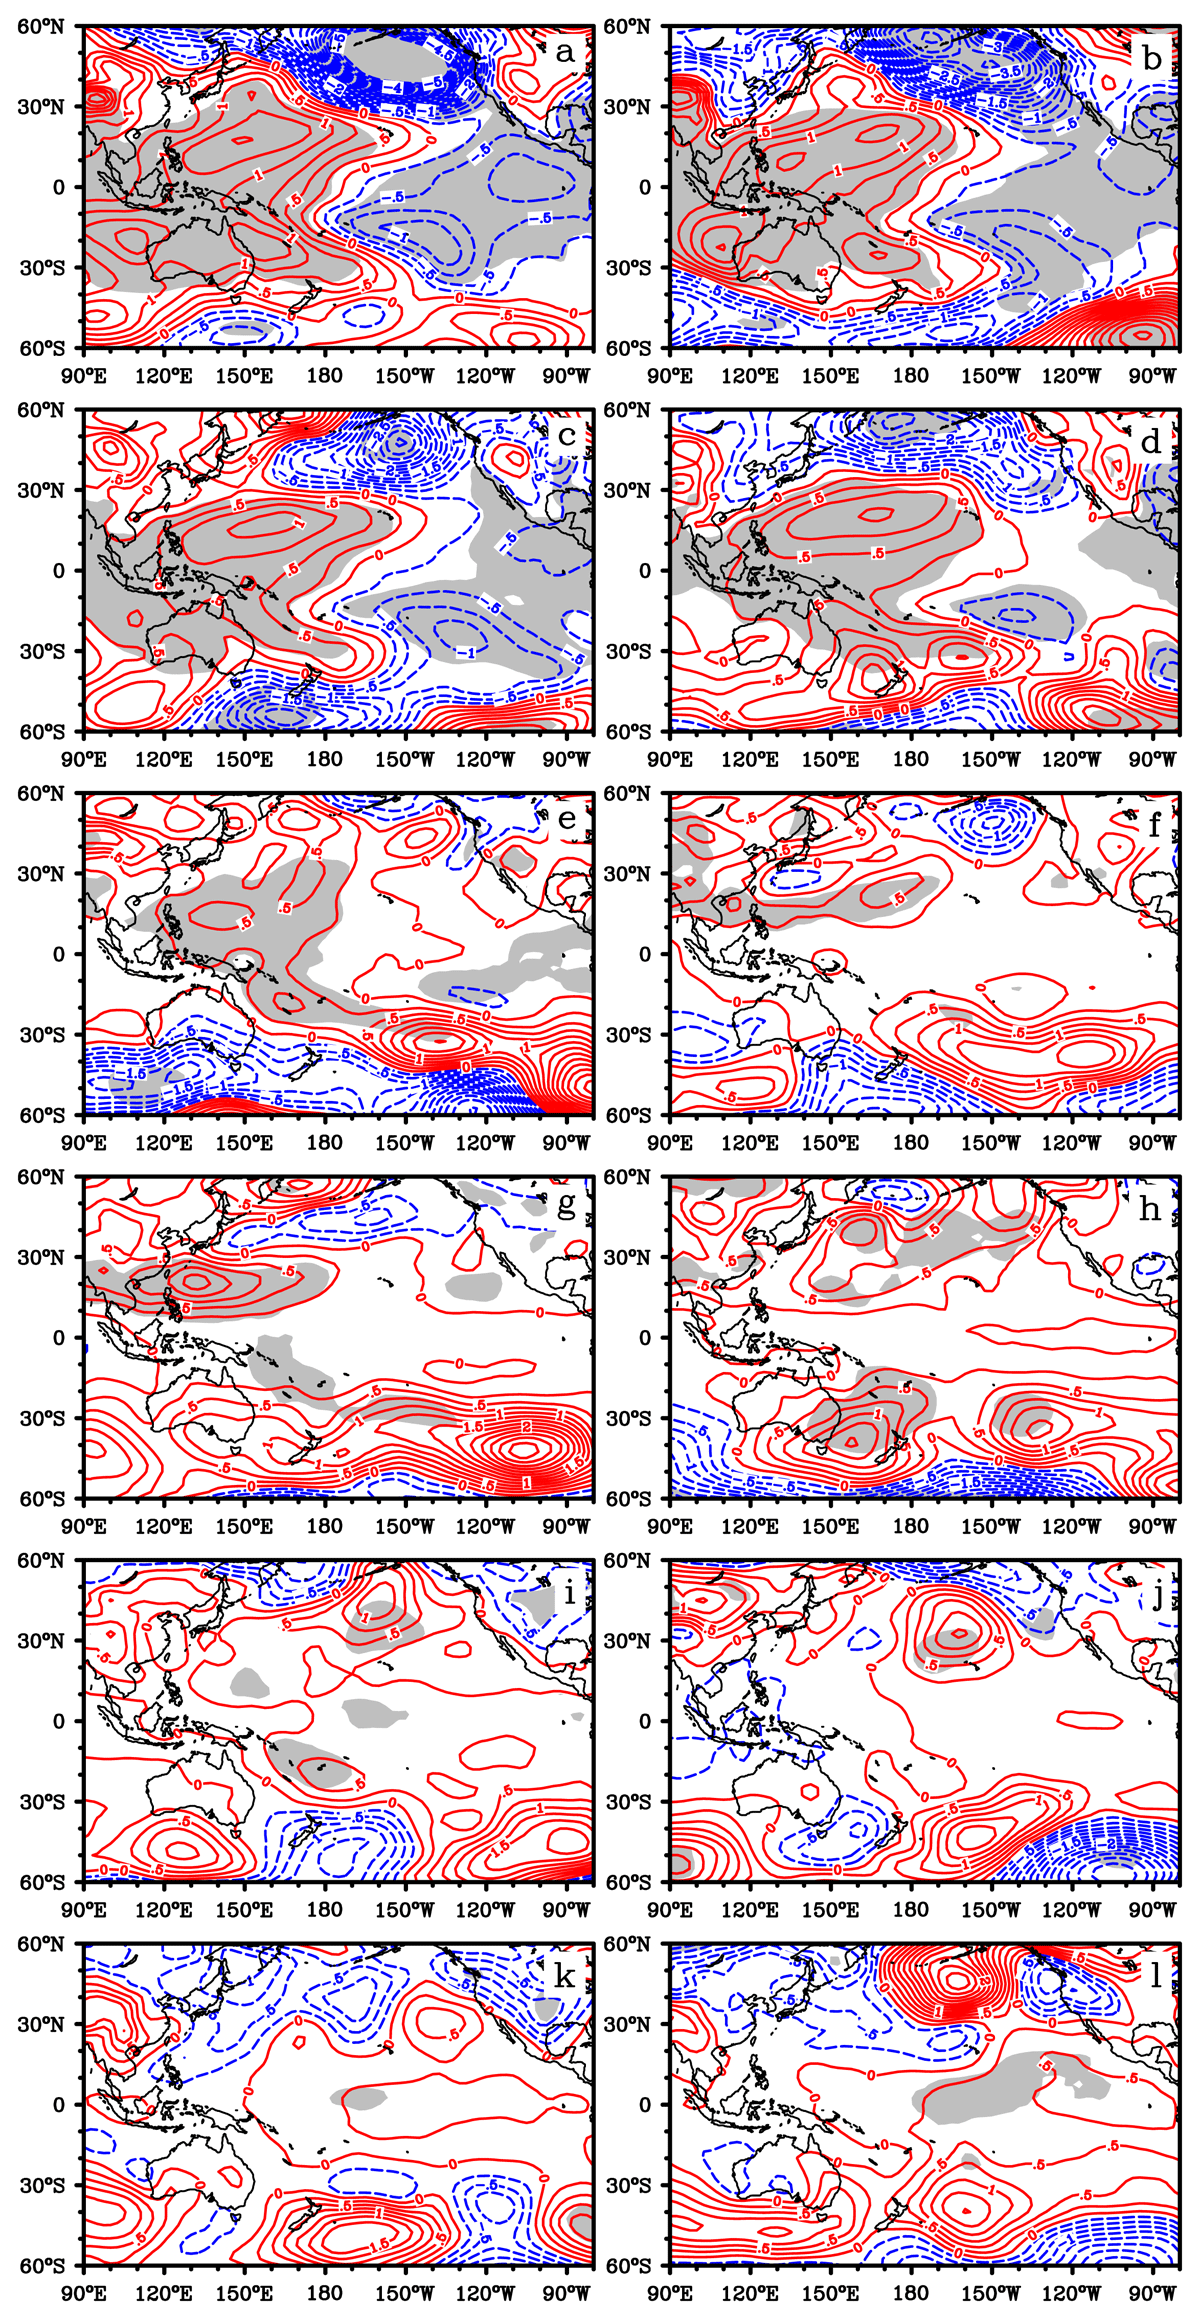
Figure 3
SLPa distribution for El Niño composite from January (+1) to December (+1). Shaded areas were at 95% significance. The contour interval is 0.25 hPa, and dashed contour lines indicate the negative values.
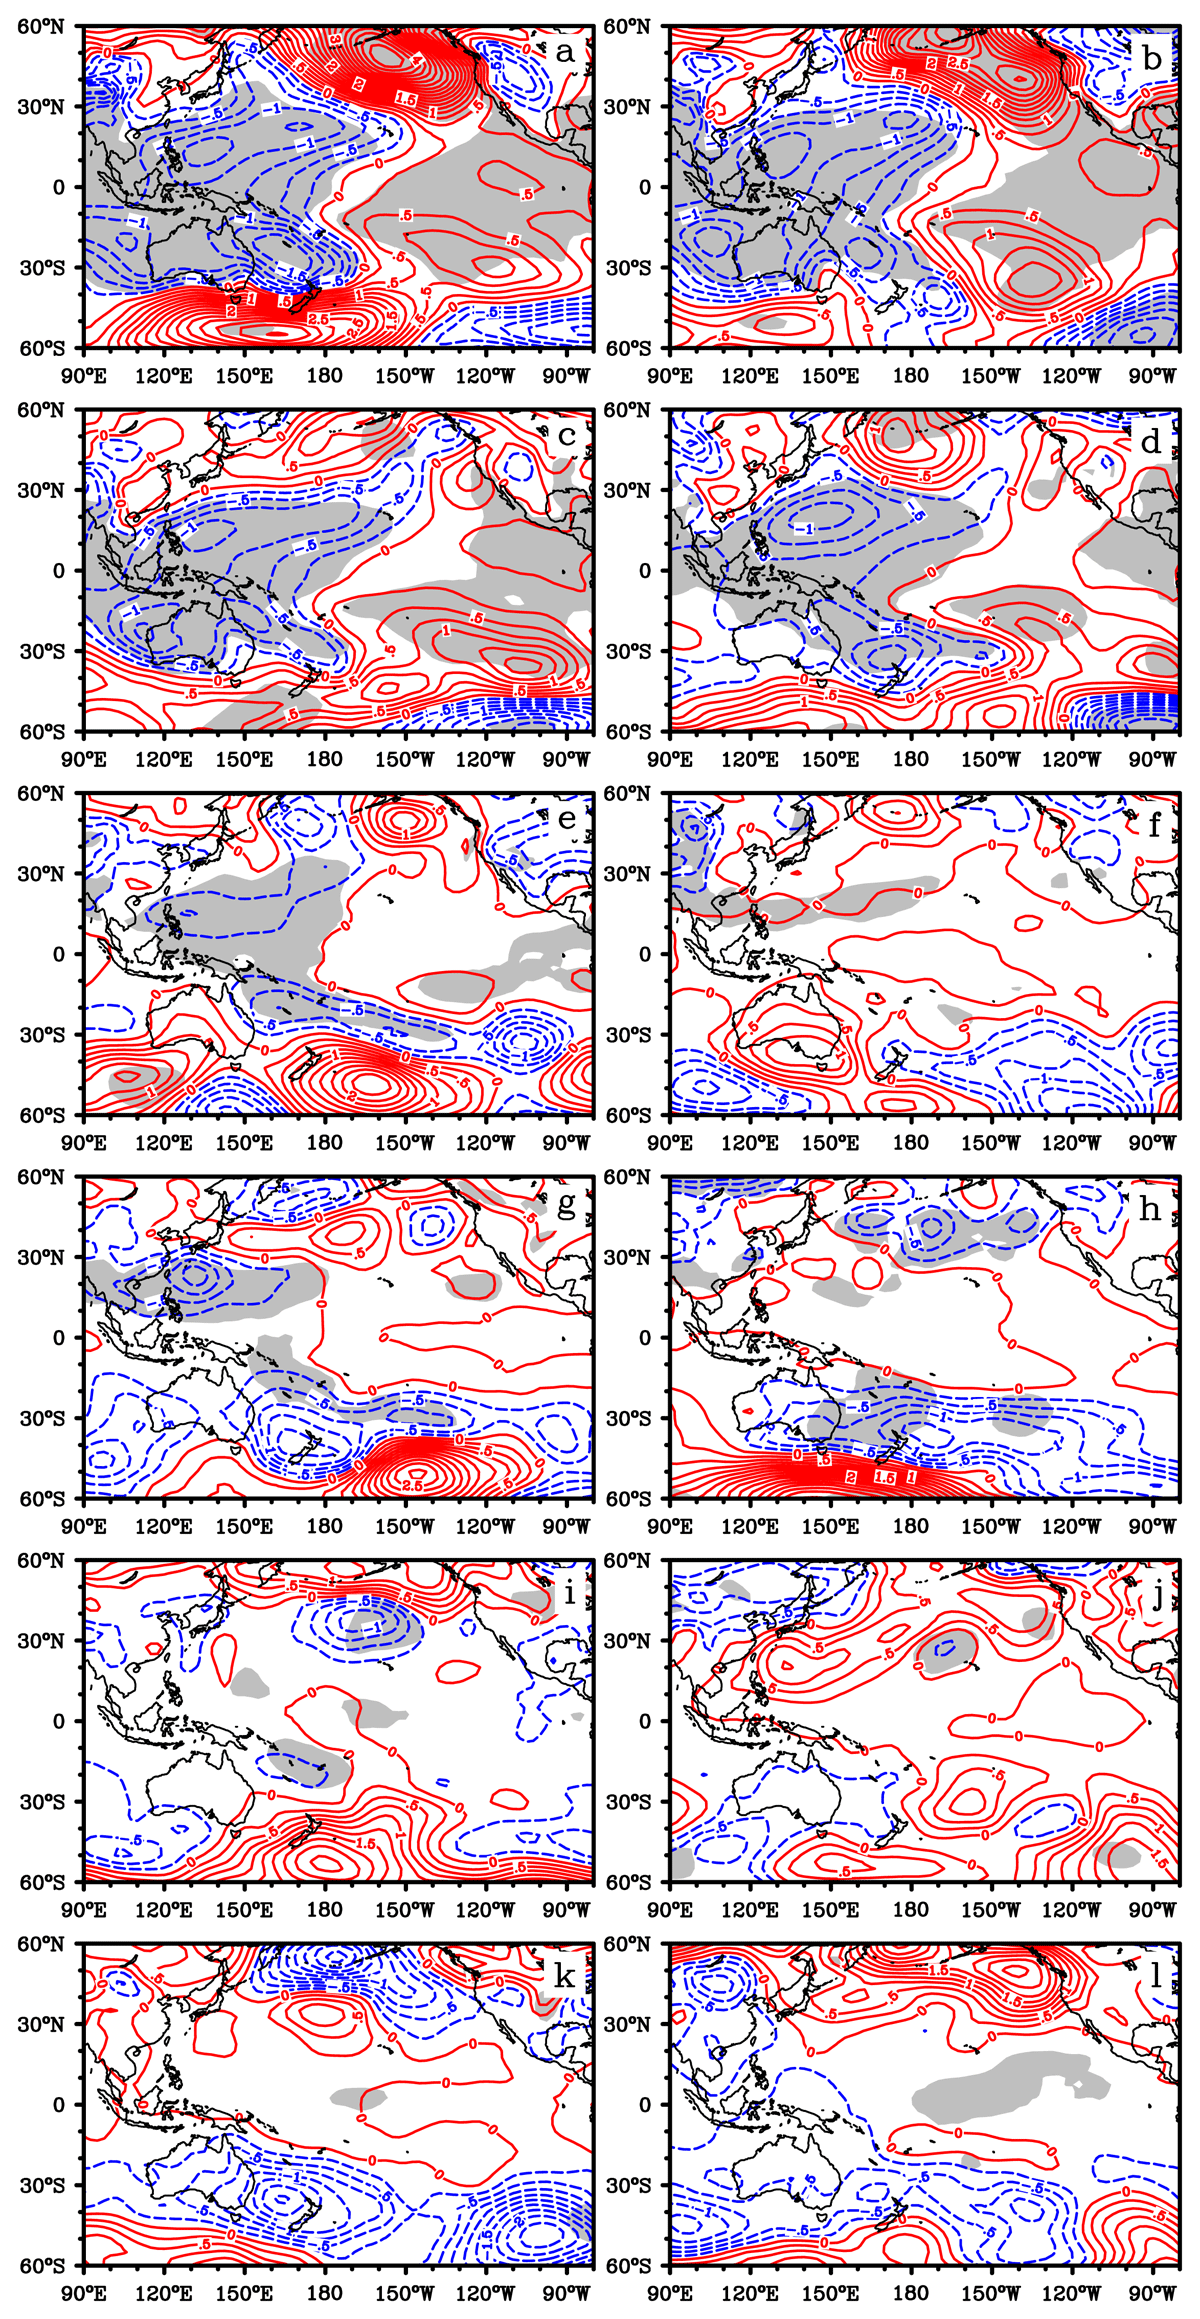
Figure 4
Same as Figure 3 except for the La Niña composite.
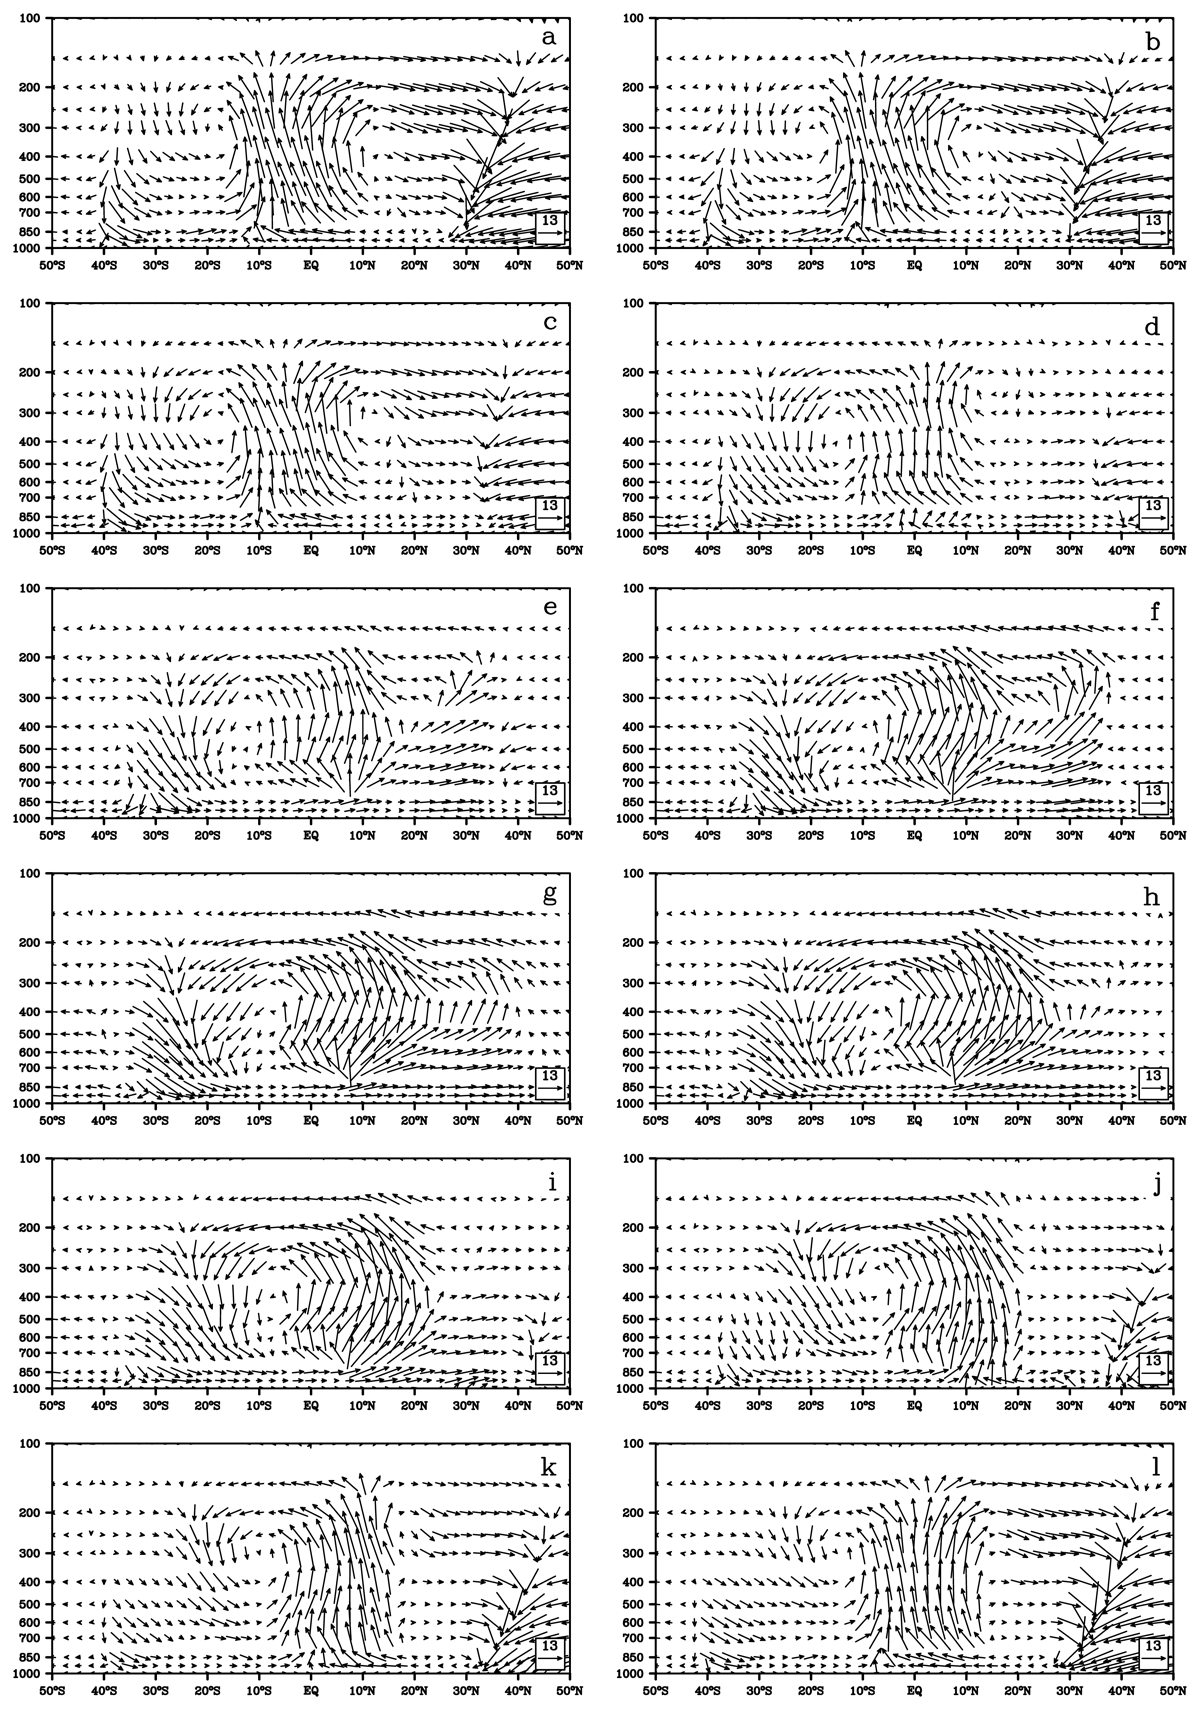
Figure 5
The height-latitude section maps of the climatology of meridional wind (unit: ms-1)/vertical p-velocity (unit: upward positive, ×500–2 hPa s–1) vectors zonally averaged from 100–160°E from January to December.
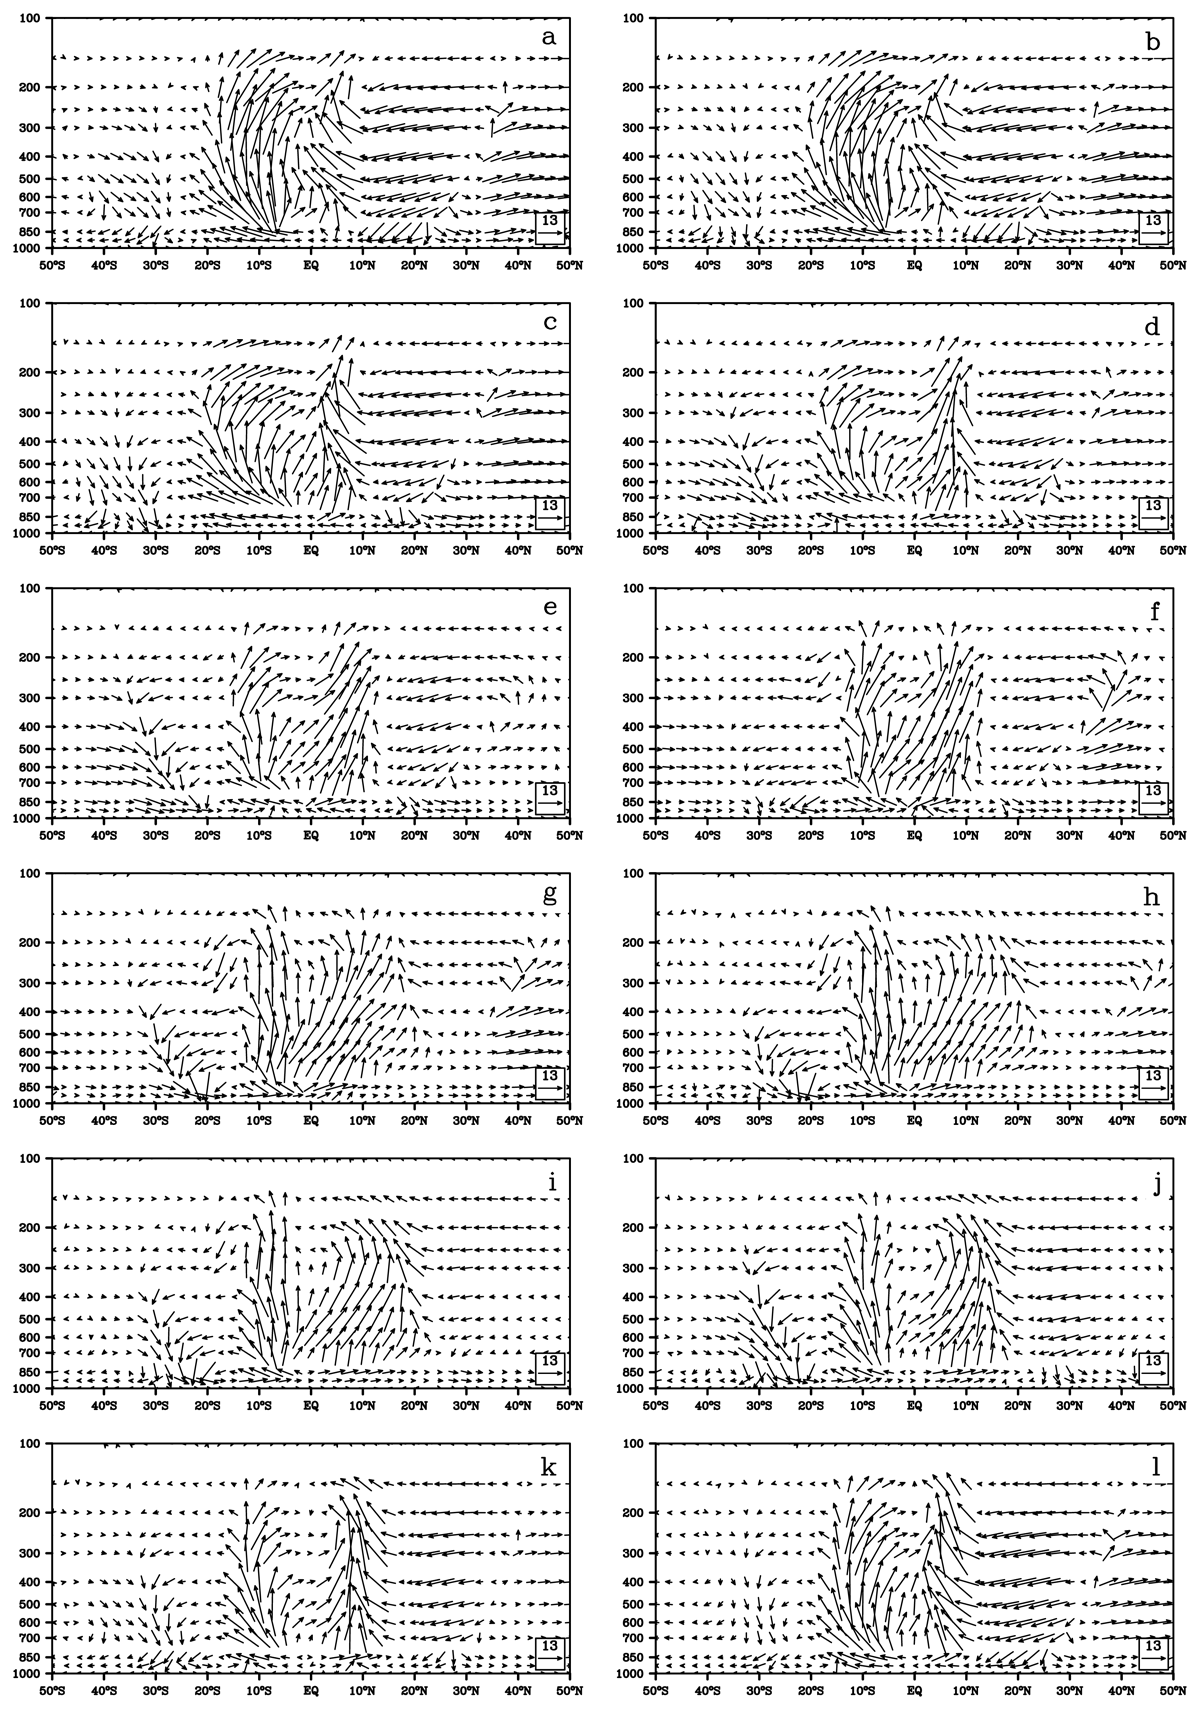
Figure 6
Same as Figure 5, except for 160°E–170°W.
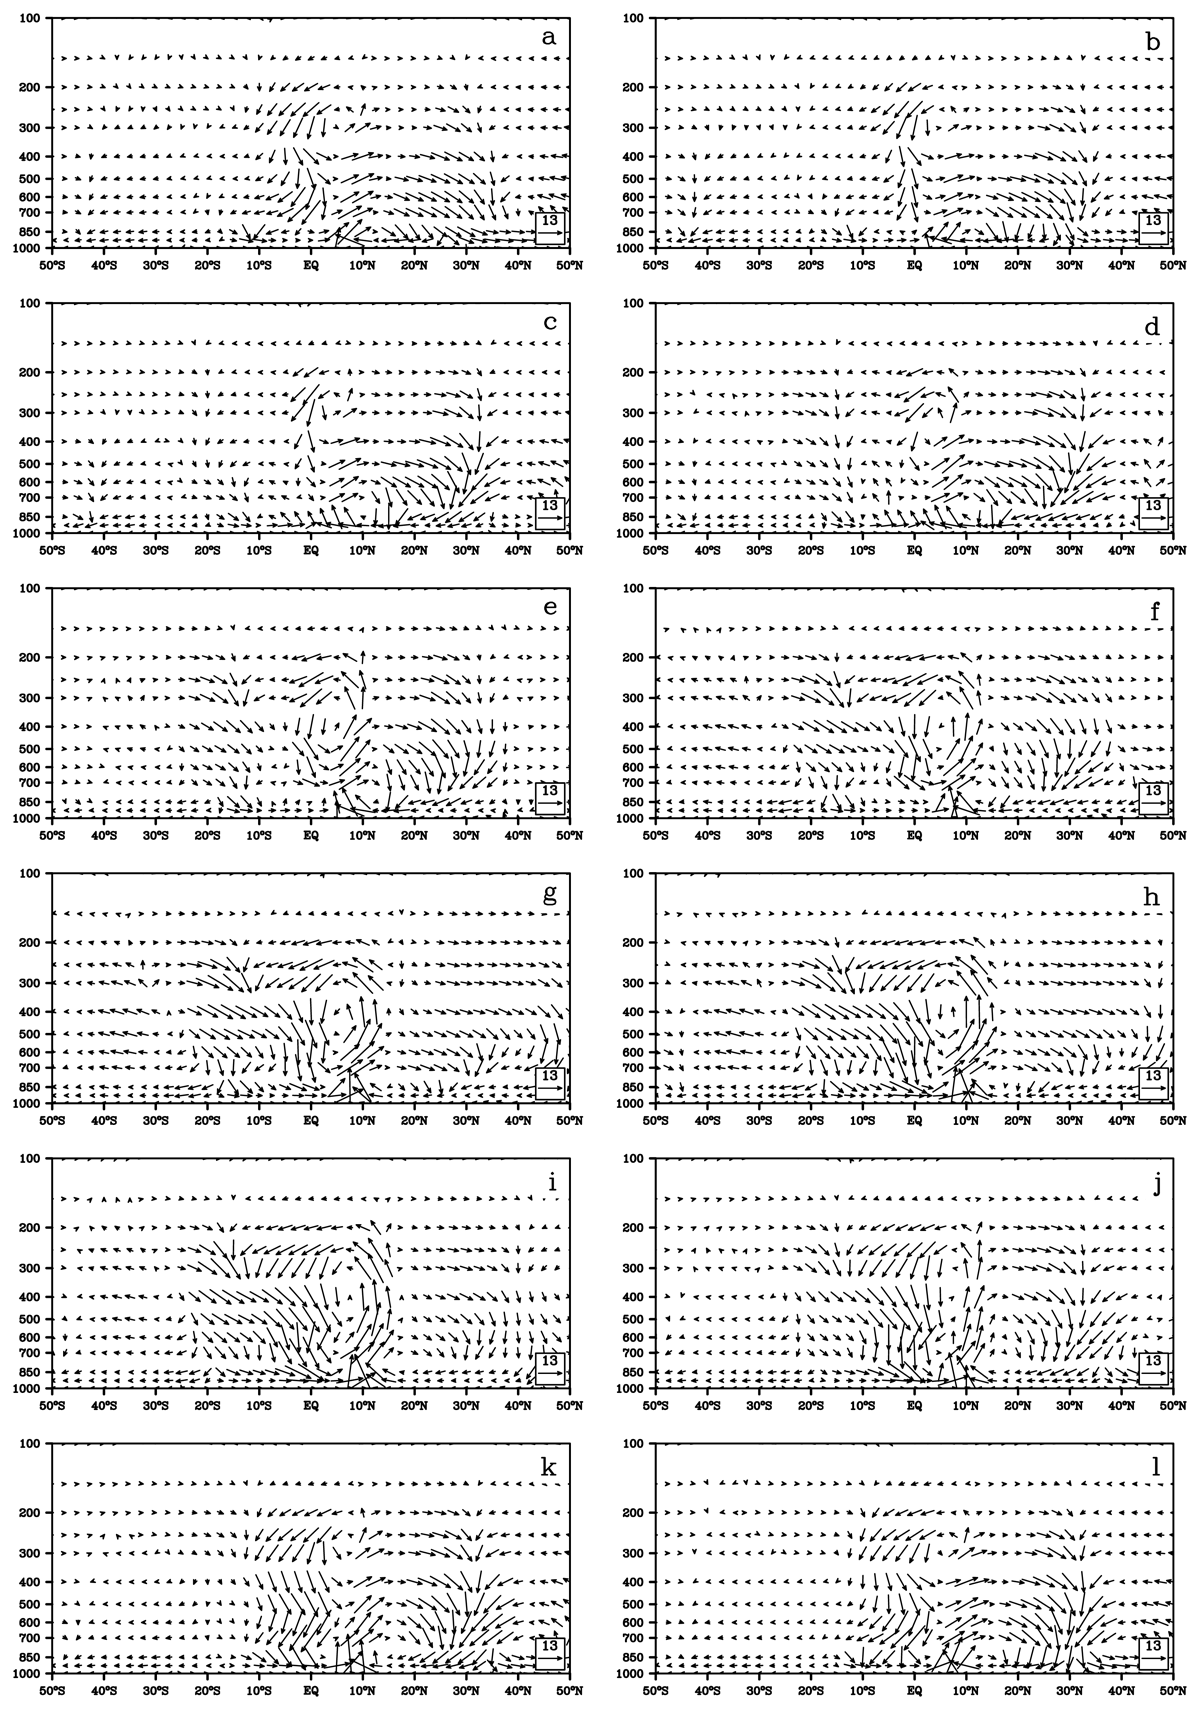
Figure 7
Same as Figure 5 except for 150–90°W.
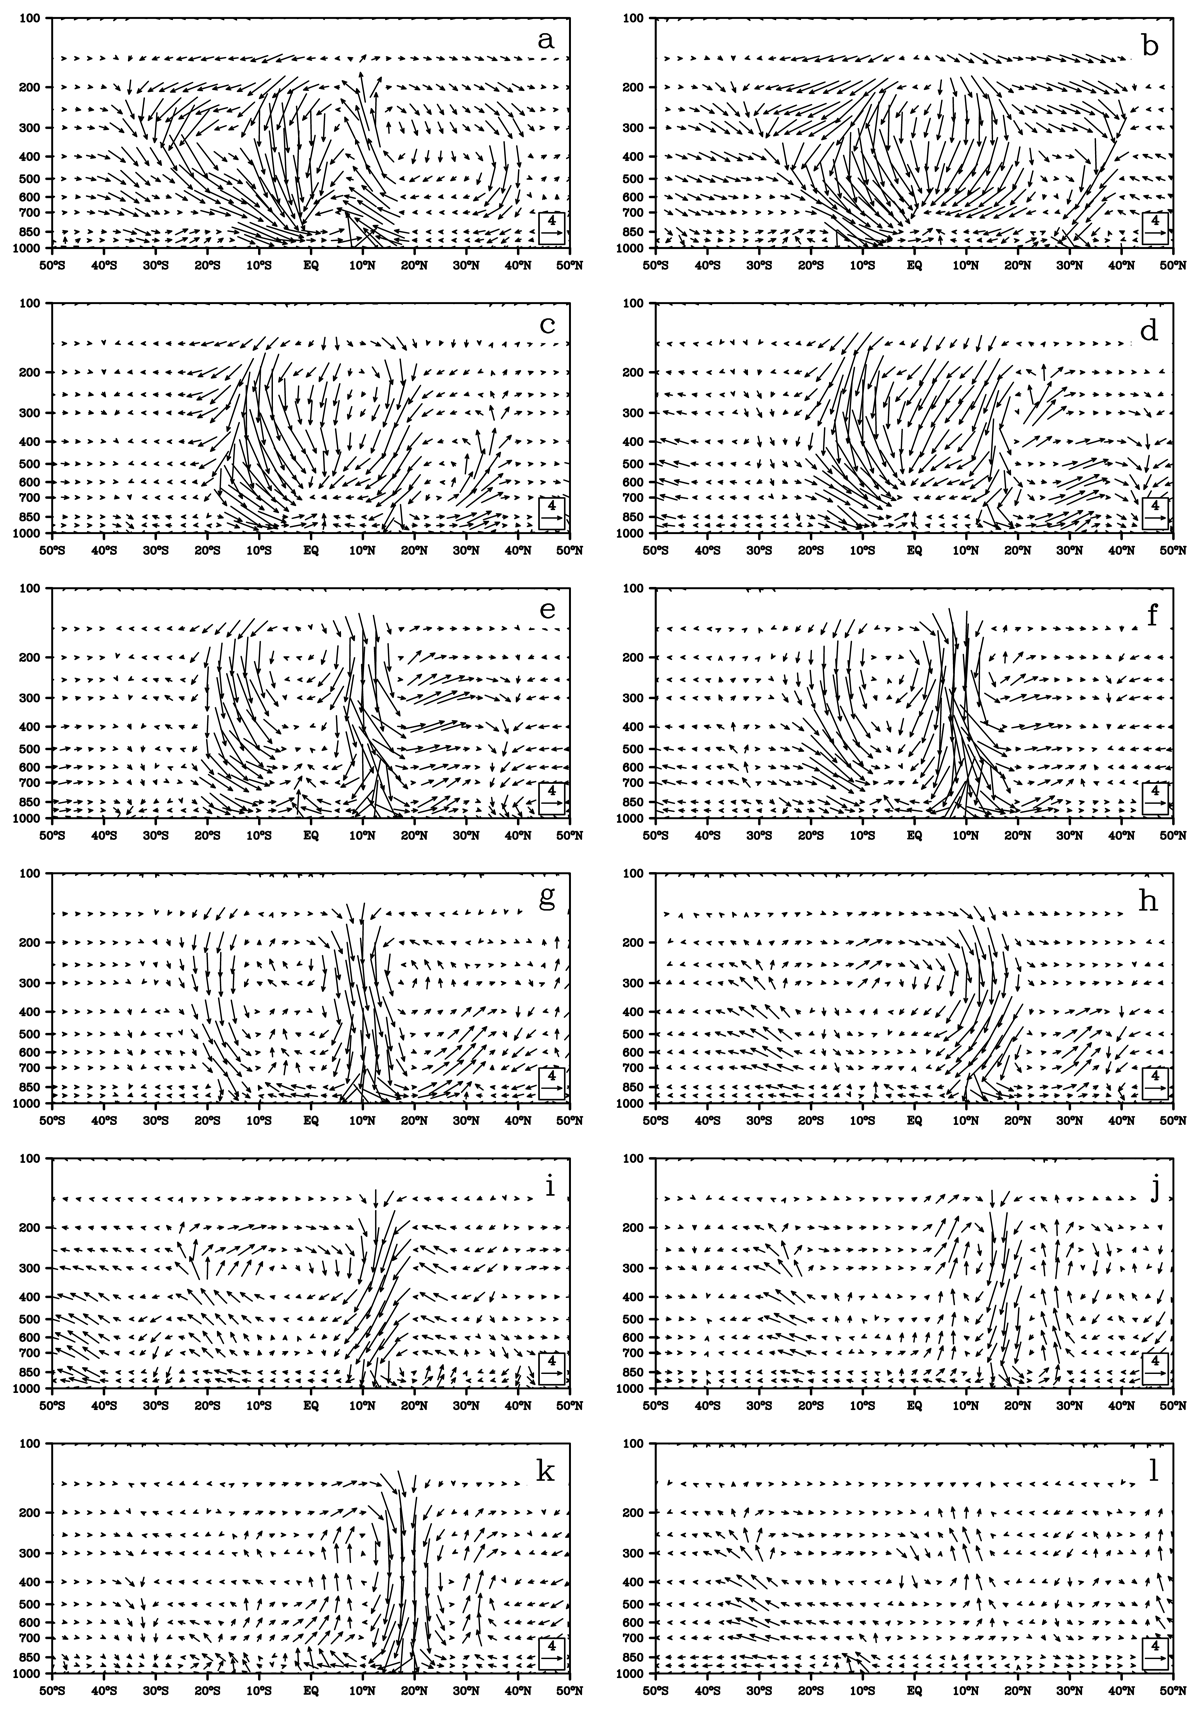
Figure 8
Same as Figure 5 except for the anomalies for the El Niño composite from September (0) to August (+1).
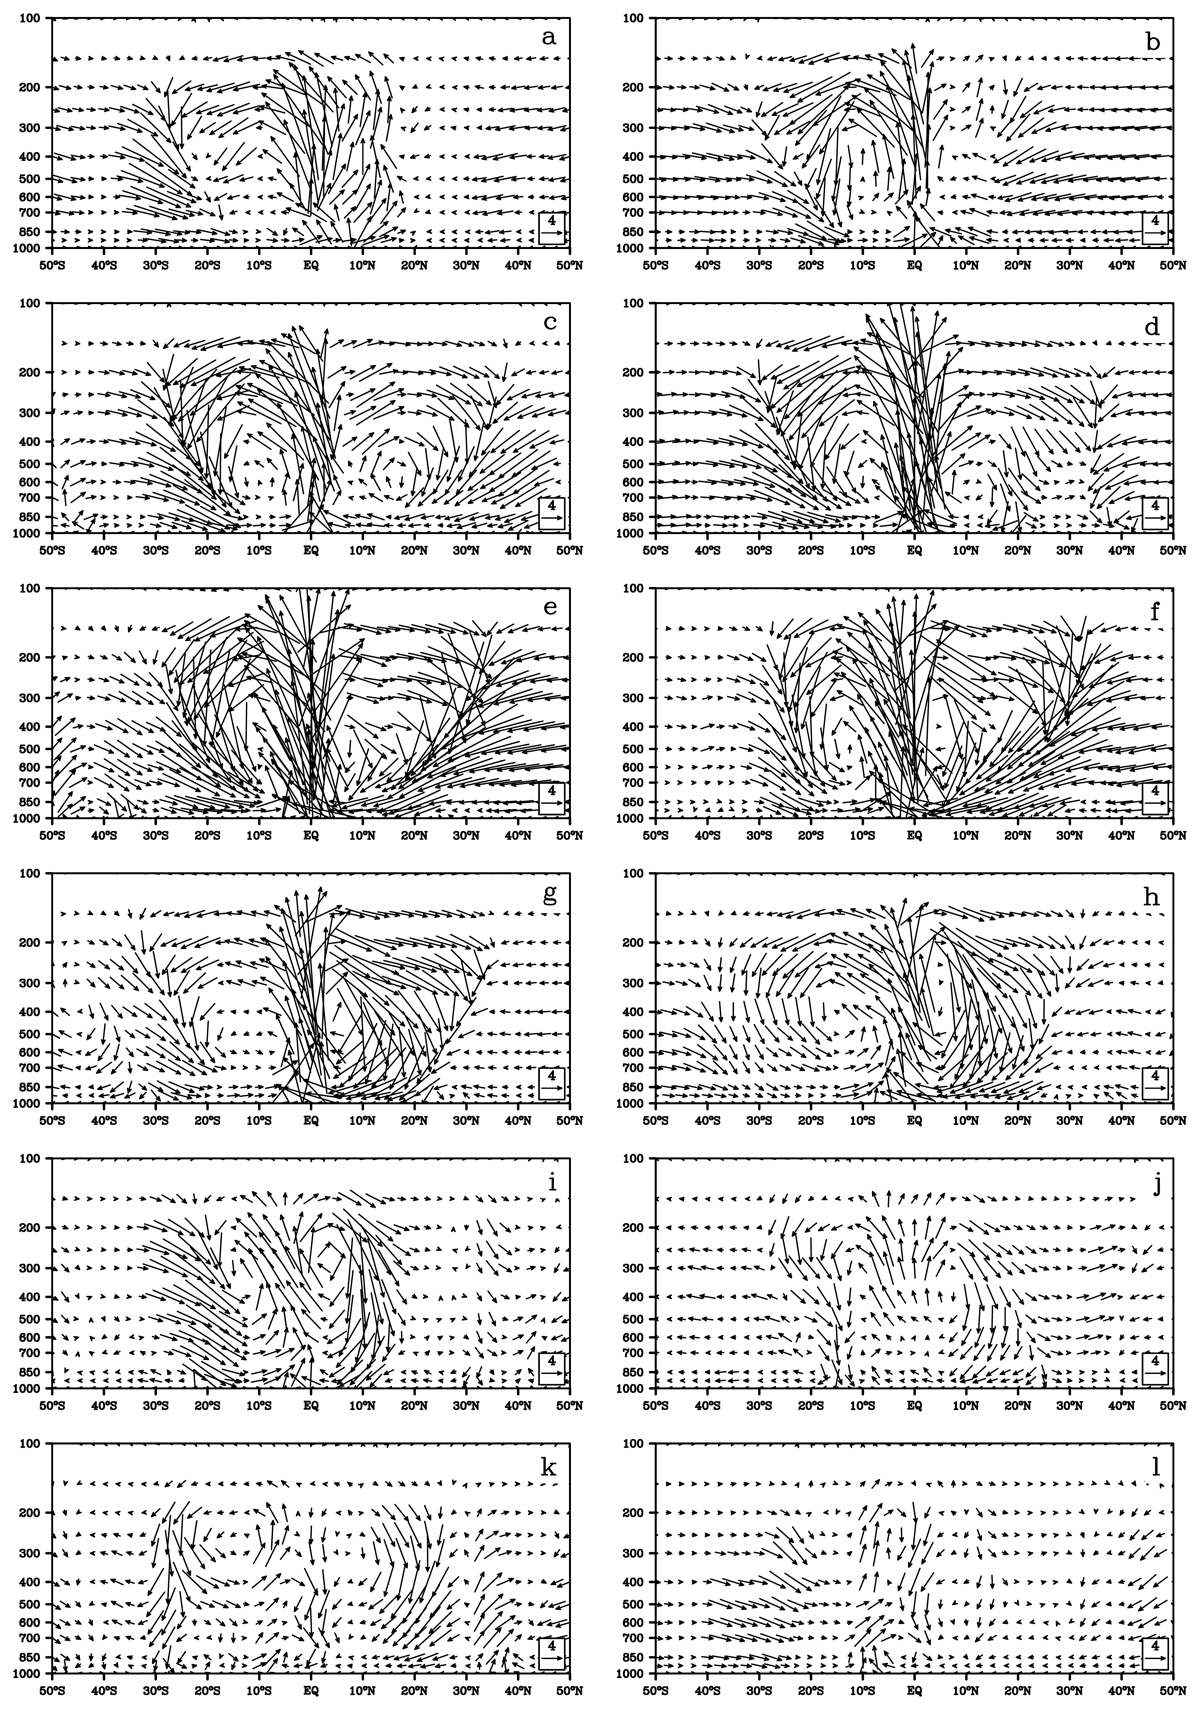
Figure 9
Same as Figure 6 except for the anomalies for the El Niño composite from September (0) to August (+1).
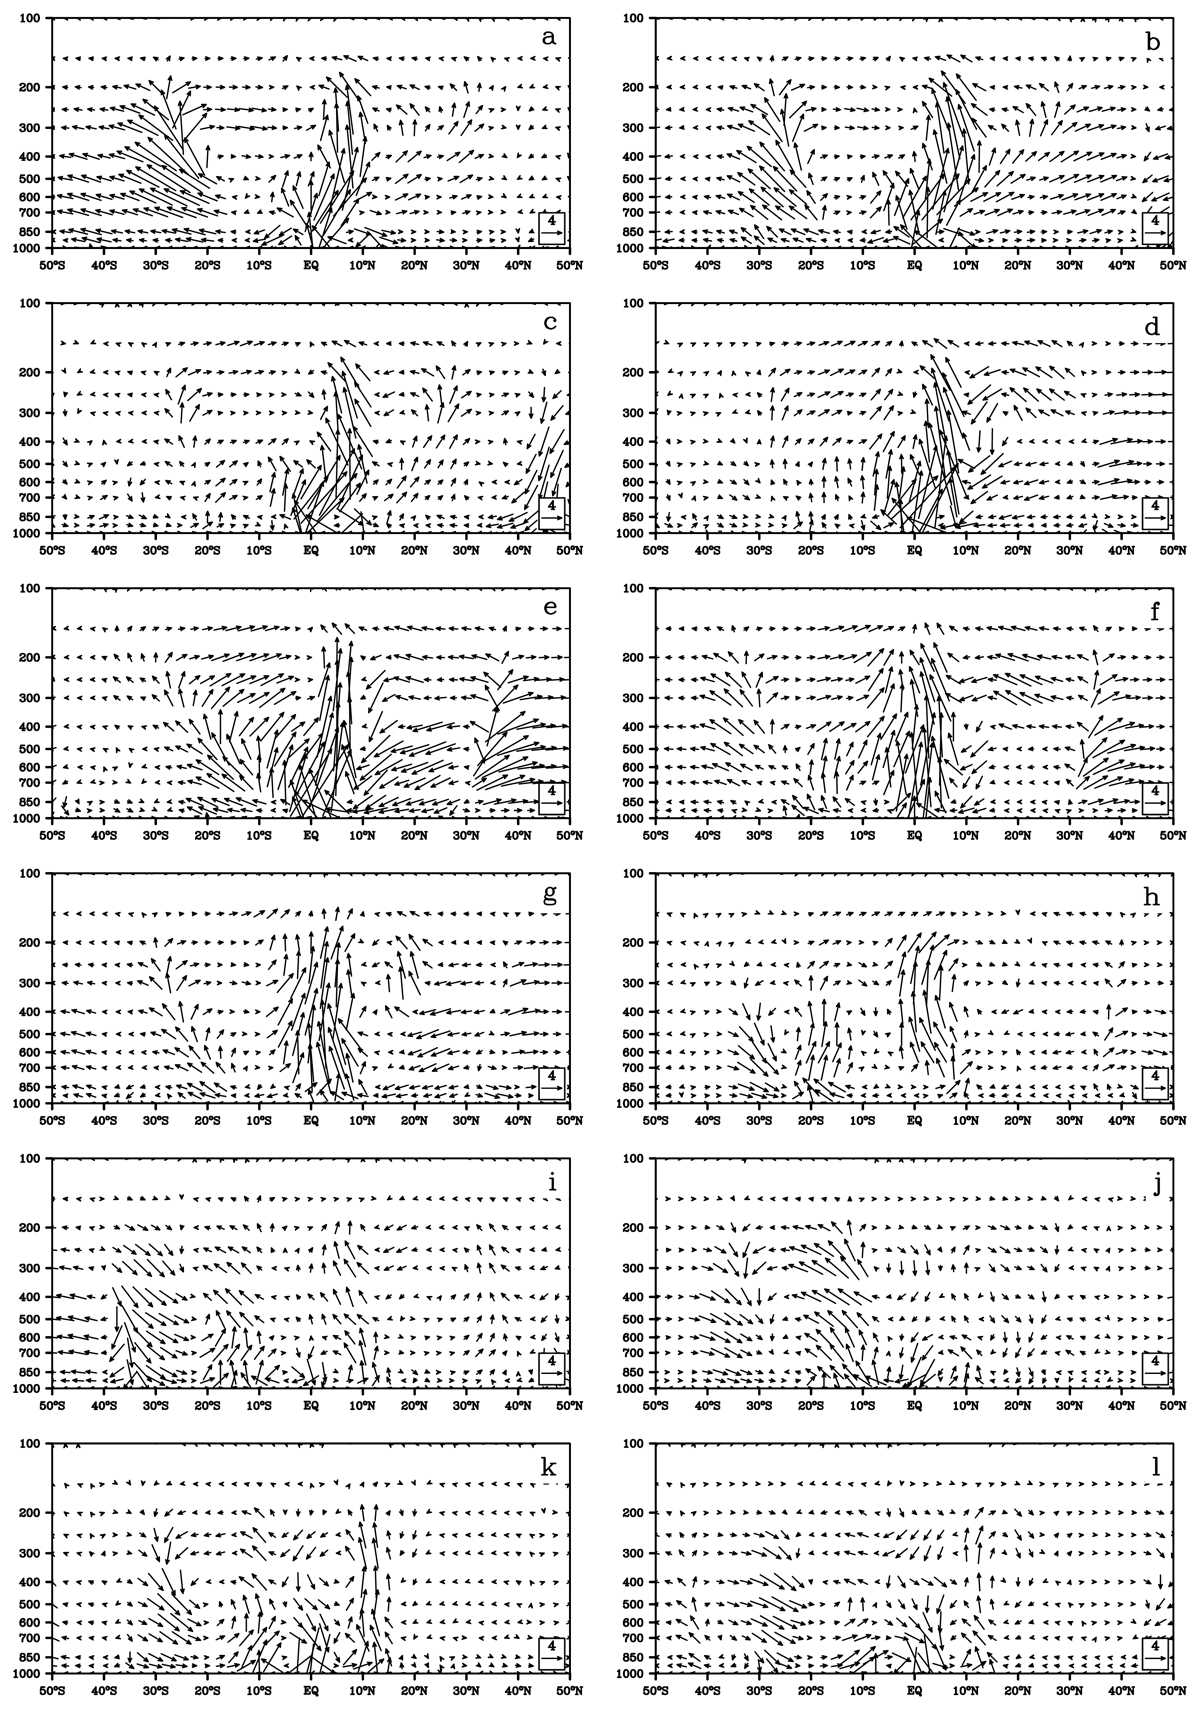
Figure 10
Same as Figure 7 except for the anomalies for the El Niño composite from September (0) to August (+1).
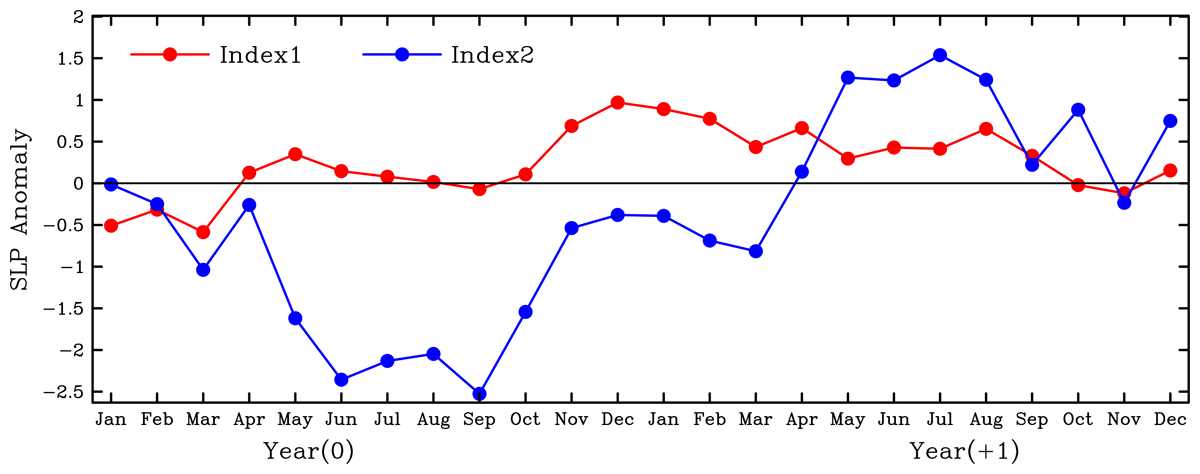
Figure 11
Evolution of the SLPa averaged in 20–30°S, 160°E-170°W (Index 1, red line), and SLPa averaged in 30–40°S, 150–120°W (Index 2, blue line) for El Niño composite from January (0) to December (+1). Unit: hPa.
Table 1
The correlation coefficients between Index 1 and Index 2. Index 2 lags Index 1 from one month to nine months. Bold or Italic Bold values signify significance above 95% or 99.99% confidence level. The NDF means the number of degrees of freedom.
| Lag months | 1 | 2 | 3 | 4 | 5 | 6 | 7 | 8 | 9 |
| Correlation | 0.21 | 0.346 | 0.472 | 0.693 | 0.812 | 0.947 | 0.795 | 0.654 | 0.371 |
| NDF | 21 | 20 | 19 | 18 | 17 | 16 | 15 | 14 | 13 |
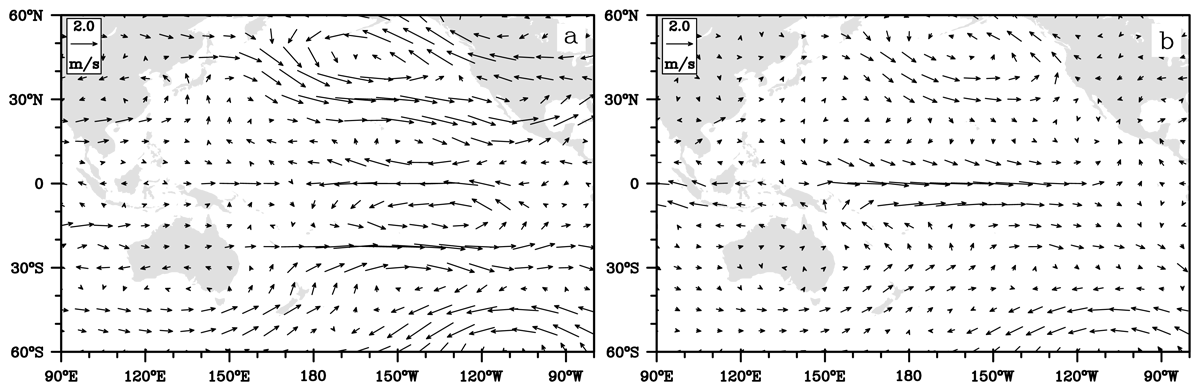
Figure 12
Horizontal wind vector anomalies for El Niño composite at 300 hPa (a) and 850 hPa (b) from September (0) to February (+1). Unit: ms–1.