
1. Introduction
The El Niño-Southern Oscillation (ENSO) always arouses public attention because of the events accompanied by worldwide natural disasters that profoundly impact human life (Philander 1990). In addition, the ENSO is also one of the most valuable signals in global climate prediction since the appearance of the ENSO would most likely indicate the arrival of catastrophic weather someplace a few months later (e. g., Wang et al. 2001).
Although scientists in the 19th century noticed the ENSO phenomenon (see the description of Nicholls 1992), the real breakthrough in research was more than half a century later. In his two highly influential articles, Bjerknes (1966, 1969) pointed out that the central part of the Walker circulation mechanism should be associated with the SO and, for the first time, made a strong connection between EN and SO. He also pointed out that the cause of El Niño is the Western Pacific’s excessively accumulated heat released to the east when the trade winds become weak. However, his theory could not explain the transition between El Niño and La Niña, about which Wytrki (1975) found a solution by introducing the Kelvin wave’s reflection. Philander et al. (1984); Gill (1985); Wright et al. (1988) also made similar contributions to the formation mechanism of ENSO.
On the other hand, Rasmusson and Carpenter (1982) used statistical analysis to find that the ENSO mature phase generally occurred by the end or the beginning of a calendar year without a physical mechanism explanation. Based on those theories, various conceptual models were developed (Zebiak and Cane 1987; Battisti 1988; Schopf and Suarez 1988; Battisti and Hirst 1989; Tziperman et al. 1994; Wang 2000). These studies have extensively promoted the research progress of the ENSO theory. However, the conceptual models have apparent shortcomings, especially ignoring a vital impact on ENSO over extratropical regions (White et al. 2002; Vimont et al. 2003; Anderson 2004; Wang et al. 2013; Ludescher et al. 2013; Tasambay-Salazar et al. 2015).
Wang (2019) established a relatively complete ENSO theory based on analyzing and calculating many observational data to avoid these problems. The new theory pointed out that the force that drives the ENSO cycle is not confined to the tropical region as previously thought but more primitively in the far away atmospheric circulation system, i.e., the eastern Pacific Subtropical High (PSH) Belts. The theory can reasonably explain the phase-lock phenomenon of the ENSO event as well. The author successfully made a validation forecast for the previous ENSO events with a simple method derived from the new theory.
However, this ENSO theory should be reconfirmed and further improved just as with other new theories. Primarily, this ENSO theory raises a new question: can ENSO drive its cycle by affecting the PSH that is a significant driving force in the formation of ENSO events? People would have known that the PSH belts are part of the global subtropical high belts formed by air masses descending from the Hadley circulation. Moreover, the ascending branch of the Hadley cell is around the equator, especially over the Pacific, where ENSO events occur frequently. In addition, Bjerknes (1966, 1969) has pointed out that El Niño might play an essential role in enhancing the Hadley circulation. Oort and Yienger (1996) also verified that five warm/cold events tended to be associated with strong/weak global Hadley circulation. Following this logic, we can easily deduce that the El Niño (La Niña) phenomenon may promote (block) the Hadley circulation to strengthen (weaken) the PSH until it decays or a new La Niña (El Niño) event occurs. Thus, this study will explore how the ENSO through the Hadley cell can affect the PSH, causing an inverse response to reduce previously equatorial thermal intensity. Undoubtedly, understanding this mechanism is greatly helpful to the improvement of the new ENSO theory proposed by Wang (2019).
2. Data
The National Centers for Environmental Prediction (NCEP)/National Center for Atmospheric Research global atmospheric reanalysis dataset is the primary dataset used in this study (Kalnay et al. 1996). Specifically, the monthly (1963–2020) Sea Level Pressure (SLP), horizontal wind, and vertical p-velocity from 1000 to 100 hPa on a 2.5° latitude/longitude grid were used. In addition, we chose the National Oceanic and Atmospheric Administration Extended Reconstructed monthly sea surface temperature (SST) Version 5 on a 2° latitude/longitude grid from 1963 to 2020. Here the suffix “a” is used to express anomaly or anomalies of an acronym of an element, e.g., SST anomaly to SSTa. The ENSO mature period was defined from September to the next February, which coincides with the evolution of the ENSO composite time series as shown in Figure 1.
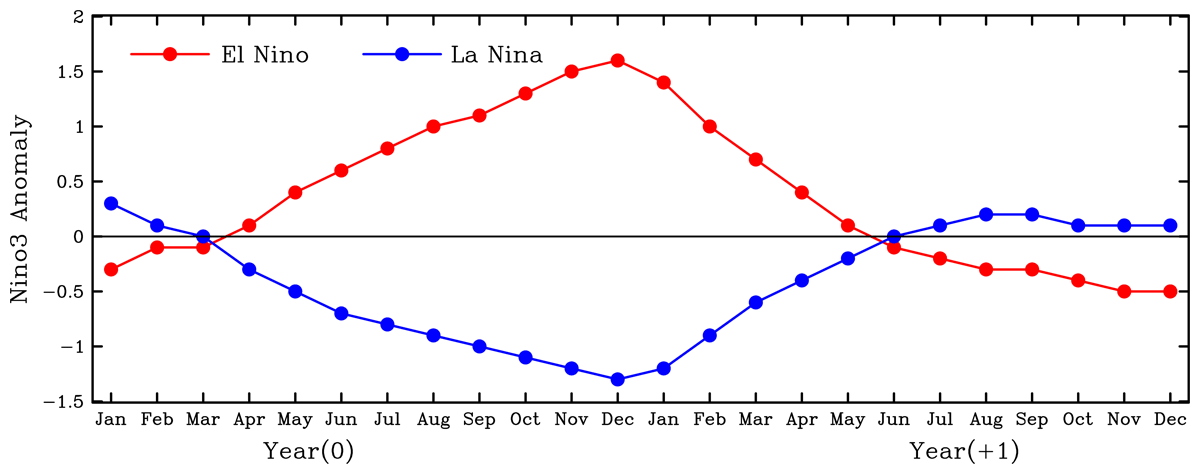
Figure 1
Evolutions of SST3a (unit: K) for El Niño and La Niña composites from January (0) to December (+1). The years for El Niño were 2003, 1987, 1994, 1976, 2006, 2018, 2002, 1965, 1986, 2009, 1991, 1972, 2015, 1982, 1997, and the years for La Niña were 1973 1975 1970 2007 1999 1967 1988 2010 1984 2017 1998 1964 1971 1996, 1995, and the year order was based on higher and lower values of SST3DJF respectively. For example, the SST3DJF of the 0 year of 2003 means SST3 averaged from December 2003 to February 2004, and so on.
3. Equatorial thermal condition conducive to Pacific Hadley circulation
Although a reasonable logic in section 1 suggests a possible ENSO self-driving cycle mode, the situation is not simple. The problem is that meteorologists divided the Hadley circulation into the global Hadley circulation and the regional Hadley Circulation. What Bjerknes (1969) mentioned about the El Niño-enhanced Hadley circulation could involve either the former or the latter. However, the former does not guarantee to make a significant change in the strength of eastern PSH that is crucial to affect SST in the Eastern equatorial Pacific (EEP) as a necessary condition for the formation of ENSO conversion (Wang 2019). Note that the PSH strength we mentioned here only means the one reflected on the SLP with a regional variation. Thus, only when confirming that ENSO can lead to an abnormal PSH caused by the Pacific Hadley circulation anomalies to reduce or reverse previous SSTa in EEP significantly, would we consider ENSO to play a key role in driving its cycle.
First, we have to estimate if ENSO can generate enough powerful heating or cooling effect on the air over the tropics, which is an essential factor in measuring the strength of the vertical air movement in the ascending branch of the regional Hadley cell. We have known a big difference in SST between EEP and Western Equatorial Pacific (WEP) (e.g., Bjerknes 1966). Usually, SST off South America’s west coast range from the 16°C to 21°C, while they exceed 27°C in the “warm pool” located in the central and western Pacific.1 In addition, the SST in WEP has smaller interannual SSTa than that in EEP. The intraseasonal change of the SSTa in WEP is less too. On the other hand, the amplitude of the increasing trend of SST was reduced along the Pacific equator from west to east substantially due to global warming (Wang and Xu 2018). Therefore, SST in EEP in the ENSO stage, lacking the global warming influence, might impact more on the overhead air of the ascending branch of the regional Hadley circulation than that over WEP. The SST would become a substantial potential power to force the response of the PSH located at the descending branch of the regional Hadley cell.
The warm/cold events with large variability of the tropical SST tend to be most mature from December to February (DJF) (Wang 2019). Therefore, the SSTa in Nino 3 region in DJF (SST3DJFa) would be most qualified to test if the equatorial Pacific SST in the ENSO stage can efficiently affect the regional Hadley circulation through heating and cooling overhead air. As shown in Figure 1a (El Niño year) and Figure 2a (La Niña year) of Wang (2019), areas above 0.5 K and below –0.5 K broadly covered the area east of 170°E from May to next April. This phenomenon suggests that the intense equatorial heating or cooling from the dateline to the East Pacific coast may persist for about one year with the ENSO events. Thus, ENSO events might affect the regional Hadley circulation significantly, at least in its ascending branch and the selection of the SST3DJF or its anomaly as the test of the Hadley circulation was reasonable.
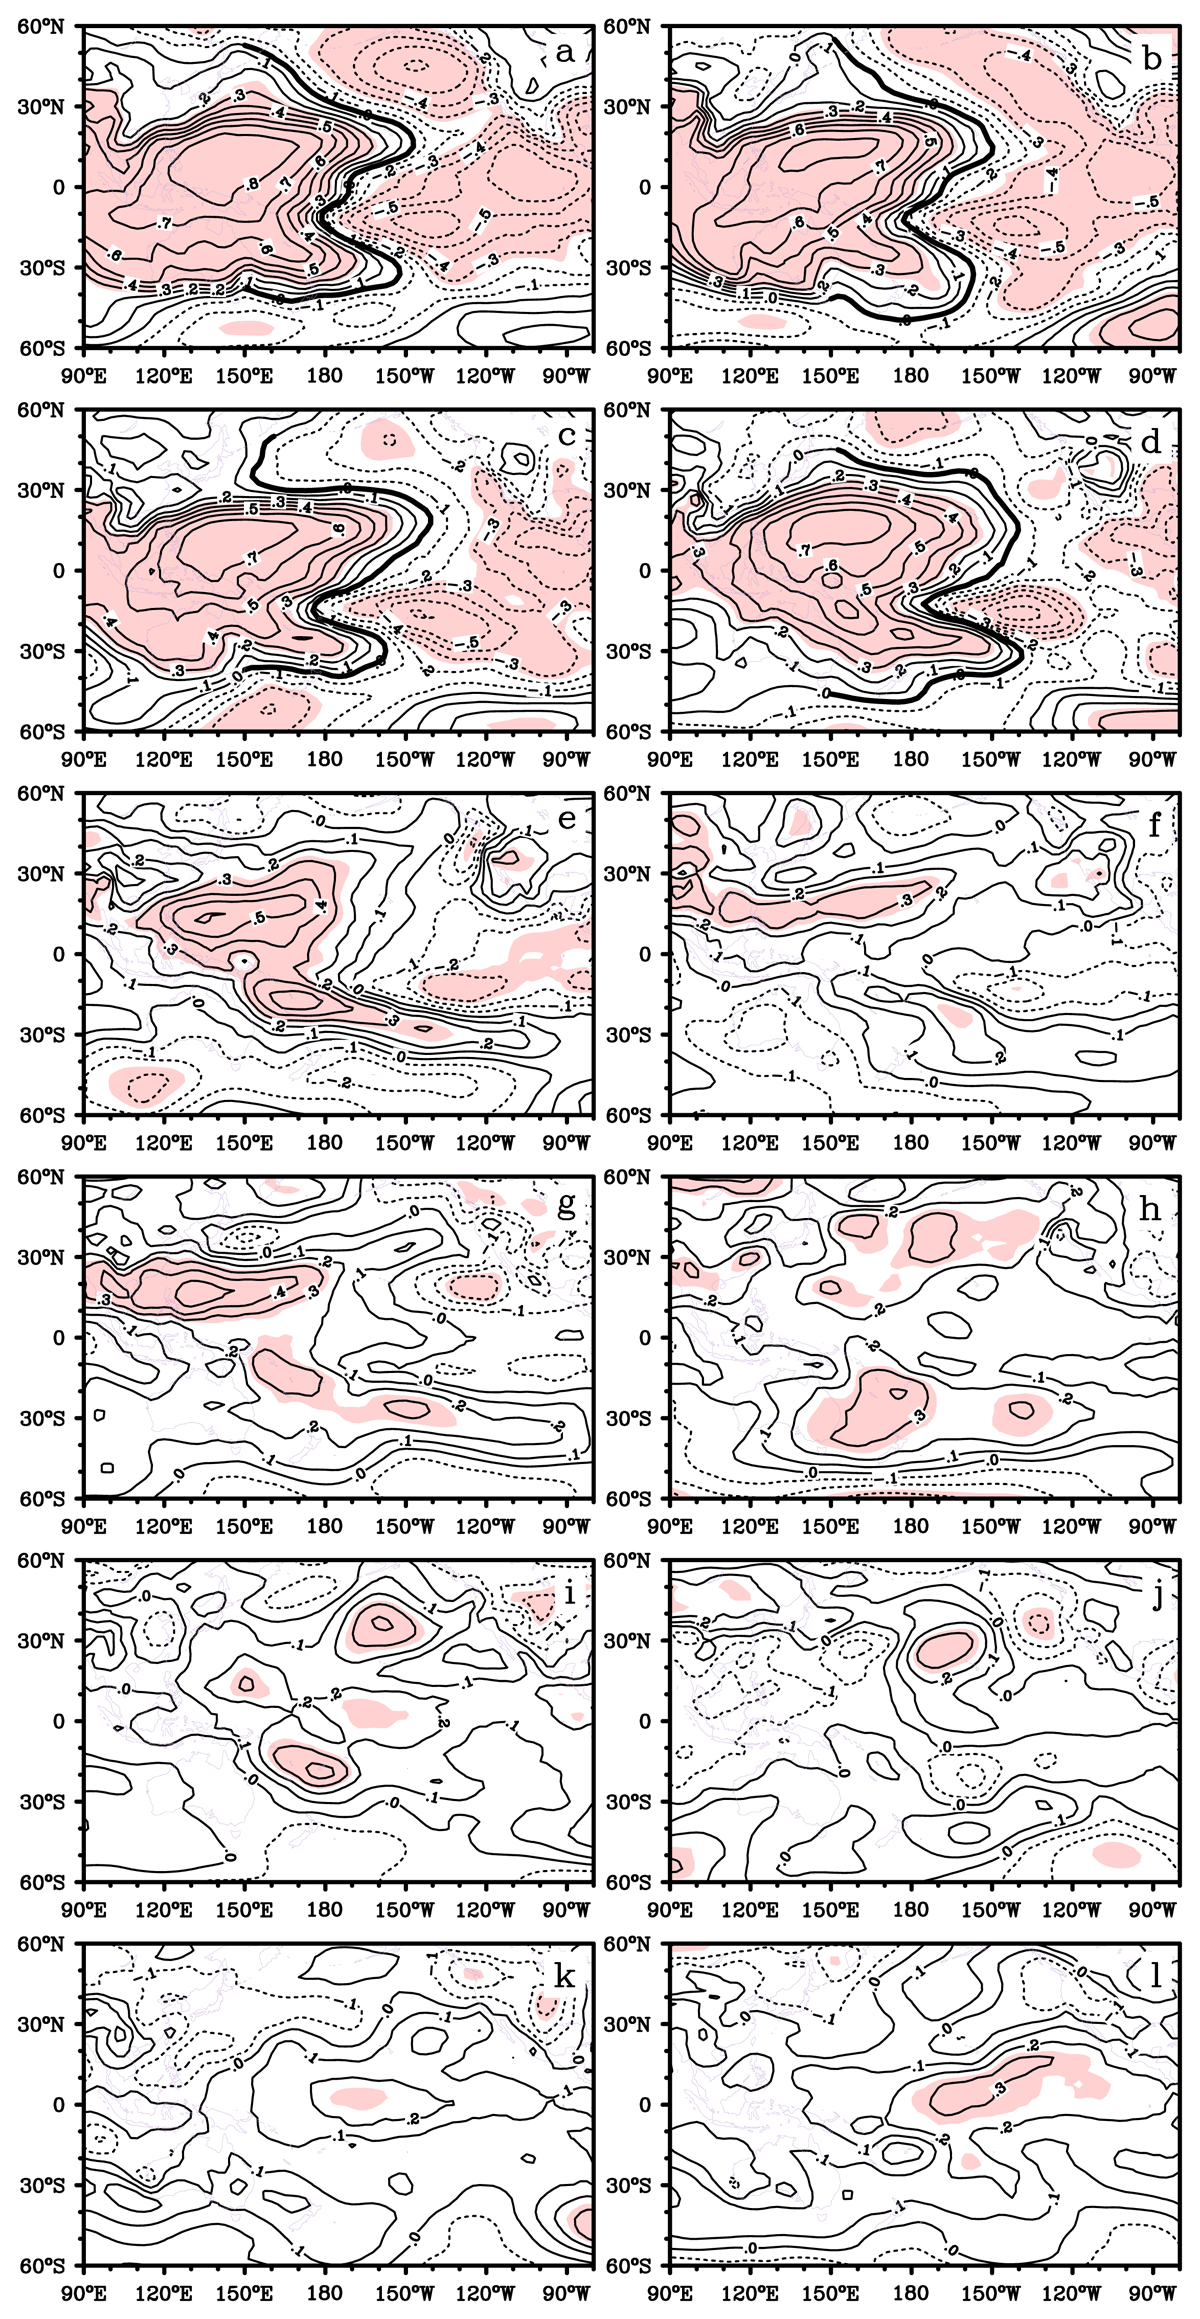
Figure 2
Correlation between the SST3DJF and SLP from January (+1) to December (+1). Shaded areas were at 95% significance. The contour interval was 0.1, and dashed contour lines indicated the negative values. The bold lines that are roughly along the zero contour lines east of 150°E in Fig. 2a-d illustrate the pattern of the mirror sigma.
On the other hand, the SST3a only reached about –0.5 K and 0.2 K, respectively, at the end of the second year (+1) after a strong El Niño year (0) (Max. 1.57 K in December) and a strong La Niña year (0) (Min. –1.35 K in December) as shown in Figure 1. The ability of the ENSO to quickly switch from one type to another is limited. In fact, of the 15 top ENSO events, only 1/3 or 5 could be transformed into the opposite ones in the following year. The next sections will provide additional insight into the above results.
4. A unique correlation/circulation distribution when ENSO deeply matured
ENSO has enough ability to affect the tropical air in the regional Hadley cell ascending branch, as mentioned in section 3. We still need to know if these effects can significantly spread to the subtropical circulation in the descending branch of the regional Hadley cell to generate feedback reducing the previous tropical SSTa. Figure 2 shows the correlation maps between SST3DJF and SLP from January (+1) to December (+1). Note that almost all the calculations were the lag correlations to SST except for those involving January (+1) and February (+1) during the DJF period. The figures focusing on SST3DJF in the analysis here is similar to the approach taken by Wang (2019). The only difference is that we mainly focused on analyzing SLP changes after SST3DJF instead of the changes before SST3DJF. A solid response to tropical heating or cooling to cause the PSH anomalies through the abnormal regional Hadley circulation would negatively impact the Pacific tropical region to reduce the original thermal condition in situ (Wang 2019). Thus, such a significant positive correlation area (SPCA) over Eastern Extratropical Pacific (EEtP) lasting until August or more months might create a possibility of an opposite ENSO event appearing.
On the other hand, the significant negative correlation area (SNCA) over EEtP may not directly reflect the changes of regional Hadley circulation in association with tropical heating or cooling and, therefore, is not our main focus here. We must point out that the areas with the SPCA, especially the ones that lag for months over Pacific middle latitudes, may not be the direct response to the abnormal regional Hadley circulation in the corresponding longitude areas. However, finding an indirect relationship between the phenomenon and the abnormal Pacific Hadley circulation is still meaningful because the SPCA might indicate in situ PSH changes months later.
Figures 3 and 4 show the SLPa distribution for El Niño and La Niña composites from January to December, based on 15 samples with the highest and lowest SST3DJF in the 0 years, respectively. The SLPa patterns in Figures 3 and 4 match the correlation pattern in Figure 2, especially during the first few months, except for positive (negative) SLPa areas in Figure 3 or negative (positive) SLPa areas in Figure 4 instead of positive (negative) correlation areas in Figure 2, suggesting that El Niño and La Niña plays similar but an opposite role in affecting SLPa distribution. In the first four months, an SNCA and an SPCA were centered in the Eastern and Western Pacific, respectively (Figure 2a-d).
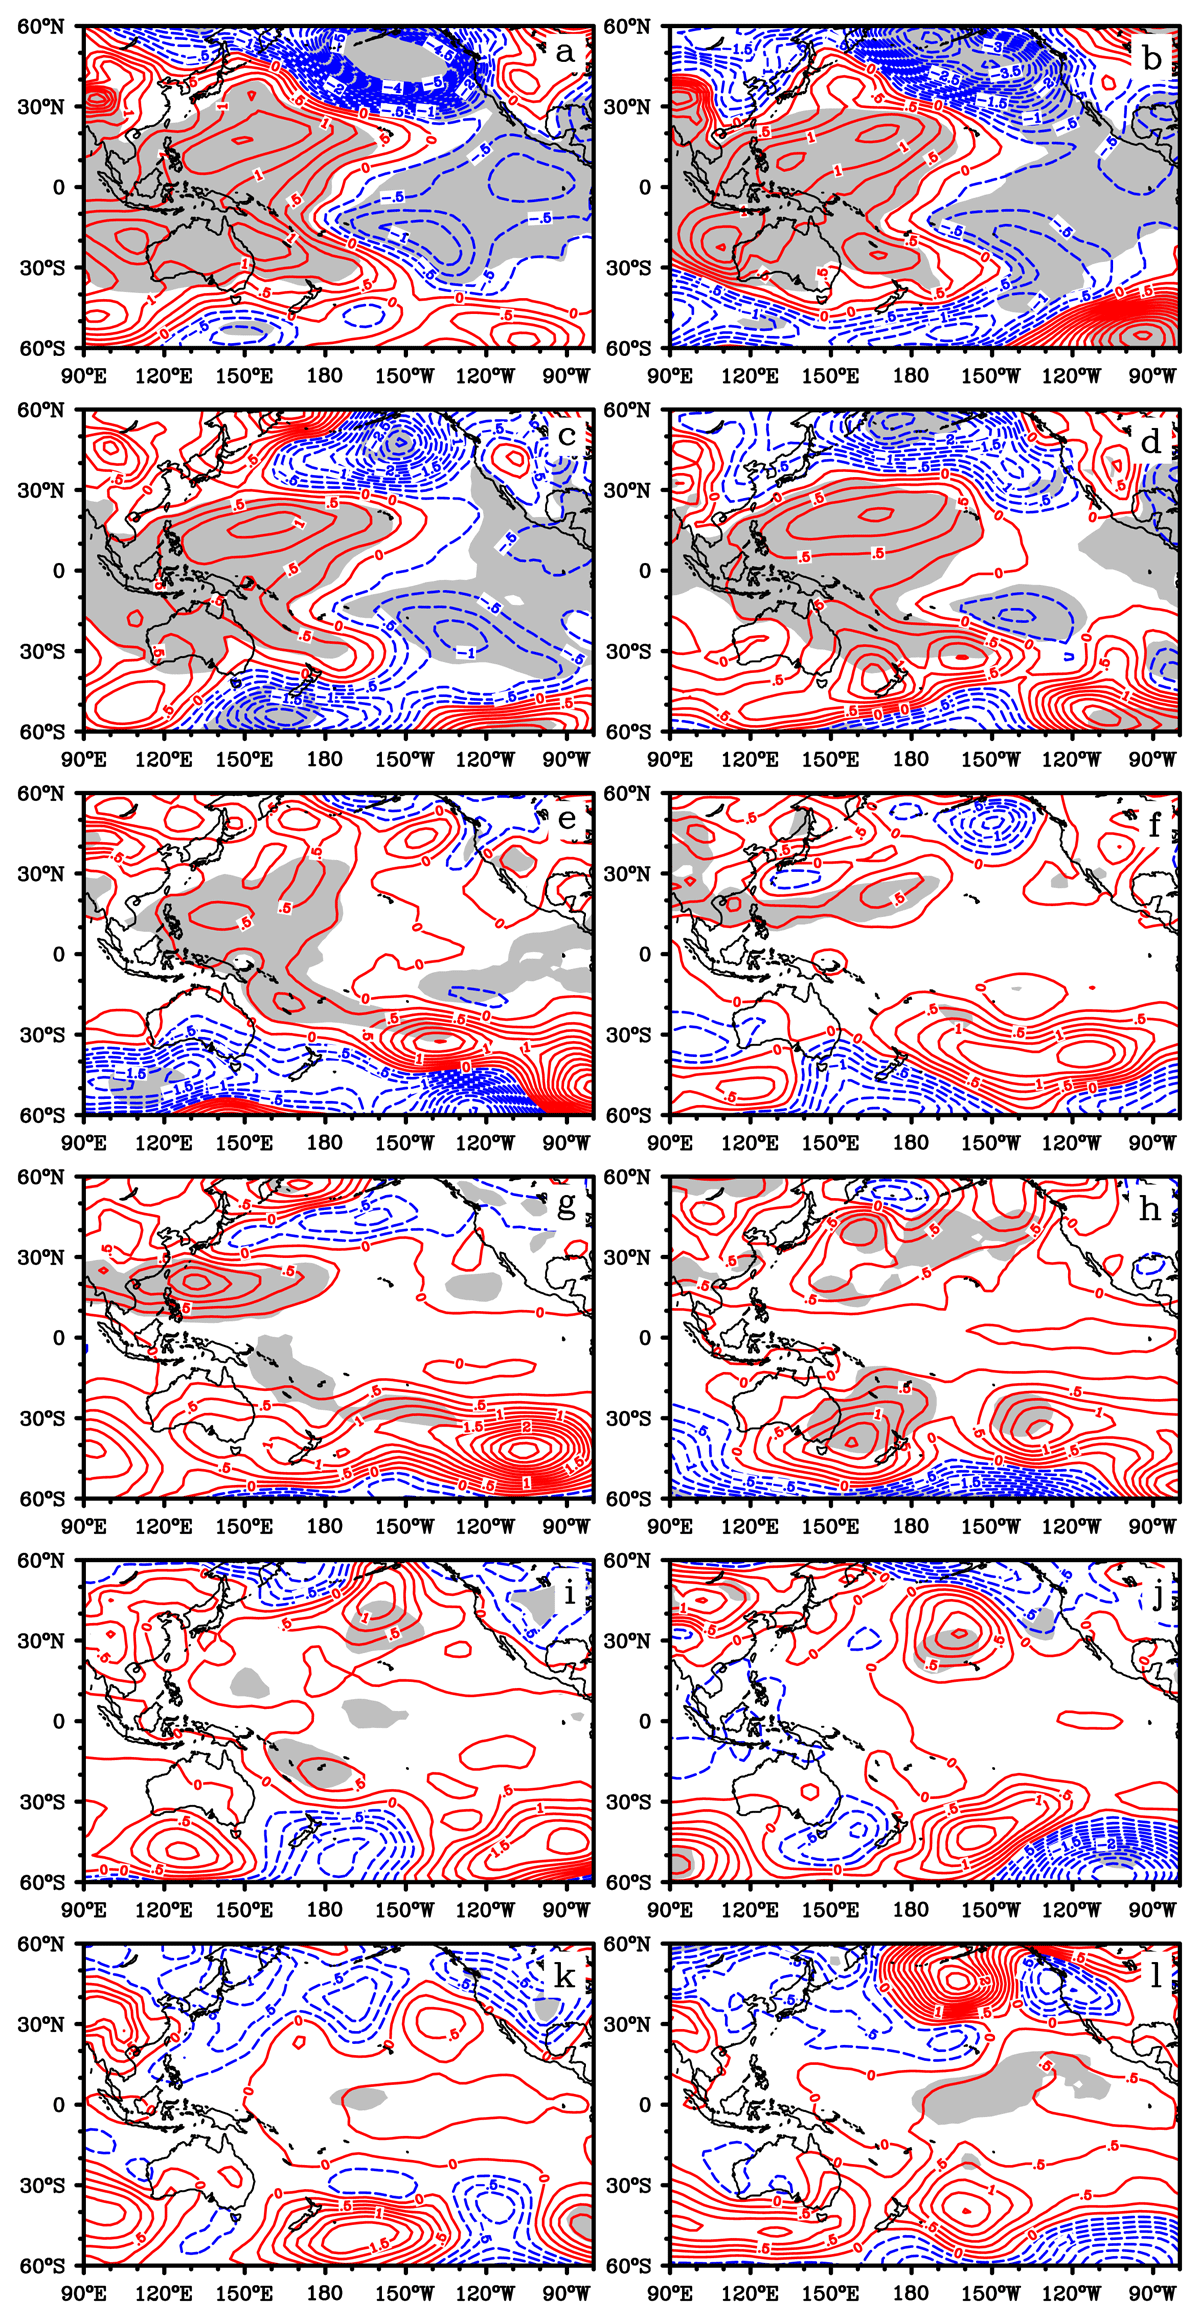
Figure 3
SLPa distribution for El Niño composite from January (+1) to December (+1). Shaded areas were at 95% significance. The contour interval is 0.25 hPa, and dashed contour lines indicate the negative values.
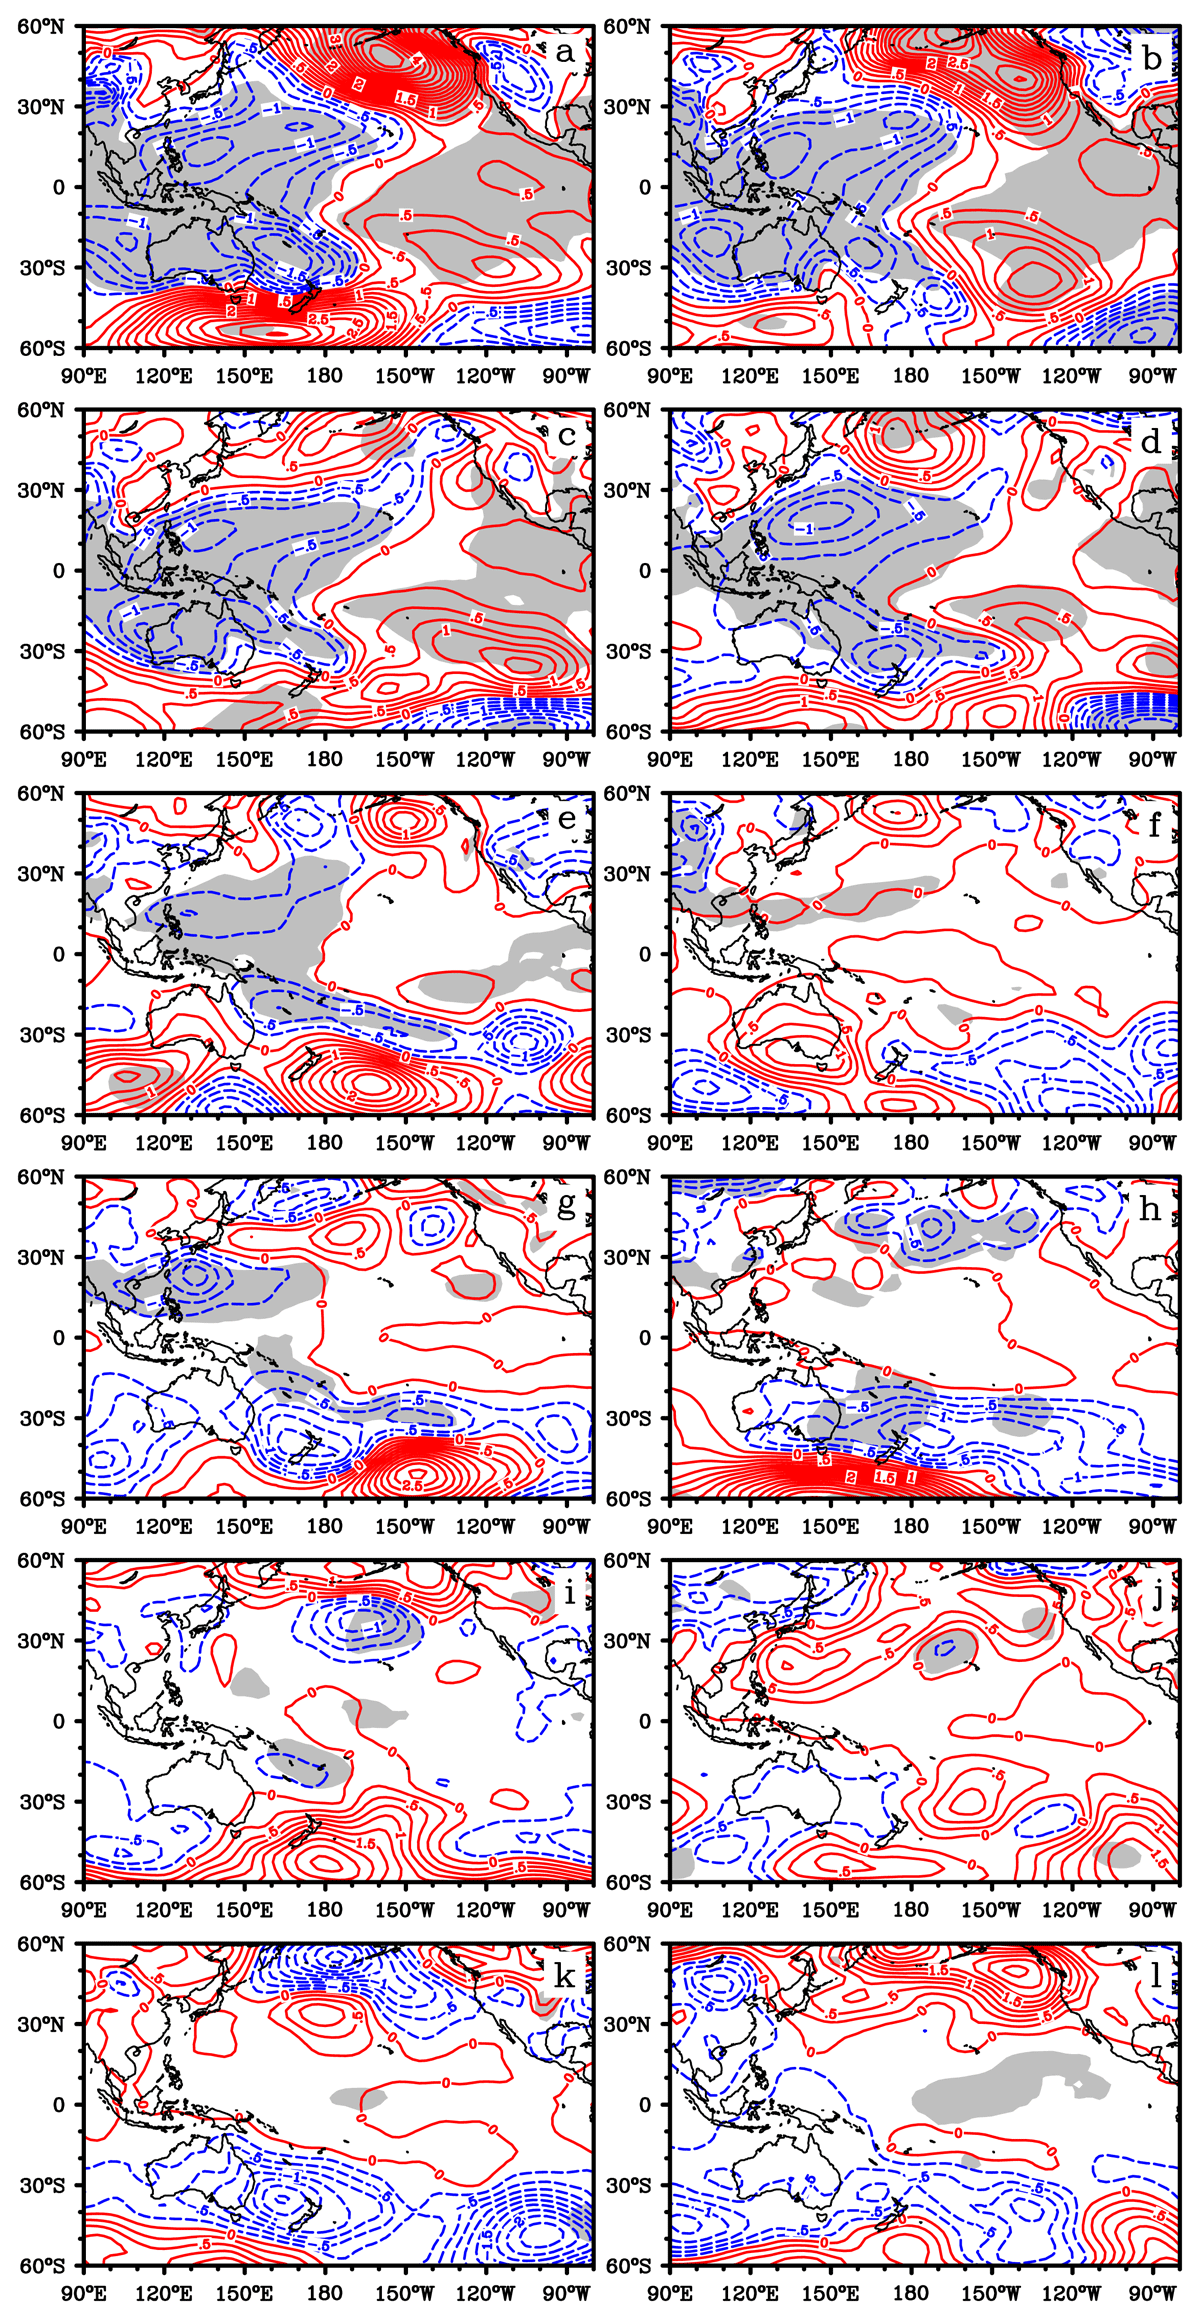
Figure 4
Same as Figure 3 except for the La Niña composite.
The center of significant negative correlation in the east is inserted like a wedge shape into the western SPCA around the dateline, slightly south of the equator. A similar SLPa pattern appeared in Figures 3a-d and 4a-d too. We call this mirror image of capital sigma shape the boundary line dividing opposite correlation or SLPa distribution abbreviated as mirror sigma pattern (e.g., the illustrations in Figure 2a-d). Note that the head of mirror sigma around the dateline in mid-latitude, which was the SPCA in Figure 2, positive or negative SLPa areas in Figure 3 or Figure 4, displayed the changes of the in situ PSH. The mirror sigma pattern was formed as early as November (0) when ENSO began to be deeply matured (refer to Figure 5k and 5l of Wang 2019). Thus, this pattern lasting six months (November (0) to April (+1)) would play an essential role in reducing positive or negative SSTa around the tropical dateline region in later months, as pointed out by Wang (2019).
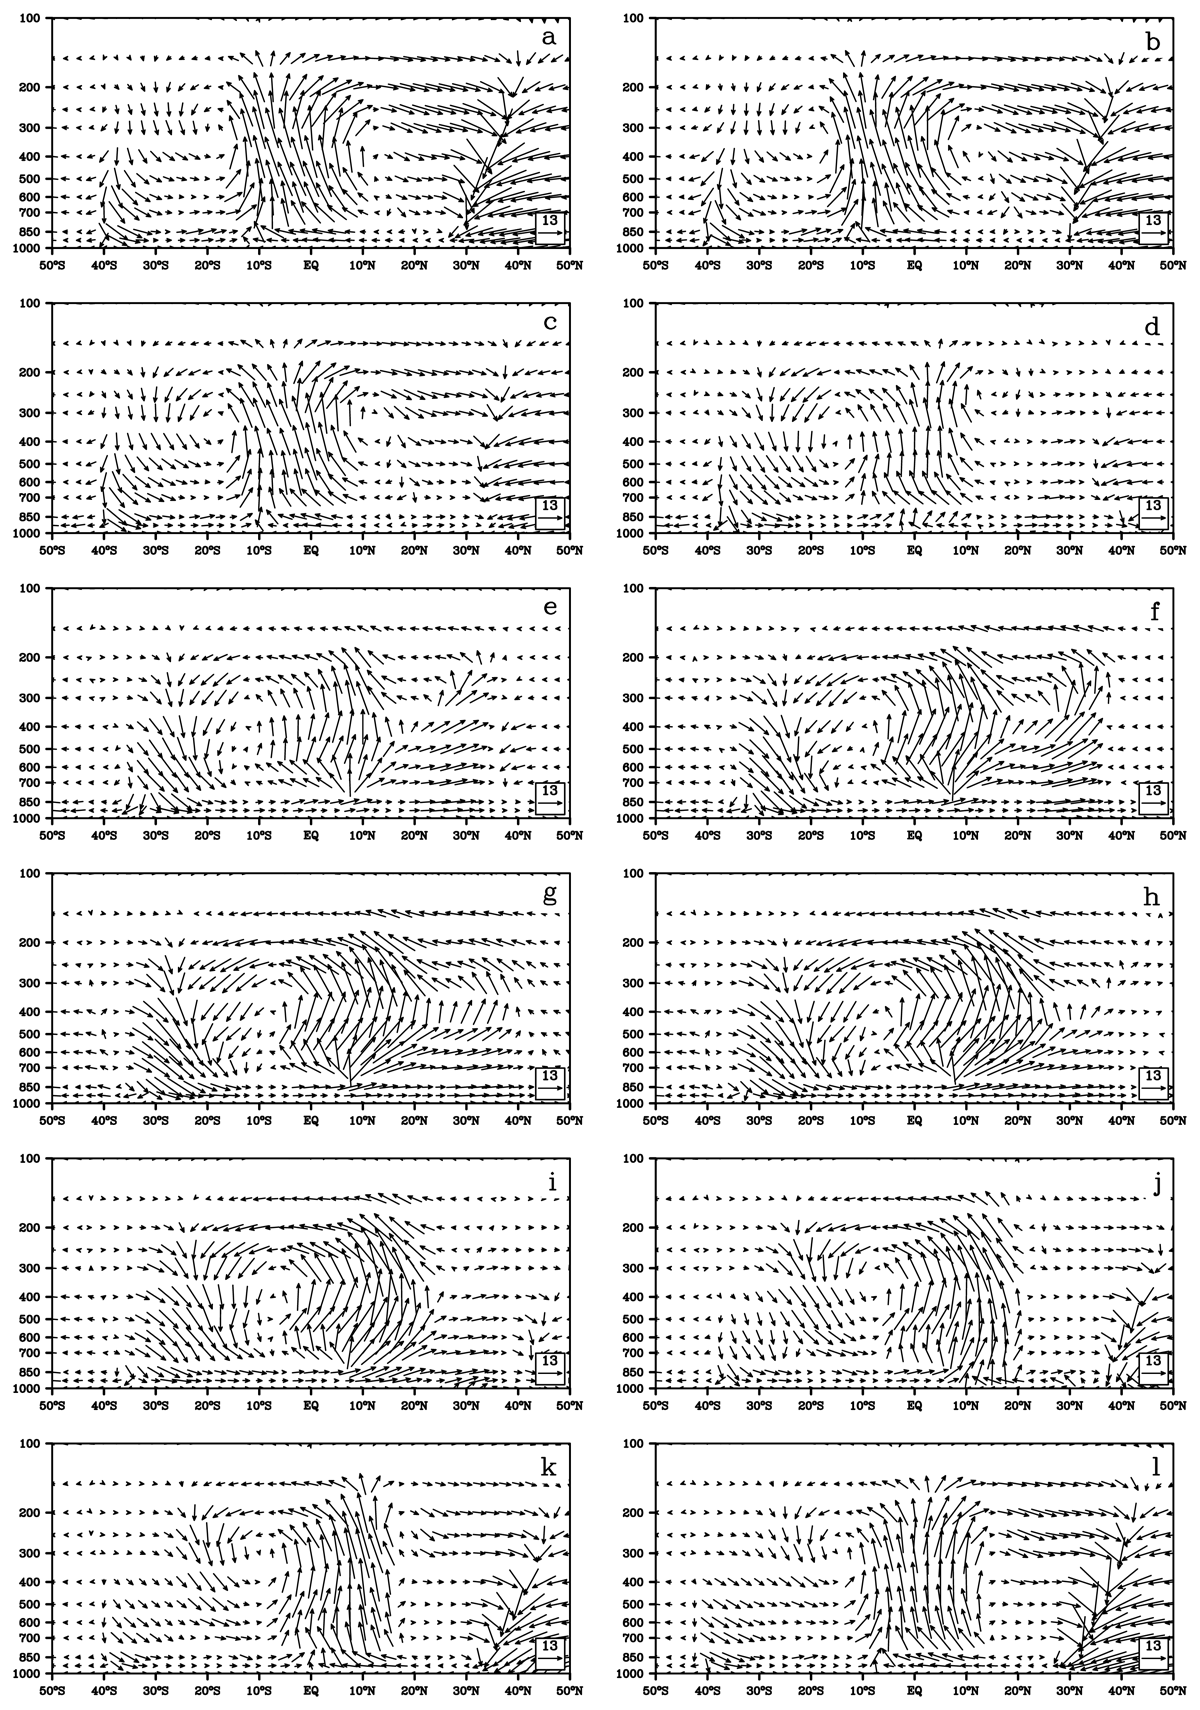
Figure 5
The height-latitude section maps of the climatology of meridional wind (unit: ms-1)/vertical p-velocity (unit: upward positive, ×500–2 hPa s–1) vectors zonally averaged from 100–160°E from January to December.
On the other hand, almost no SPCA existed over EEtP within the Nino 3 longitude scope during ENSO mature to decay period. However, the SPCAs and corresponding SLPa areas around the dateline region, especially in the southern Pacific, tend to eastward expand into EEtP significantly in the next 3–4 months (until August (+1), Figures 2e-h, 3e-h and 4e-h). This phenomenon undoubtedly played a role in weakening the strength of the primitive ENSO power in later months. For example, because of the properties of tropical air-sea interactions, the SPCA overlaying the EEP in Figure 2 has replaced the original SNCA in Figure 2a-e and is indeed consistent with the above analysis. We will show more details about their eastward expansion in Figures 2, 3, 4 later.
5. Regional anomalous Hadley circulation during the El Niño period
Figures 5, 6, and 7 show the height-latitude section maps of the climatology of meridional wind/vertical p-velocity vectors zonally averaged in 100–160°E, 160°E–170°W, and 150–90°W from January to December. These regions represent West Pacific, Central Pacific (dateline sector) and East Pacific (Niño 3 longitude sector), respectively.
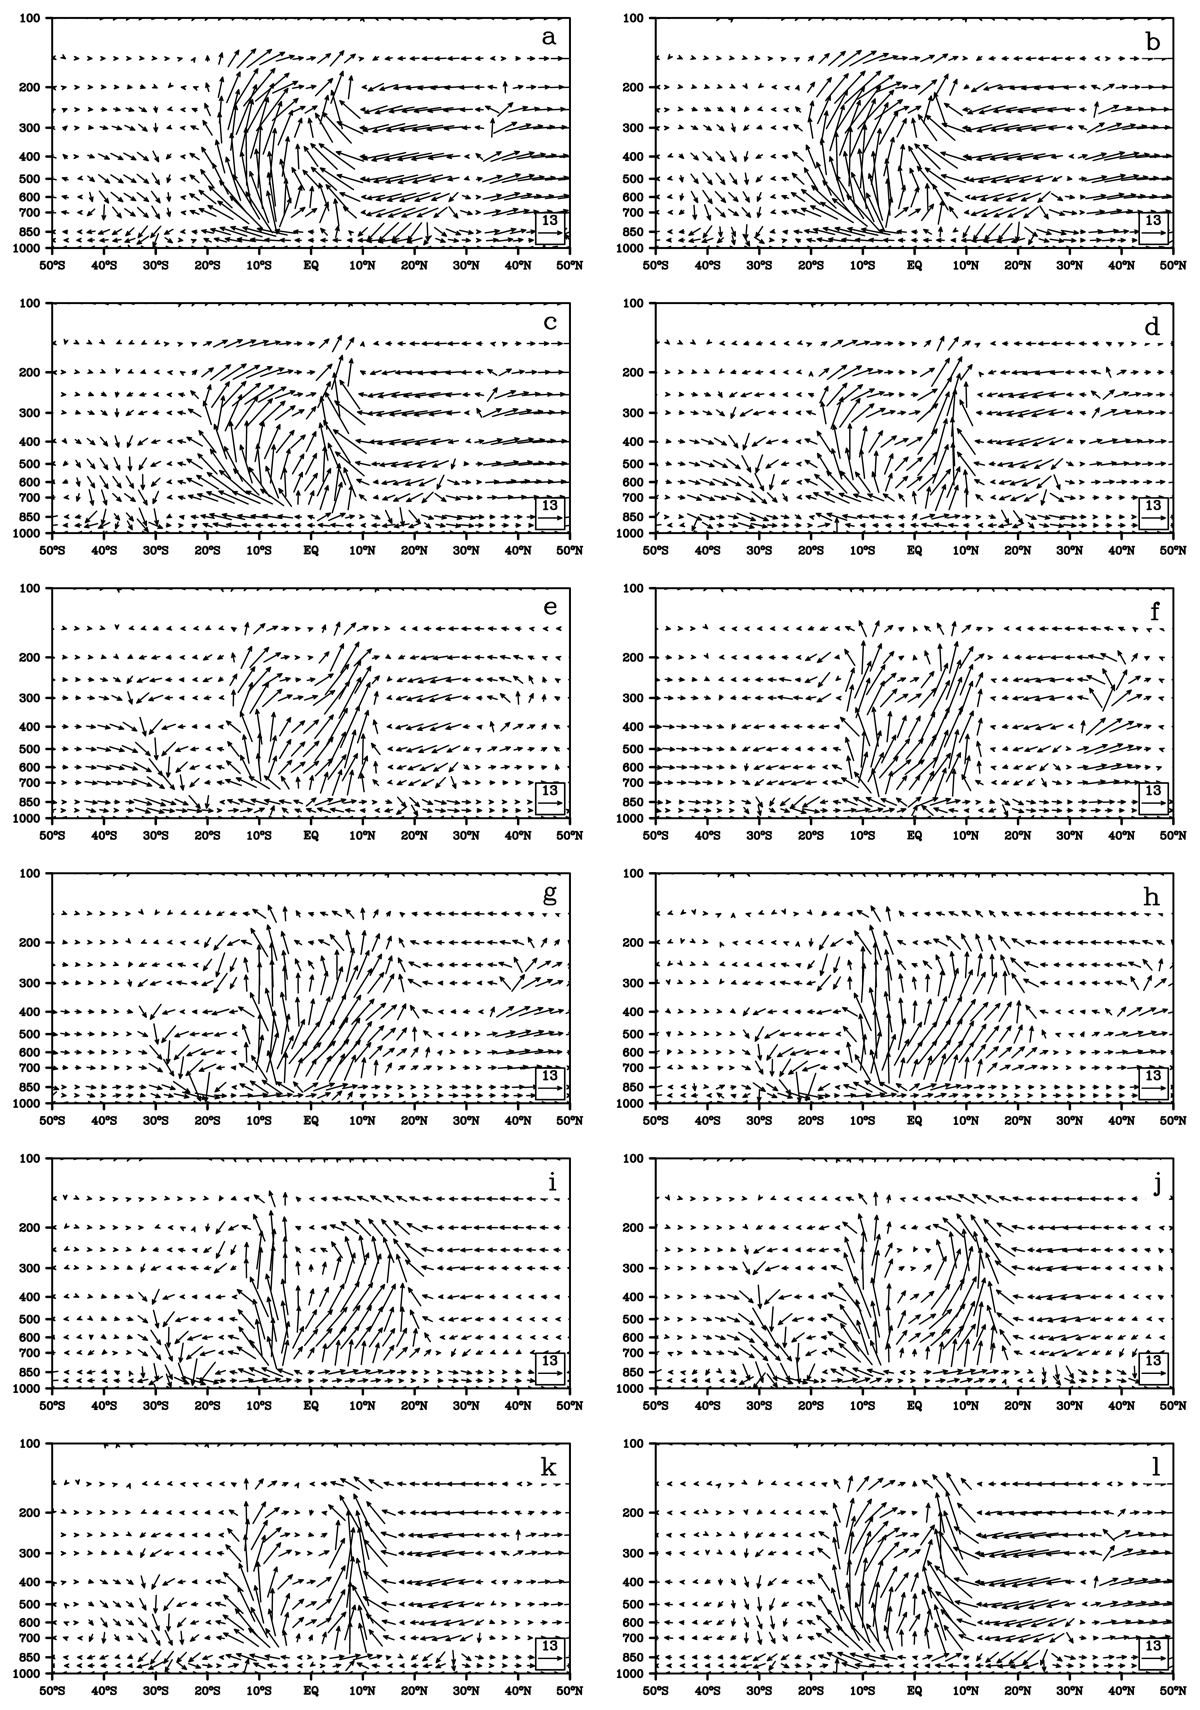
Figure 6
Same as Figure 5, except for 160°E–170°W.
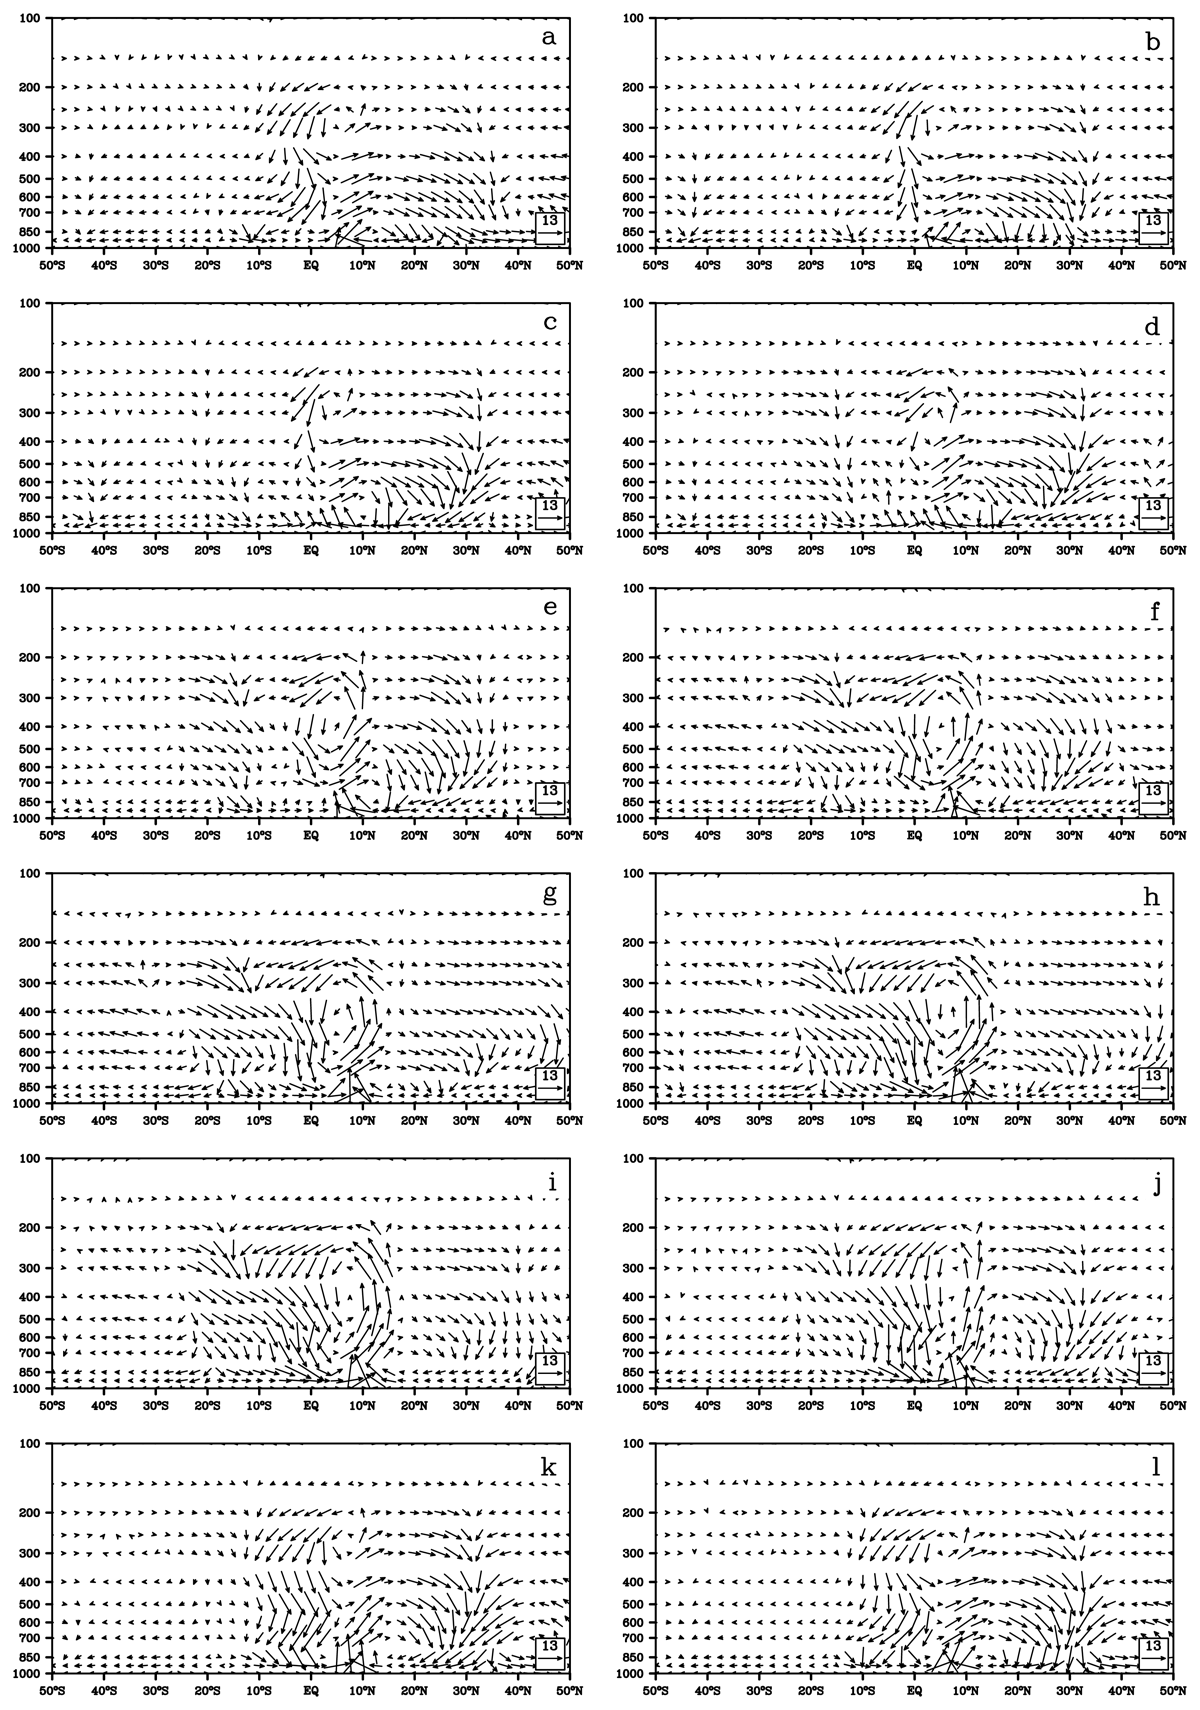
Figure 7
Same as Figure 5 except for 150–90°W.
Figure 5 shows the classic regional Hadley circulation in the North and South Pacific in this longitude band occurs mainly in January, February, November and December, when upward motion near the equator and downward motion near the mid-latitudes are evident. The meridional circulation in the Southwest Pacific is dominant from March to October, with the upward motion zone around 5°S-15°N and the downward motion zone around 15–40°S. This state varies seasonally with slightly moving northward from spring to summer and moving southward from summer to winter. The upward motion dominated around tropics over the dateline region in Figure 6 and showed a seasonal north-south swing similar to those shown in Figure 5. The downward motion dominated around EEP through the year with small meridional circulation rotating counterclockwise around 10°N-0° from May to October as shown in Figure 7. However, their north-south swing with the seasons was not apparent. The magnitude of the rising-sinking airflow appeared to decrease from the western Pacific to the eastern Pacific. For simplicity, we only focused on the anomalous vertical-meridional motions with El Niño events since a similar but opposite situation would occur with La Niña events.
Figures 8, 9, and 10 were the same as in Figures 5, 6, and 7 except for the anomalies in the El Niño composite from September (0) to August (+1), which was with the same samples as in Figure 3. Strong downward motion anomalies over the tropical region (within 10°N–10°S) dominated from September (0) to February (+1) and continued to keep strength until May (+1), as shown in Figure 8a-8i. Later, the downward motion anomalies moved northward to about 20°N and became weaker in Figure 8j-l. The vertical movement over the mid-latitudes of the western Pacific appeared relatively weak throughout the period. On the other hand, the anomalous meridional circulations (AMC), where the anomalous air rises from near the surface to the high altitude in the tropics, flows to the north and south, and descends extratropics,2 dominated from September (0) to April (+1) (Figure 9a-h). In addition, the AMC in the south is more orderly than that in the north. The AMC disappeared gradually over the rest months. However, although strong upward motion around the tropics existed from September (0) to April (+1), there was almost no meridional circulation in Figure 10 except for a weak southern one in June (+1). Sometimes, the anomalous upward motion also happened over southern EEtP in that period (e.g., September (0)), which implies weak eastern PSH was still surviving in mature El Niño, as pointed out by Wang (2019). The anomalous downward motion over southern EEtP (~30°S) appeared from April (+1) to August (+1), as shown in Figure 10h-l.
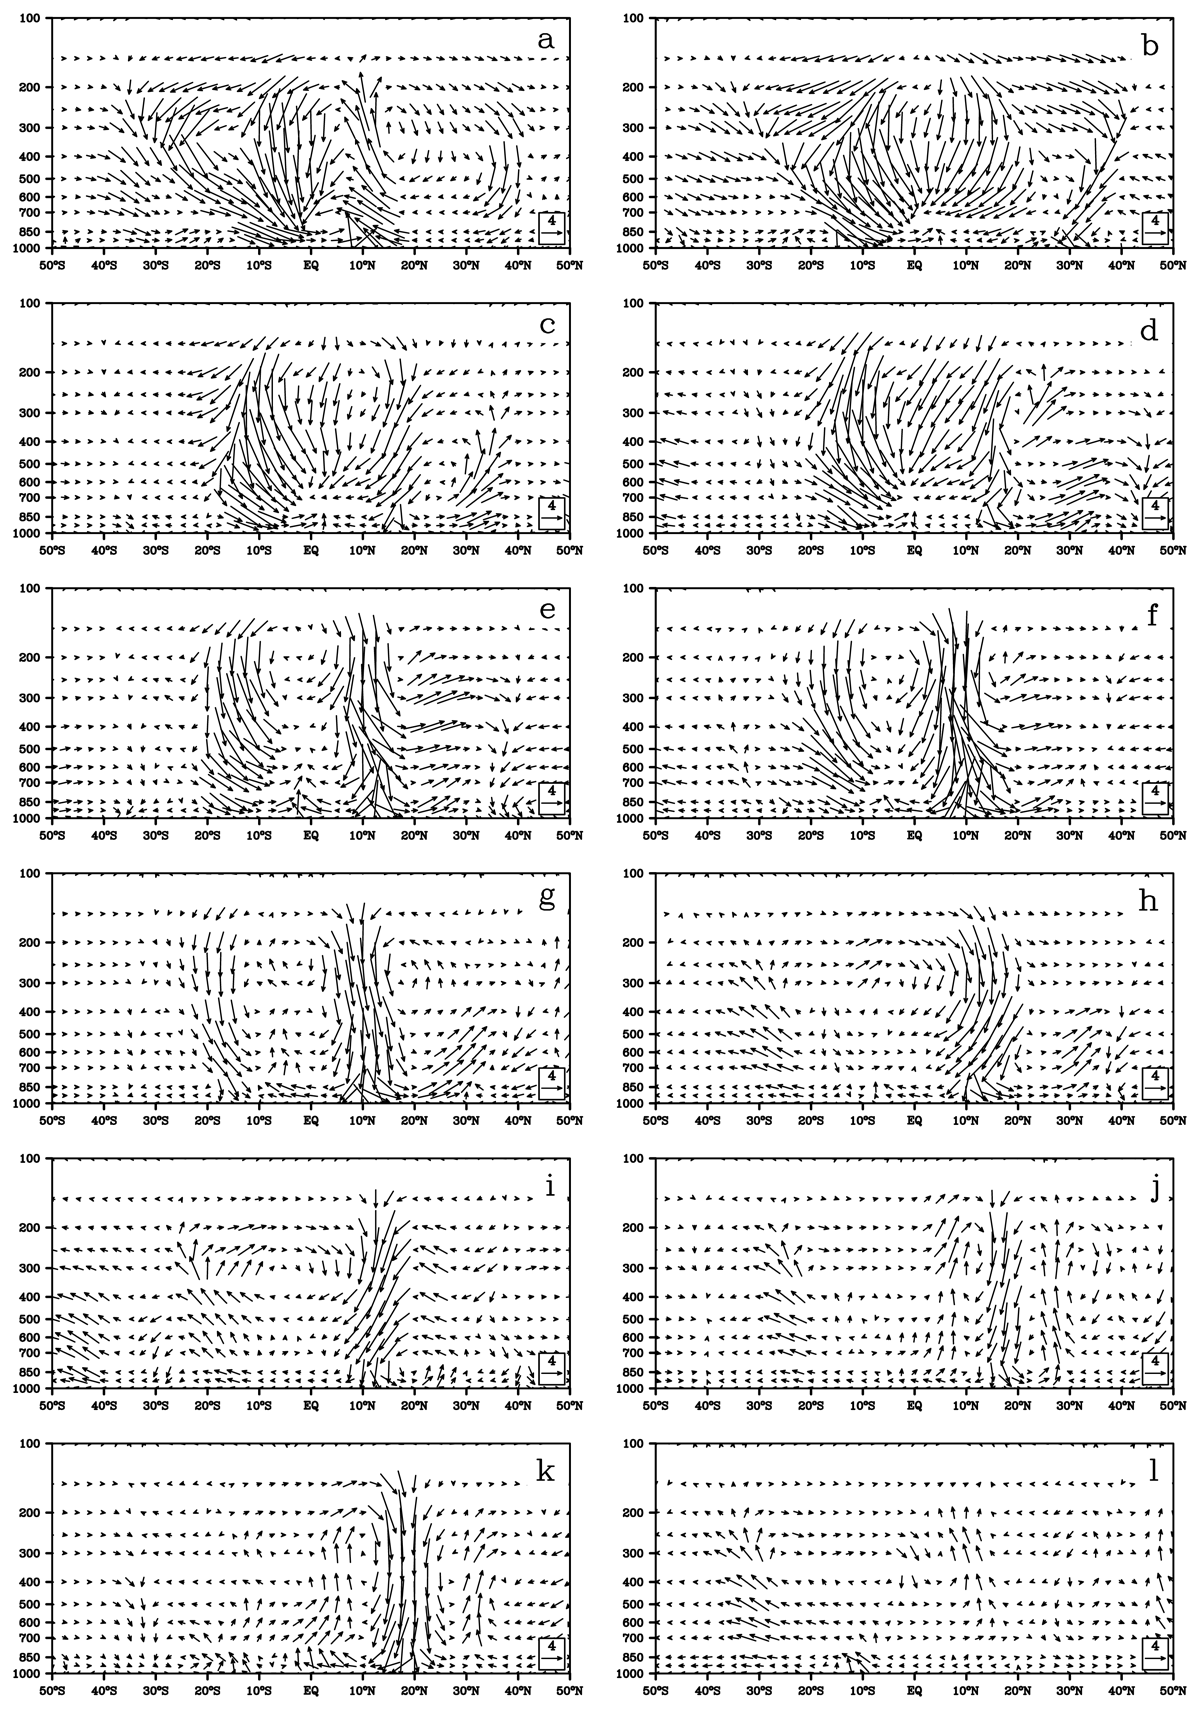
Figure 8
Same as Figure 5 except for the anomalies for the El Niño composite from September (0) to August (+1).
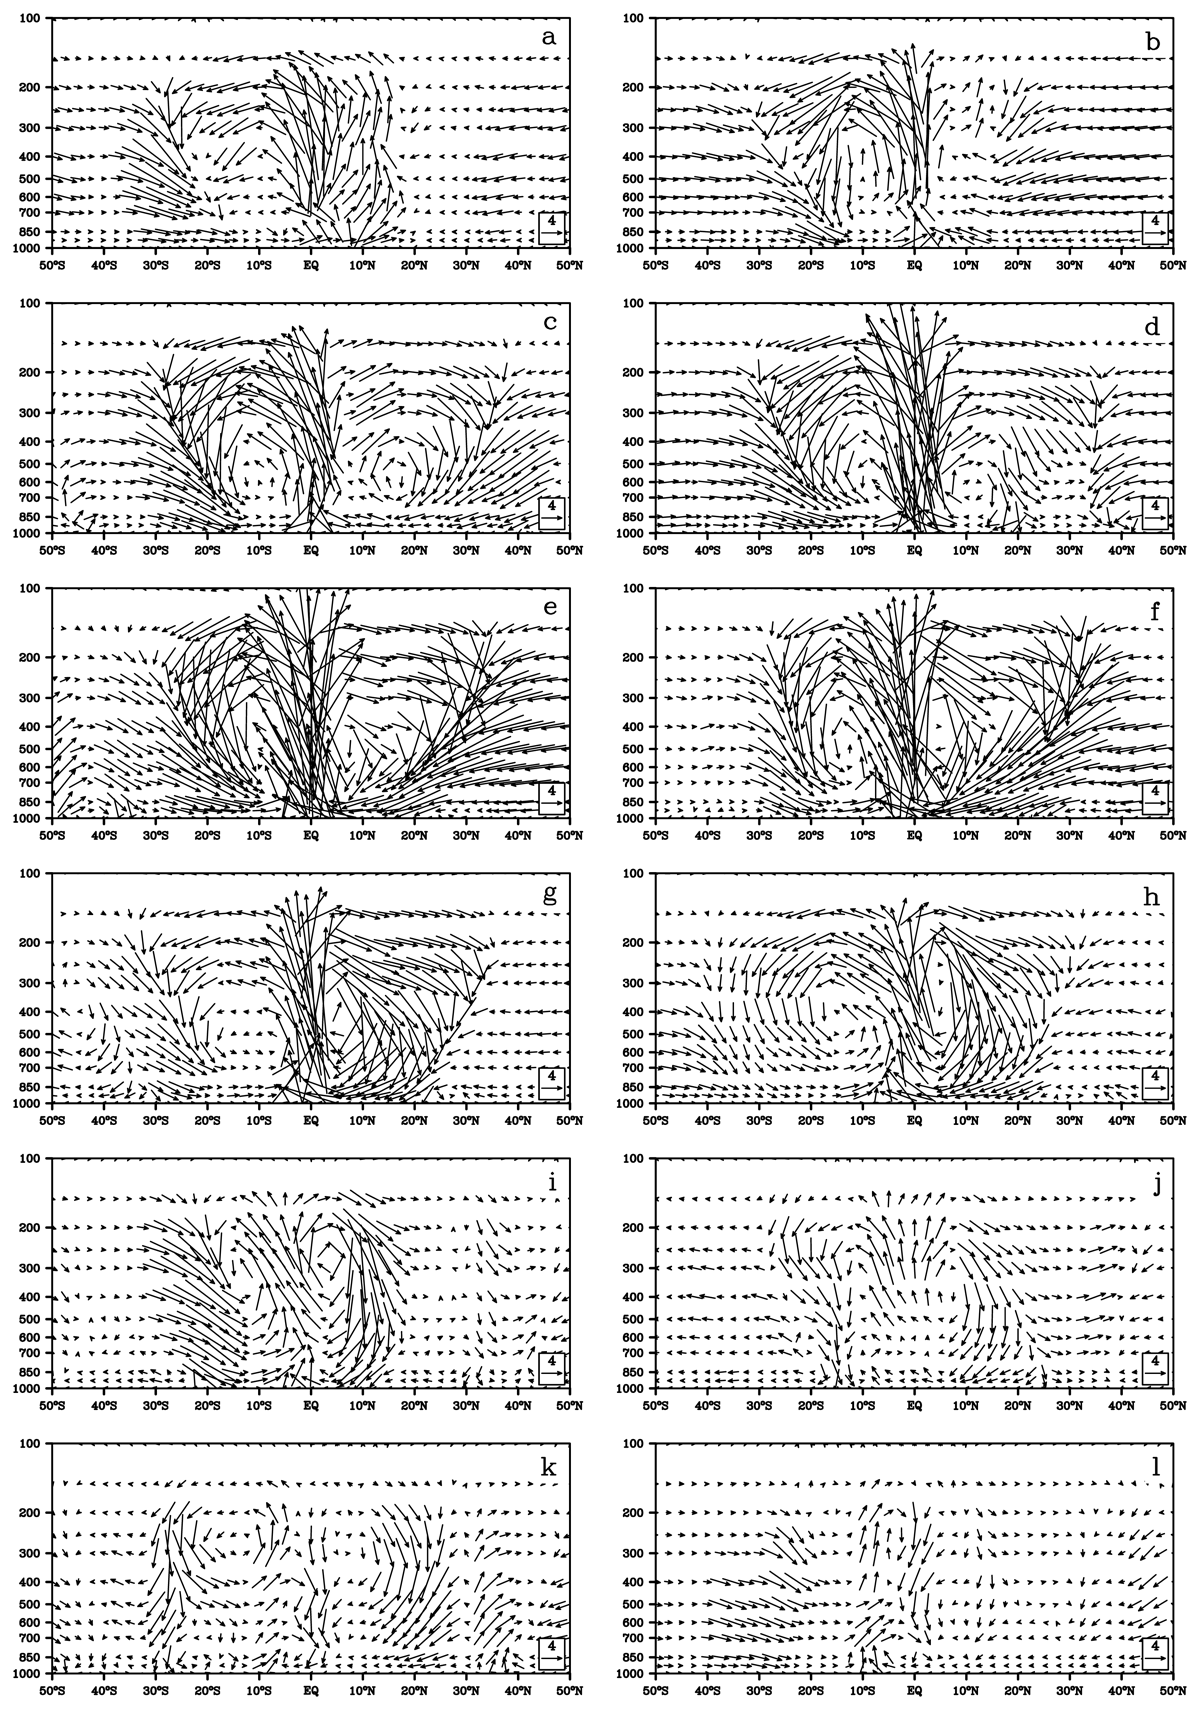
Figure 9
Same as Figure 6 except for the anomalies for the El Niño composite from September (0) to August (+1).
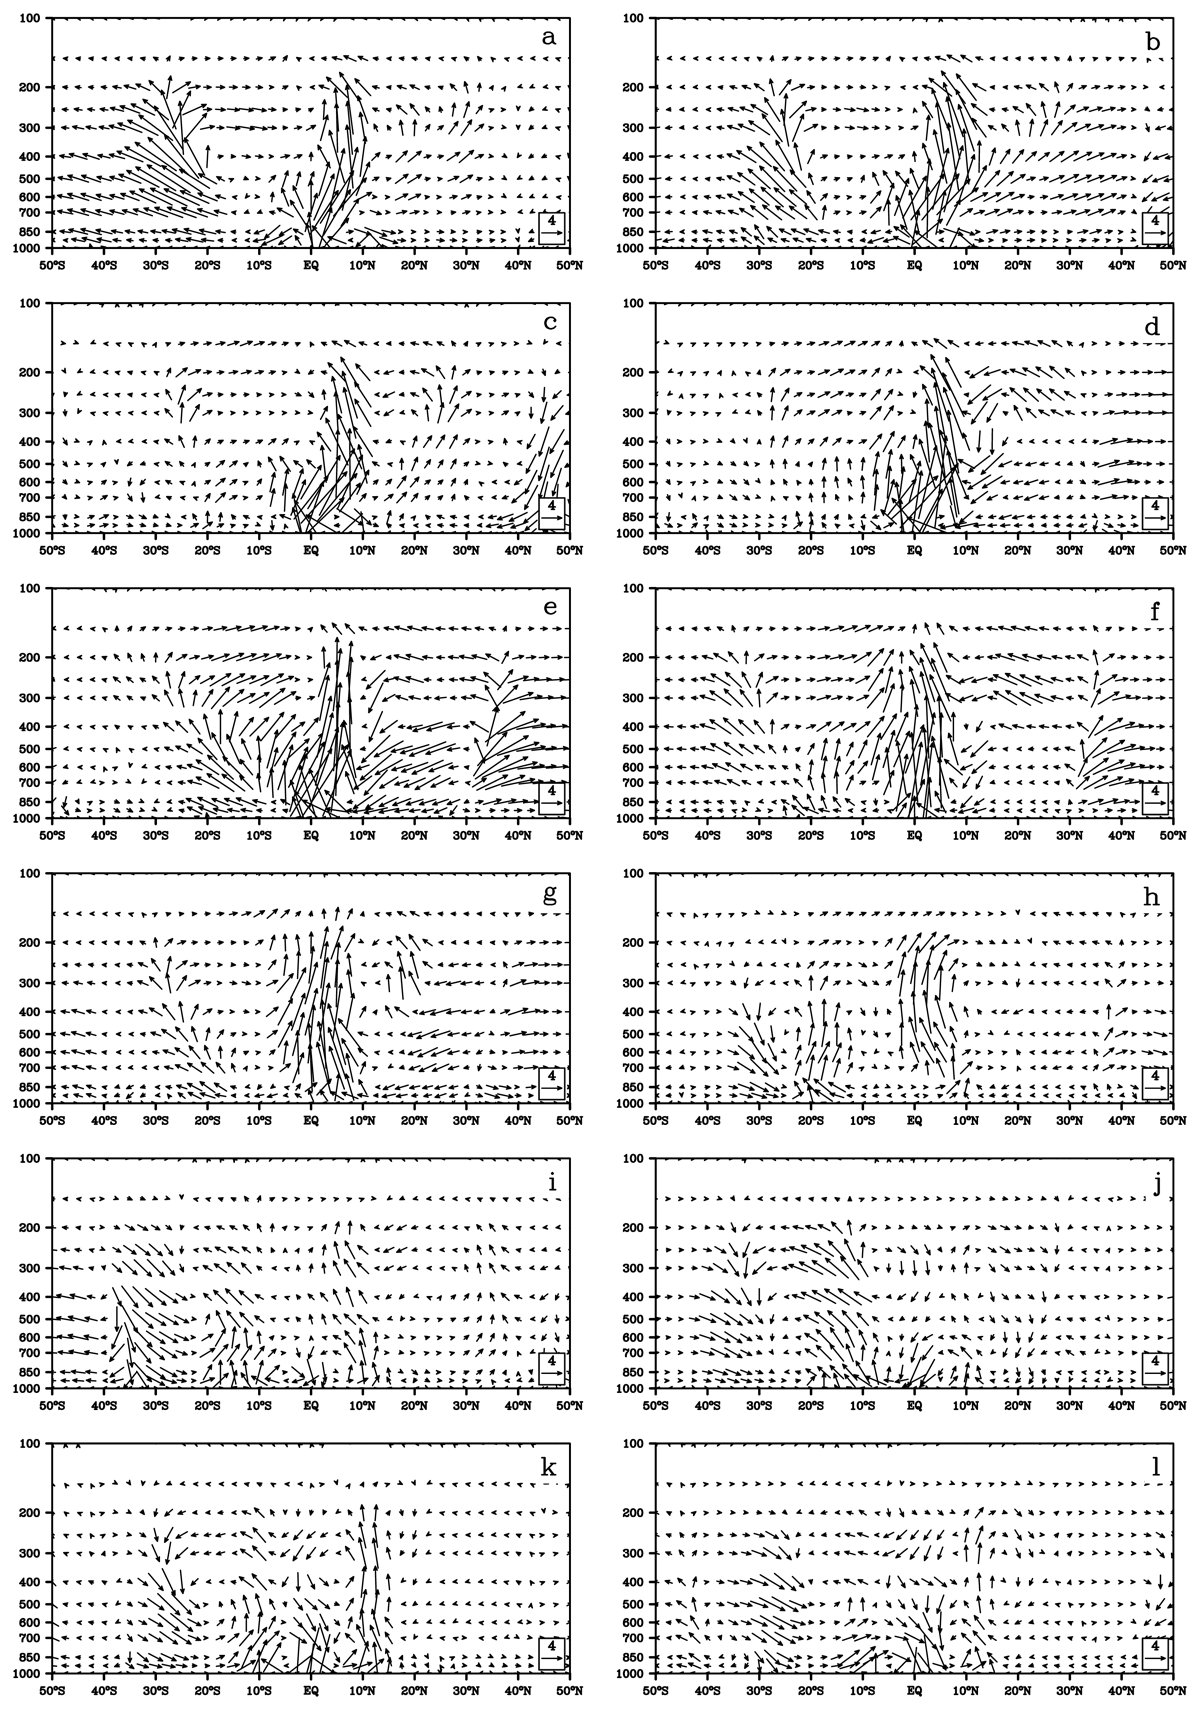
Figure 10
Same as Figure 7 except for the anomalies for the El Niño composite from September (0) to August (+1).
The AMCs in Figure 9a-h are more like an anomaly of the Hadley Circulation over the entire Pacific Ocean concentrated around the dateline due to their classic circulation style. Therefore, the dateline AMC generated by El Niño would be considered to represent an increase in the Pacific Hadley Circulation, in agreement with Bjerknes (1966, 1969). For the same reason, the dateline AMC with the opposite anomalous circulation caused by La Niña would decrease the Pacific Hadley circulation. There were also similar approaches as above to describe the regional Hadley circulation (e.g., Wang 2002, Chikamoto et al. 2010), although the purpose of the study here is different from theirs.
Figure 11 shows the composite evolution of SLPa averaged in 20–30°S, 160°E–170°W (Index 1), and SLPa averaged in 30–40°S, 150–120°W (Index 2) from January (0) to December (+1), which were located around the southern descending branch of the Hadley circulation. Meanwhile, the SLPa of the Index 1 around southern Central Extratropical Pacific (CEtP) increased from –0.07 hPa in September (0) to a maximum of 1.0 hPa in December (0) and fluctuated less thereafter, indicating an accumulation of an in-situ air mass generated by the increased Pacific Hadley circulation during the El Niño mature period. The SLPa of the Index 2 over southern EEtP continually grew from –2.52 hPa in September (0) to 1.54 hPa in July (+1), and the values above 1.0 hPa continued from May (+1) to August (+1). The maximum value of Index 1 is approximately 5–7 months ahead of the maximum value of Index 2. This may reflect the upstream accumulation of air masses shifting southeastward along the westerlies into the southern EEtP region where larger air mass accumulation is reached. To verify this cumulative effect of downstream SLPa we calculated lag correlations between the time series of these two indices as shown in Table 1.3 Table 1 shows that a significant correlation exists when Index 2 lags Index 1 from 3 months to 8 months lag. In particular, at a lag of 6 months, the maximum correlation coefficient reaches 0.95, which exceeds the 99.99% confidence level. The values in Table 1 mainly reflected the lagged relationship between the strong activities of the SLPa in both locations during the El Niño mature to decay period included mainly in the second half of the sample series. The physical process about the correlations in Table 1 can be explained as below: During the period of mature El Niño, the positive AMC near the dateline continually intensified, which led to a mid-latitude mass accumulation i.e. positive SLPa around southern CEtP. The positive SLPa that kept moving eastward along the westerlies to the downstream region of 30–40°S, 150–120°W would physically create positive lagged correlations of the SLPa between the two locations. The downstream mass accumulation would reach the peak when the lagged correlation coefficient became its highest in the sixth month. Afterward, the lagged correlation coefficient gradually decreased with time as the upstream positive AMC became weak.
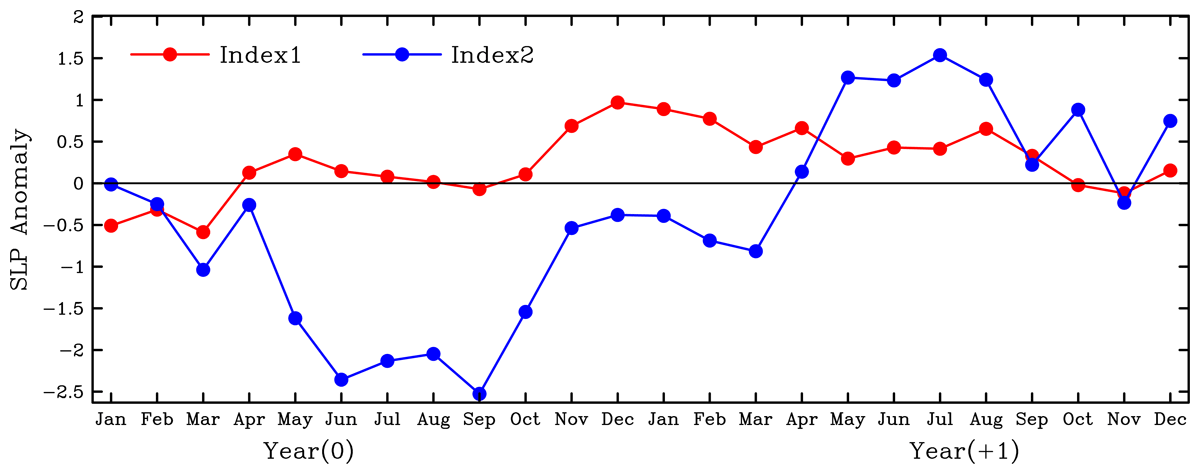
Figure 11
Evolution of the SLPa averaged in 20–30°S, 160°E-170°W (Index 1, red line), and SLPa averaged in 30–40°S, 150–120°W (Index 2, blue line) for El Niño composite from January (0) to December (+1). Unit: hPa.
Table 1
The correlation coefficients between Index 1 and Index 2. Index 2 lags Index 1 from one month to nine months. Bold or Italic Bold values signify significance above 95% or 99.99% confidence level. The NDF means the number of degrees of freedom.
| Lag months | 1 | 2 | 3 | 4 | 5 | 6 | 7 | 8 | 9 |
| Correlation | 0.21 | 0.346 | 0.472 | 0.693 | 0.812 | 0.947 | 0.795 | 0.654 | 0.371 |
| NDF | 21 | 20 | 19 | 18 | 17 | 16 | 15 | 14 | 13 |
These statistical results provide conclusive evidence that the positive SLPa of the Index 1 over the southern bulge part of the mirror sigma pattern was formed by the previous air mass accumulation around 20–30°S, 160°E–170°W, which was located exactly at the southern descending branch of the AMC as shown in Figure 9a-j and 11. Moreover, the upstream SLPa (Index 1) caused by the anomalous regional Hadley circulation around the dateline region could significantly expand to southern EEtP several months later to change in situ PSH (Index 2, Figure 11), which also coincides with the results shown in Figures 2, 3, 4. The westerlies in mid-latitudes would be responsible for controlling the SLPa eastward expansion. Note that despite the upward motions over EEP and the downward motions over southern EEtP (Figure 10h-l), it does not constitute a positive AMC because of absence of the northerlies connection between them. Thus, the downward motions over EEtP would result from upstream positive SLPa eastward moving from southern subtropical dateline into southern EEtP as shown in Figure 11.
Similar time series for SST3a of the El Niño composite in Figure 1 evolved as a SINE curve with a maximum (1.57 K) in December (0) and a minimum (–0.50 K) in December (+1). The SST3a reversed after the strong positive SLPa of the Index 2 over southern EEtP persisted for four months.
6. Discussion
6.1. Representativeness of SST3DJFa
Section 3 shows that the SST in EEP is more indicative of heating or cooling the overhead air than SST in WEP during the ENSO period because the former has more significant variability and is less affected by global warming. In particular, the SST3DJFa could well represent the long-lasting heating or cooling over the equatorial areas east of 170°E in the ENSO years. On the other hand, since the climatology of SST over EEP keeps quite a lower value than that in WEP, downward motion usually occurs in situ, as shown in Figure 5. Thus, it is hard to see the AMC occurring in the Nino 3 longitude sector. However, generated by ENSO events, the AMC around the dateline could just represent the most muscular regional Hadley circulation anomalies over the Pacific. Thus, the SST3DJFa would be the best tool we can use to detect Pacific Hadley circulation changes here.
6.2. The formation of the mirror sigma pattern
Observational data show that as the ENSO event progresses from the mature to the beginning of the decay stage (September (0) to May (+1)), an AMC occurs near the dateline where anomalous ascending air over the tropical region diverges to the north and south, sinking to the surface near the subtropical area in El Niño case, while the opposite of the anomalous flow direction is true in the La Niña case. The regional AMC coincided with classic or anti-classic Hadley circulation style during this period. Thus, those abnormal circulations would play a full role in enhancing/weakening the global Hadley circulation during their dominating period, as shown in Figure 9a-j. As mentioned in section 5, the mirror sigma pattern began in November (0), two months after the AMC dominated. Therefore, the SLPa located around subtropical dateline regions, i.e., the head part of the mirror sigma pattern, would result from the AMC that plays a role in transporting air mass between tropics and subtropical dateline region. Index 1’s SLPa increasing from September (0) to December (0) around the dateline was an excellent example of the gradual air mass accumulation under the descending branch of the Hadley cell due to the southern AMC in mature El Niño phases in Figure 11. The growing positive SLPa around the southern subtropical dateline was building part of the mirror sigma pattern. The northern part of the mirror sigma pattern around the dateline was the production of the northern AMC as well. Similarly, the negative SLPa over both sides of the equator around the dateline, also related to the mirror sigma pattern, could be found in the La Niña cases. The above two processes were not displayed here for simplicity.
Figure 12a and 12b show horizontal wind vector anomalies at 300 hPa and 850 hPa in the mature El Niño period (averaged from September (0) to February (+1), respectively. As shown in Figure 12a, a strong easterly wind anomalies belt dominated along the equator to the east of the dateline and encountered weak westerly wind anomalies in the west. In contrast, two strong anomalous westerly wind belts parallel to the easterly wind anomalies belt appeared in the subtropical areas on the north and south sides of the equator. Divergent outflow anomalies occurred between the equator and subtropical regions, especially over the dateline regions. On the other hand, the opposite direction of the wind anomalies to the high-level ones along the equator existed, and the convergent inflow anomalies appeared between the equator and subtropical regions at the lower level, as shown in Figure 12b. A negatively anomalous Walker circulation could significantly feature on the equator of the center-eastern Pacific in the mature El Niño period. For the same reason, positive Walker circulation anomalies in situ existed in the mature La Niña period (omitted). The mirror sigma pattern in Figures 2, 3, 4 should result from the interaction between the Walker and Hadley circulations, which ENSO forces.
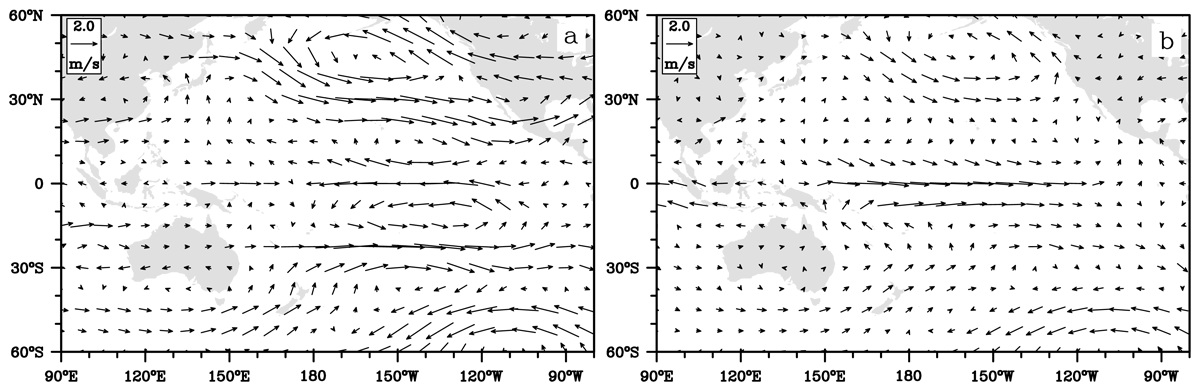
Figure 12
Horizontal wind vector anomalies for El Niño composite at 300 hPa (a) and 850 hPa (b) from September (0) to February (+1). Unit: ms–1.
Almost no classic Hadley circulation and AMC existed around the Nino 3 longitude sector during the mature ENSO period, as shown in Figures 7 and 10, despite anomalous solid upward or downward motions existing in the ascending branch of the Hadley cell. There are two reasons for the situation: (1) the trade wind is known to permanently cause the upwelling over EEP, which can keep cooling overhead air in situ. This effect results in quite a robust downward motion dominating in Nino 3 area (Figure 7). Thus, even El Niño cannot change the downward motion trend over the EEP since the magnitude of the generated upward motion anomalies was too small compared to the climatology; (2) As pointed out by Wang (2019), significant weak or strong eastern PSH belts with anomalous upward or downward motion dominating over EEtP was crucial to forming El Niño or La Niña. Moreover, this situation would remain until the mature stage of the ENSO. Thus, according to different air-sea interaction rules followed by tropical and extratropical regions (Wang 2009), the anomalous vertical motions over EEP and EEtP would be in the same direction, which was one of the reasons why AMC hardly develops in the Nino 3 longitude sector.
On the other hand, although the Central Equatorial Pacific (CEP) and WEP usually maintain a much higher SST than EEP, the SSTa over CEP is consistent with that over EEP during the ENSO mature period. In addition, there was no problem over subtropical central Pacific as that occurring over EEtP. Thus, the dominance of the classic anomalous Hadley circulation around the dateline during the ENSO mature period is reasonable. These might also be one of the reasons why the anomalous Walker circulation along the equator could become enhanced during the ENSO mature period.
The mechanism of forming the mirror sigma pattern would be as follows: The opposite thermal anomalies on the east and west sides of the tropical Pacific Ocean usually accompany the initial maturity of ENSO. Over a larger area, including mid-latitudes, SLPa centers were formed with opposite signs to their respective equatorial SSTa due to the air-sea interaction. At this time, the thermal imbalance between the east and the west caused the tropical Walker circulation becomes abnormal and intensified significantly in the central to the eastern Pacific Ocean. Because of the abnormal Walker circulation, the intense convergence or divergence occurs around the dateline equatorial region, making AMC concentrated in situ. In this case, the air mass and heat exchange between tropics and extratropical regions can be transferred mainly through this dateline channel. The AMC causes the accumulation or reduction of air masses around the mid-latitudes of the dateline, and eventually to the formation of the positive or negative SLPa in situ, i.e., the two bulges of the SLPa extending from the extratropical zone of the western Pacific to the subtropical dateline. The formation of the mirror sigma pattern is complete.
6.3. The impact of ENSO events on the ENSO cycle
As analyzed above, ENSO events could cause corresponding SLPa over subtropical regions to the east of the dateline after the anomalous regional Hadley circulation around the dateline, which means that the original SSTa over EEP would be reduced or reversed a few months later. However, this impact is limited because the curve of SST3DJFa appeared to have a reasonably convergent oscillation trend, i.e., after reaching the maximum value of 1.57 K in December (0) as the peak El Niño month, it only drops to a minimum of –0.5 K in December (+1) as shown in Figure 1. We can also explain this phenomenon because the generated significant SLPa over EEtP was not strong enough and did not last long enough. According to our statistics, only 1/3 of ENSO events could completely reverse in the following years, without more significant classic anomalous Hadley circulation around the dateline than the other 2/3 events (results omitted). The ENSO events appeared to play an essential role in adjusting the ocean and atmosphere to a near-normal state.
Nevertheless, the mirror sigma pattern would be an apparent sign of making ENSO impact the ENSO cycle. As mentioned in section 5 and the last subsection, the process of the formation of the mirror sigma pattern was like the generator of the SLPa around Pacific mid-latitude-dateline regions and EEtP, which could affect the ENSO cycle by expending primitive ENSO energy to at least restore the SST over EEP to a neutral state. However, the effect is usually not strong enough to reverse it to the opposite phase.
However, since SST3DJFa has a two-year lag of significant negative autocorrelation (–0.317 over 95% confidence level), it is plausible that the ENSO can keep the impact of the SLPa over EEtP for a more extended period to contribute to the transition from El Niño to La Niña or vice versa. Therefore, more enhancement of the SLPa over northern EEtP and upstream supplementary to both sides of the SLPa over EEtP would be essential to reverse ENSO events. Note that the change of the PSH is primarily associated with the global Hadley circulation’s change, which may have a delayed effect longer than a year on the SLPa over EEtP. Further study regarding this point is necessary for the future. Nevertheless, the role of such an impact by ENSO itself on subtropical regions cannot be ignored in the ENSO cycle.
6.4. Other discussions
As shown in Figures 2, 3, 4, the correlations and SLPa were less significant over northern EEtP than southern EEtP after the ENSO mature period. This phenomenon would mean that the SLPa generated around the subtropical dateline in the North Pacific will not expand eastward to the subtropical area of the East Pacific smoothly as in the case in the South Pacific. On the other hand, as we know, some stationary waves along mid-latitudes during boreal summer tend to propagate eastward from continents to North Pacific (Wang 1992, Wang and Yasunari 1994). Because the topographic features of the North Pacific differ from those of the South Pacific, the strong eastward dispersion of the stationary waves may cause interference to the eastward expansion of the SLPa around the dateline into the northern EEtP. Further research is necessary in this area in the future.
For simplicity, we have omitted most of the analysis results about the subtropical SLPa situations caused by the La Niña events because the results were quite similar to the opposite state with the El Niño composites. It is worth noting that the minimum of SST3DJFa was only –1.57 K in La Niña of 1973–1974 whereas the maximum of SST3DJFa could reach +3.06 K in El Niño of 1997–1998. El Niño’s air heating over EEP appeared to be much more than La Niña’s cooling. This result implies that the neutral to the La Niña phenomenon might occur much more accessible than El Niño, as Clarke and Zhang (2019) pointed out. The unbalance of the impact on air between El Niño and La Niña would be the next research issue.
In fact, since the influence of the annual cycle was implicitly introduced in our proposed ENSO theory, some important factor affecting the formation of ENSO on longer time scales may be neglected, i.e., the subsurface ocean heating content over WEP. Anderson (2007) found that the upper ocean heat content anomalies over WEP and the northern subtropical SLPa over central Pacific could jointly play a role in forming ENSO events 12–15 months later. The involvement of the upper ocean heat content anomalies would have started several months earlier. According to this, for example, a decrease in the heat content of the western Pacific tropical ocean then a positive central Pacific subtropical SLPa may trigger the appearance of La Niña a year later. This could fit well with the process of “the impact of ENSO events on ENSO cycle” we displayed here since along with the decrease of the heat content over WEP, lower/higher SST over WEP/EEP will mostly appear and persist in longer time. In this case, an additional positive AMC around dateline would be generated to form a La Niña event ten months to one year later. More interesting results would be found if one investigates the relationship in longer timescale between the upper ocean heat content over EEP (e.g., the index created by Meinen and McPhaden 2000) and ENSO formation. This needs to be studied in more depth in the future.
7. Conclusion
The results of the above statistical analysis can be summarized as follows:
The SST3DJFa is reasonably one of the best indicators to explore the anomalous Hadley circulation over the Pacific scope generated by ENSO events. The anomalous regional Hadley circulation would potentially play a role in strongly affecting the strength of the global Hadley circulation.
This anomalous Hadley circulation appearing with the AMC form is usually concentrated near the Pacific dateline, strongly stating from the matured ENSO and lasting 6–7 months, which is consistent with Bjerknes (1966, 1969), Oort and Yienger (1996) and provides a deeper understanding of the mechanism.
The AMC is one of the causes for the formation of the mirror sigma pattern that is the boundary line dividing opposite correlation or SLPa distribution because it results in the accumulation or reduction of the air mass around subtropical dateline regions, mainly from November (0) to April (+1) of the ENSO. The SLPa controlled by the westerlies would continue to expand into EEtP until August (+1).
The subtropical SLPa from the dateline to EEtP will play an essential role in reducing or reversing the primitive ENSO strength months later.
ENSO events can generate an ability to work on adjusting the ocean and atmosphere back to a neutral state. This physical process could complete through the combined operation of the Hadley cell and Walker circulation. ENSO may not be able to drive the ENSO cycle independently by this mechanism. However, the ENSO itself plays an important role in controlling the ENSO cycle.
8. Outlook
The discovery of the new role that ENSO plays in its cycle could deepen the understanding of ENSO formation and further improve the new ENSO theory proposed by Wang (2019).
The core of the new theory is that the lasting strong or weak eastern PSH as an external force away from the tropics may decide La Niña or El Niño occurrences. According to additional research, we reasonably believe that at least part of the external force might result from the newly discovered mechanism generated by the impact of ENSO itself. Since the anomalous global Hadley circulation can affect the PSH too, the long-lasting SLPa over EEtP might obtain a supplement beyond the Pacific Ocean except for the impact of the ENSO, which may lead to ENSO completing an operational cycle by taking a longer time. The complementary upstream SLPa may include pressure system eastward-moving or the teleconnection effects, and so on.
Data Accessibility Statement
All the data used are listed in the references, which are openly available at https://psl.noaa.gov/data/composites/datasets.html.
Notes
[1] This viewpoint is at https://www.cpc.ncep.noaa.gov/products/analysis_monitoring/ensostuff/ensofaq.shtml#HAPPENS
[3] Note that although the sample sizes of the lagged correlations are limited less than 24, the correlation tests have enough capacity to check if the relationship is meaningful. This is because (1) the relationship can be clearly explained by the results in Figures 2, 3, 9, 10, 11, (2) the composite data contain the information about 15 times of the sample size, (3) the time series has fully covered the period of mature to decay El Niño, during which the dominant signal of interest in this study exists, (4) the confidence level of the correlation coefficient is very high and (5) if the time sample size expands longer, the relationship will become weaker as we have tested.
Acknowledgements
We thank the editor for handling this paper and the anonymous reviewers for their valuable suggestions and comments.
Funding Information
This study was supported by the National Natural Science Foundation of China (No. 41575055).
Competing Interests
The authors have no competing interests to declare.