
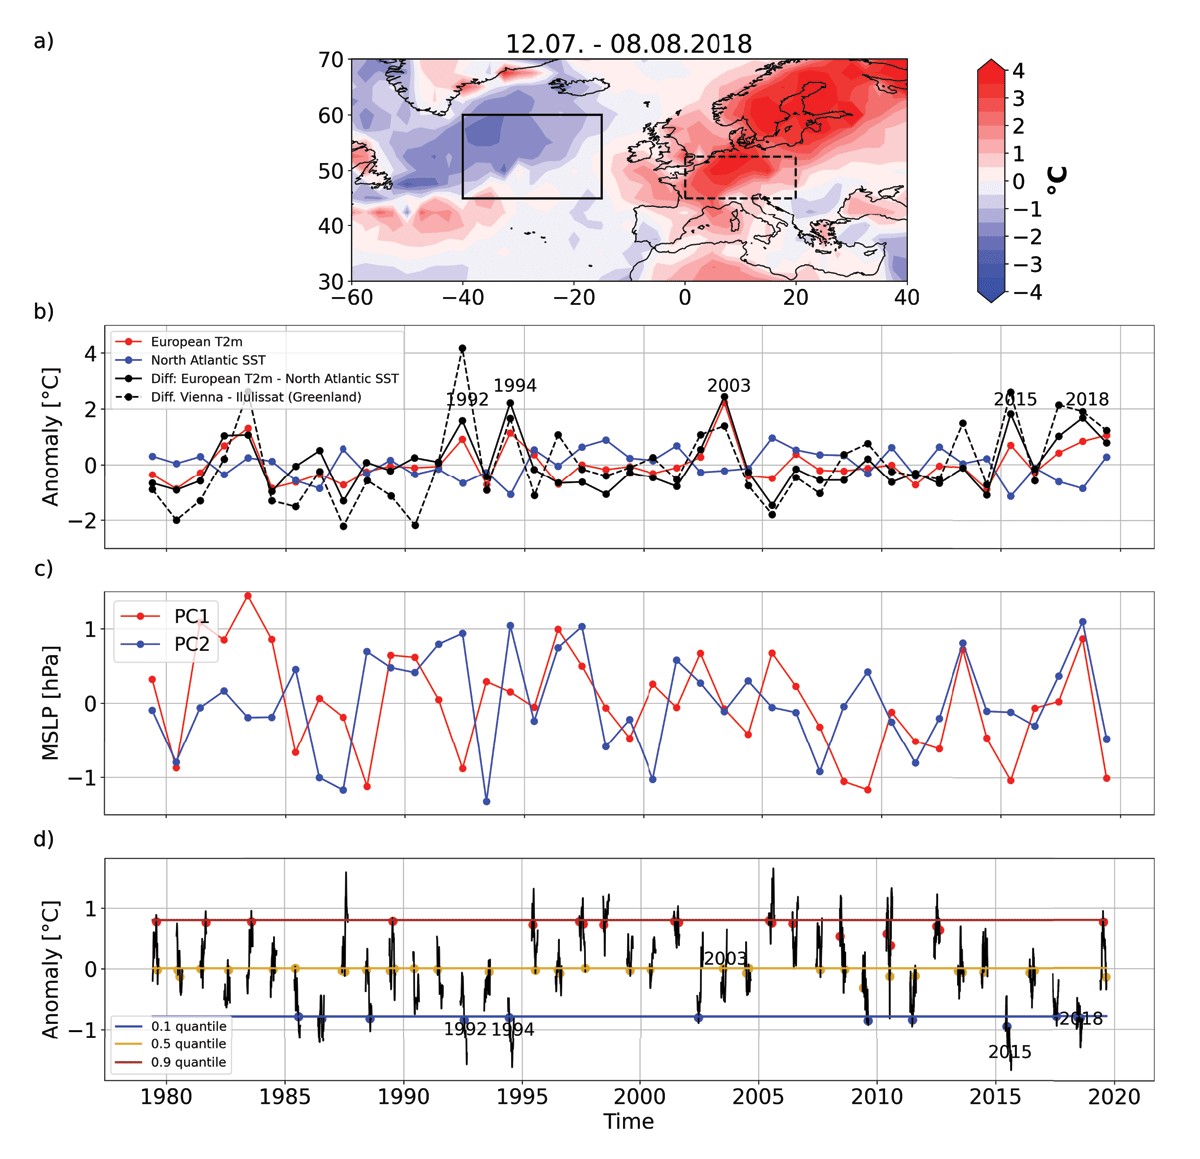
Figure 1
a) 12.07–08.08.2018 anomalies of SST (ocean) and T2m (continent) after removing daily climatology and linear trend from whole time series; North Atlantic box (15–40°W, 45–60°N) and European box (0–20°E, 45–52.5°N) used for subsequent average; b) Deseasonalised and detrended JJA mean values for North Atlantic (blue) and European box average anomalies (red) and difference (black); seasons of outstanding differences are highlighted; T2m anomaly difference between Vienna and Ilulissat (Greenland) representing the earlier SNAO defintion (dashed black); c) PC1 time series of the SNAO and PC2 time series of the SEA (see section 2.4); d) Deseasonalised and detrended daily JJA SST anomalies (black); quantiles (horizontal lines) and composite dates of events with negative tendencies of cold SSTs (blue dots), warm SSTs (red dots) and neutral SSTs (orange dots) as well as European heat event years highlighted; Composite dates of events with positive tendencies are not shown for visibility reasons.
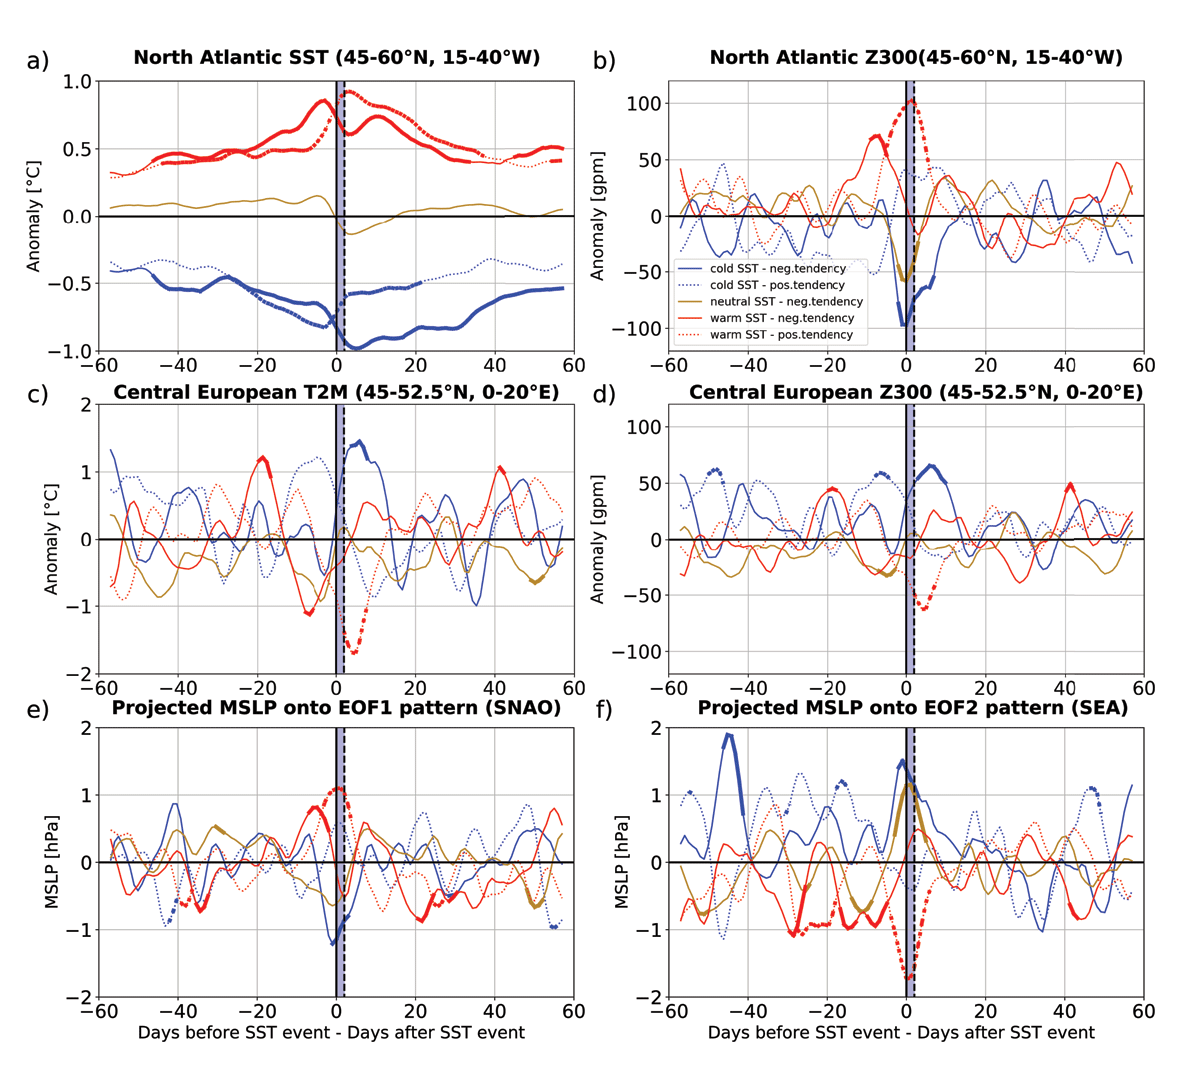
Figure 2
Evolution of cold SST events with negative tendency (solid – blue), with positive tendency (dashed – blue), neutral SSTs with negative tendency (solid – orange), warm SST events with negative tendency (solid – red), with positive tendency (dashed – red) relative to the respective onset date smoothed with a 5–day running mean; the composite mean is shown for a) North Atlantic SST anomalies (15–40°W, 45–60°N), b) North Atlantic Z300 anomalies (15–40°W, 45–60°N), c) European T2m anomalies (0–20°E, 45–52.5°N), d) European Z300 anomalies (0–20°E, 45–52.5°N), e) the projected MSLP data onto the EOF1 pattern (SNAO) scaled to unit variance, f) the same as e) but onto the EOF2 pattern (SEA) (see section 2.4); the light blue area highlights the required range of consecutive days (see section 2.2.1); a thicker line width indicates significance according to the 95% confidence interval based on the bootstrap method (see section 2.6).
Table 1
List of cold North Atlantic SST events with a negative tendency (box average: 45–60°N, 15–40°W) (12 events) and of European heat events (box average: 45–52.5°N, 0–20°E) (18 events); bold highlighted dates indicate a match between both parameters. The selection of cold North Atlantic SST events with a negative tendency and European heat events is described in section 2.2.1 and 2.2.2, respectively.
| COLD NORTH ATLANTIC SST EVENTS WITH A NEGATIVE TENDENCY | EUROPEAN HEAT EVENTS |
|---|---|
| 3 Aug 1985 | 9 Jul 1983 |
| 27 Jul 1986 | |
| 6 Aug 1988 | |
| 28 Jul 1992 | 7 Aug 1992 |
| 21 Jun 1994 | 27 Jun 1994 |
| 4 Aug 1994 | |
| 6 Jun 1996 | |
| 5 Jun 1998 | |
| 19 Jun 2002 | 16 Jun 2002 |
| 26 Aug 2009 | 10 Jun 2003 |
| 5 Jul 2011 | 03 Aug 2003 |
| 19 Jul 2006 | |
| 9 Jul 2010 | |
| 19 Aug 2012 | |
| 17 Jun 2013 | |
| 08 Jun 2014 | |
| 25 Jun 2015 | 1 Jul 2015 |
| 29 Jul 2017 | 26 Aug 2016 |
| 16 Jun 2018 | 19 Jun 2017 |
| 26 Jul 2018 | 24 Jun 2019 |
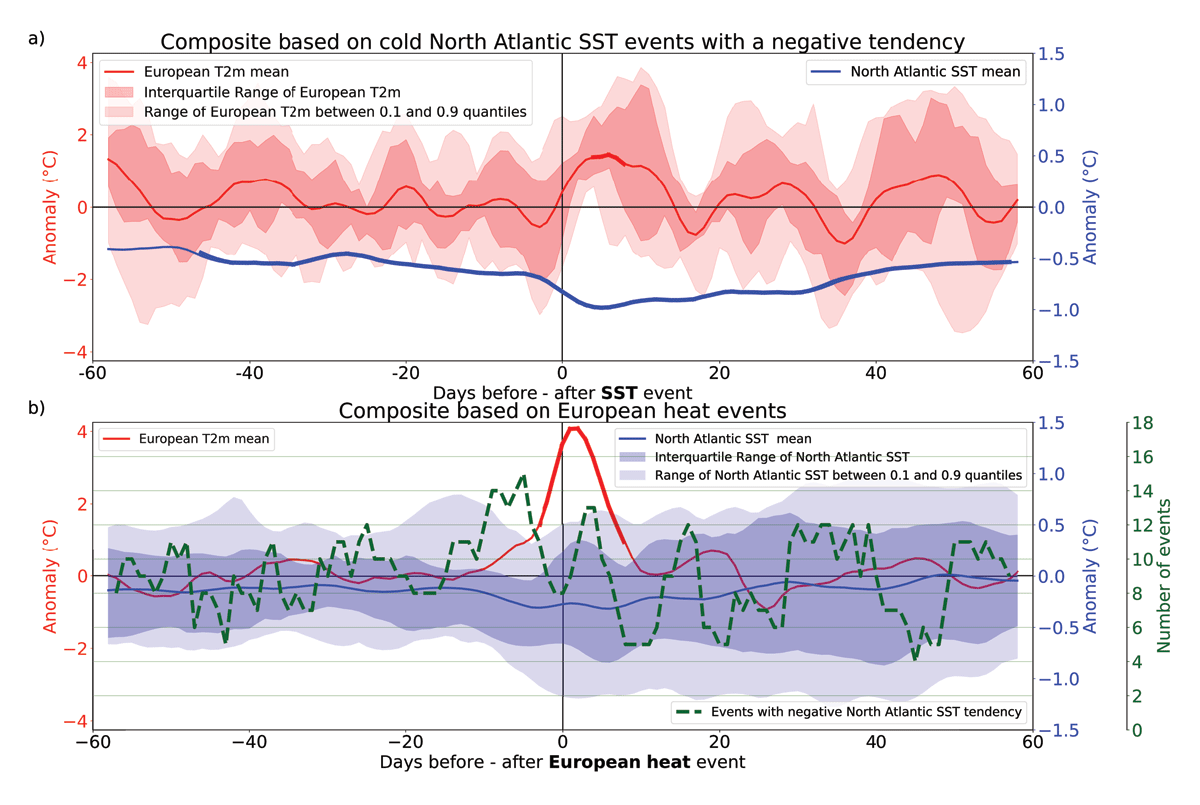
Figure 3
a) Composite based on 12 cold North Atlantic SST events with a negative tendency with composite mean of the North Atlantic SST anomaly (blue line – right y–axis); the associated European T2m anomaly and quantile ranges of these 12 events (red – left y–axis); b) Composite based on 18 European heat events with composite mean of the European T2m anomaly (red line – left y–axis); the associated North Atlantic SST anomaly, quantile ranges of these 18 events (blue – right y–axis) and the number of events with a negative North Atlantic SST tendency (dashed green line – offset y–axis); a thicker line width indicates significance according to the 95% confidence interval based on the bootstrap method.
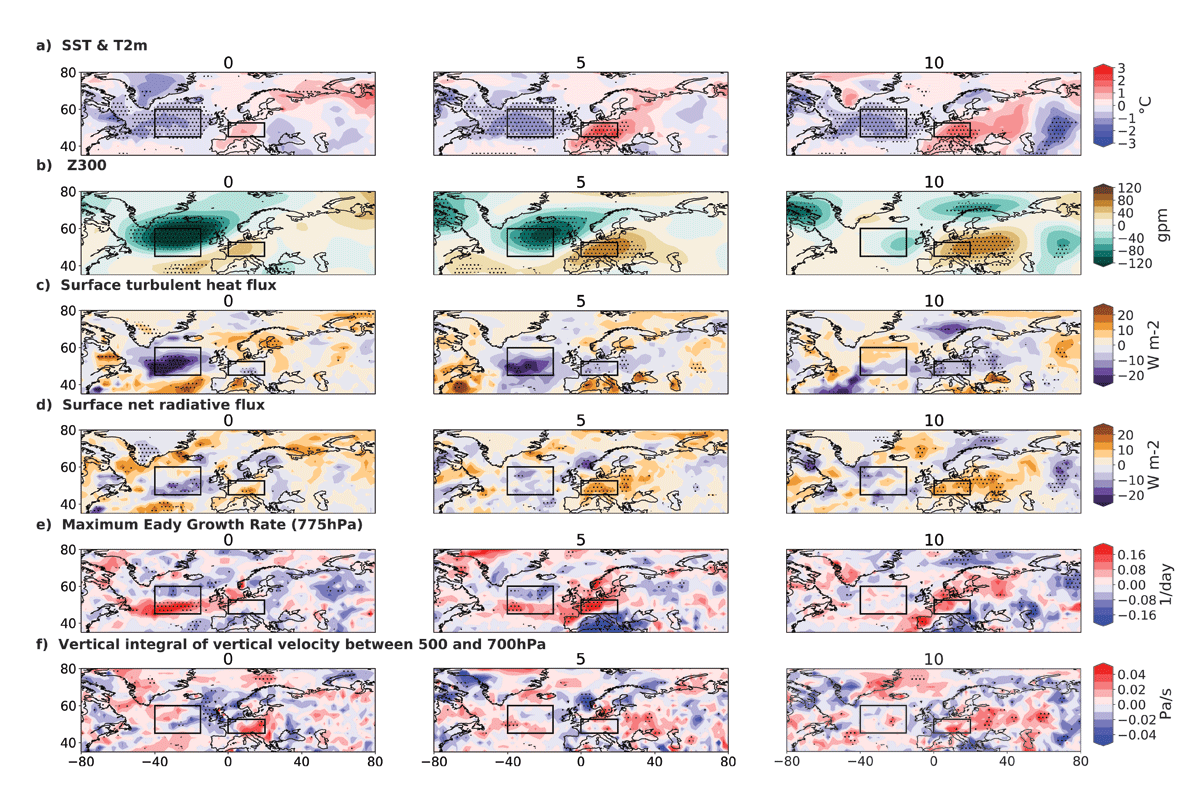
Figure 4
Maps of composite mean of anomalies of different parameters during (0) and 5, 10 days after cold North Atlantic SST events with a negative tendency; stippling indicates significance according to the 95% confidence interval based on the bootstrap method; the sign convention of the surface turbulent heat flux and surface net radiative flux is positive downwards, i.e., heat transfer is positive from the atmosphere to the ocean; negative values of the vertically integrated vertical velocity W indicate ascending air movement.
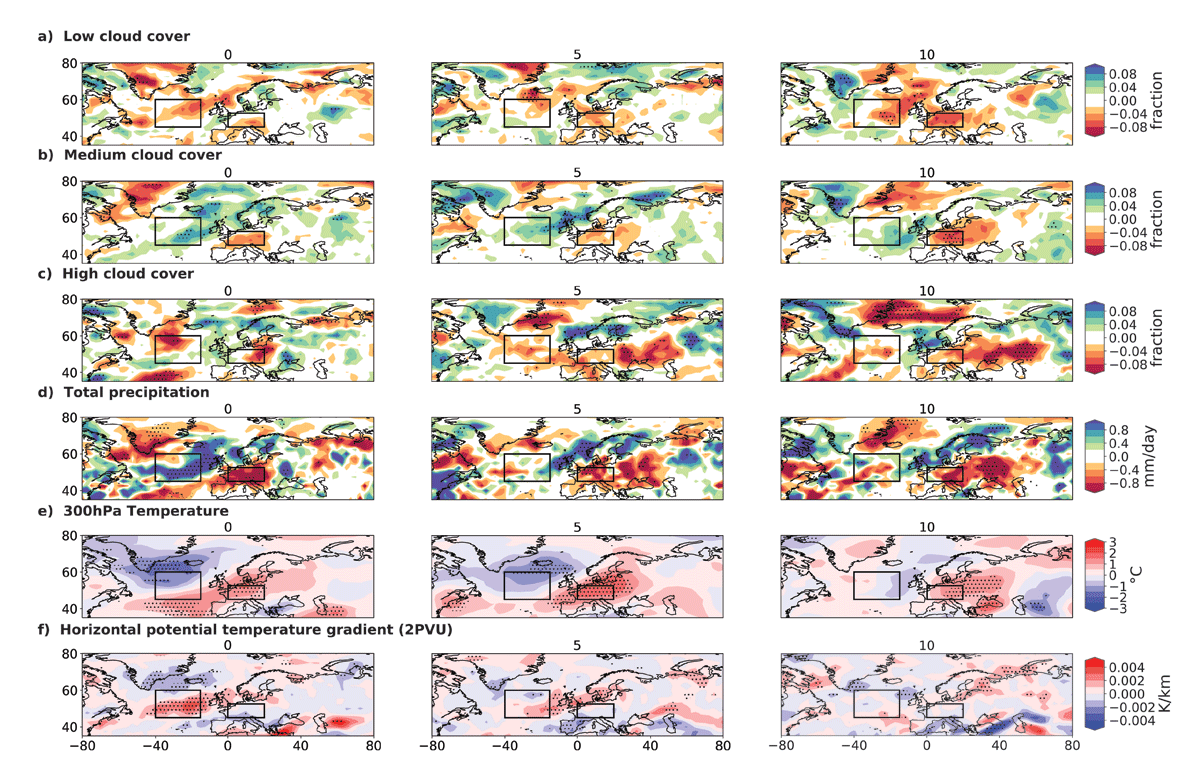
Figure 5
Same as Figures 4, but with different parameters; stippling indicates significance according to the 95% confidence interval based on the bootstrap method.
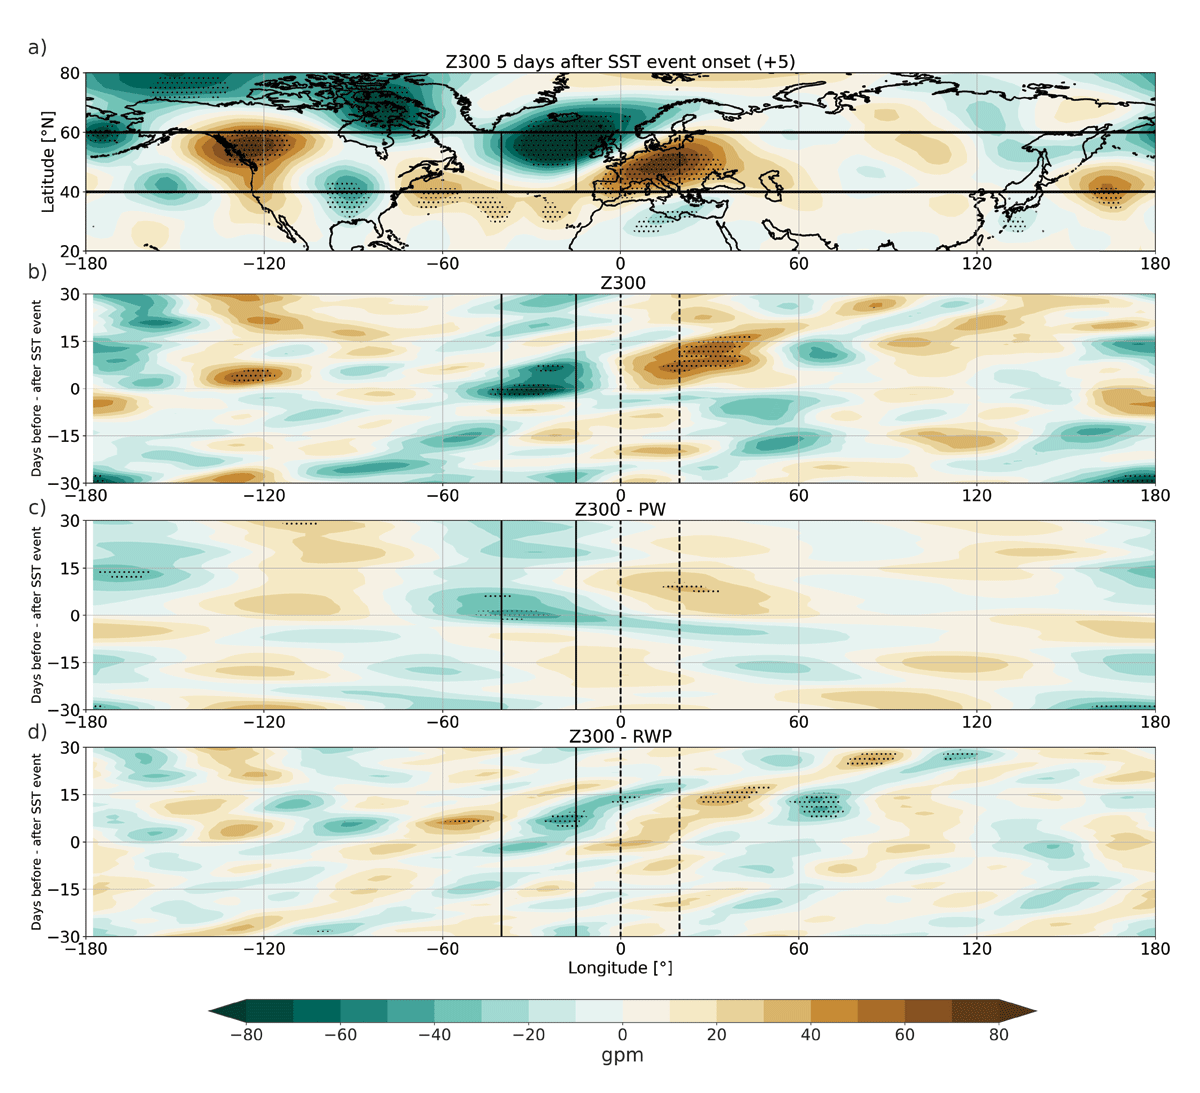
Figure 6
a) Map of full Z300 anomalies 5 days after the onset of a cold SST event with a negative tendency (enlargement of Figures 4b over all longitudes); b) Hovmöller diagram of full Z300 anomalies after a latitudinal average over 40–60°N (boundaries are shown as horizontal lines in a)); c) Same as b) but for PW filtered Z300 anomalies; d) Same as b) but for RWP filtered Z300 anomalies; solid vertical lines illustrate the longitude boundaries of the North Atlantic box (15–40°W) and dashed lines the boundaries of the European box (0–20°E); stippling indicates significance according to the 95% confidence interval based on the bootstrap method.