
1. Introduction
The European continent has experienced an increased number of notable heat events since the beginning of this century (Christidis et al., 2015; Coumou et al., 2013). Past heat events were responsible for severe impacts on the environment, e.g., fire hazards and water shortages as well as on society, e.g., agricultural losses, heat stress on human health and excess mortality (Sun et al., 2019; Miller et al., 2021). For instance, numerous authors reported on the well–known European heat event in 2003 (García-Herrera et al., 2010; Stott et al., 2004; Black et al., 2004; Fischer et al., 2007), which led to 70,000 deaths (Robine et al., 2008). Another heat event evolved in western Europe in late June 2015 and spread towards southern and eastern Central Europe (Duchez et al., 2016; Mecking et al., 2019; Dong et al., 2016). Prolonged heat event conditions affected large parts of Europe, centered over Scandinavia in the 2018 summer season (Kueh and Lin, 2020; Sinclair et al., 2019; McCarthy et al., 2019; Dunstone et al., 2019).
Heat events can generally evolve through dynamical and thermodynamical mechanisms (Suarez-Gutierrez et al., 2020). Among the dynamical mechanisms, the North Atlantic Oscillation (NAO) plays a key role as the dominant mode of atmospheric variability in the North Atlantic–European sector (e.g., Hurrell 1995). The summer NAO pattern (SNAO) is more contracted with its centre located further north than the winter NAO (Hurrell et al., 2003; Folland et al., 2009). The SNAO is the leading pattern of atmospheric variability in summer (Barnston and Livezey, 1987), but explains a smaller fraction of the observed summer variability than the NAO explains winter variability (Osborne et al., 2020). The summer East Atlantic pattern (SEA) as the second dominant mode is responsible for another significant proportion of observed variability during summer (Wulff et al., 2017; Ossó et al., 2018).
While the SNAO and the SEA are identified as stationary patterns using monthly or seasonal means, Rossby waves are propagating zonally in organized Rossby wave packets (RWPs) affecting the daily variability (Chang, 1993; Lee and Held, 1993; Wirth et al., 2018). Beside hemisphere-wide planetary wave patterns, RWPs are related to mid–latitude heat events (Fragkoulidis et al., 2018; Röthlisberger et al., 2016). For instance, a recurrence of transient RWPs was identified during the European heat event of 1994 (Röthlisberger et al., 2019) and the Russian heat event of 2010 (Pilch Kedzierski et al., 2020).
The soil–moisture feedback, where dry soil causes less evaporative cooling and thus a reduced latent and enhanced sensible heat flux has been found to be a major thermodynamic component for maintaining heat events (Black et al., 2004; Fischer 2007). An excessive drying of the soil was particularly important for leading the heat events of 2003 in Europe (Fischer et al., 2007) and 2010 in Russia (Hauser et al., 2016). Non–local turbulent heat fluxes may also be important for European heat events, as surface fluxes contribute to ascending airstreams in North Atlantic cyclones associated with diabatic heating. This in turn injects low potential vorticity into the upper troposphere, providing a source for amplifying an upper level ridge over Europe (Steinfeld and Pfahl, 2019; Steinfeld et al., 2020). This branch reaching from the North Atlantic surface into the upper troposphere over Europe can lead to anomalously high temperatures over Europe via subsidence (Zschenderlein et al., 2019; 2020).
North Atlantic SST has been shown to exert a stronger influence on the atmospheric circulation in summer compared to wintertime via a combination of dynamical and thermodynamical mechanisms (Ossó et al., 2018; Gastineau and Frankignoul, 2015; Osborne et al., 2020). North Atlantic SSTs can remotely or locally modify the intensity and duration of circulation patterns, e.g., on the SNAO (Brönnimann, 2007; Dong et al., 2013; Thomson and Vallis, 2018; Ionita et al., 2022) or on the SEA pattern (Gastineau and Frankignoul, 2015; Osborne et al., 2020; Wulff et al., 2017). Negative SST anomalies south of Greenland, for example, were observed during and prior to both the central European heat event in 2015 (Duchez et al., 2016) and the European heat event in 2018 (Mecking et al., 2019). In combination with an atmospheric trough–ridge pattern identified over the North Atlantic–European sector it raises the following questions: How are North Atlantic SSTs, European surface air temperatures and upper–tropospheric flow anomalies connected? Are the above mentioned cold North Atlantic SSTs in summer 2015 and 2018 a recurring feature during or prior to other past European heat events?
We address the above questions by searching for common features of multiple heat event occurrences, which differs from previous case–studies focusing on individual events (e.g., Duchez et al. (2016); Röthlisberger et al. (2019); Mecking et al. (2019); McCarthy et al. (2019)). We perform two composite analyses: the first is based on North Atlantic SSTs and the second on the European T2m. They are used to reveal the spatio–temporal relationship between anomalies of North Atlantic SSTs and European T2m and several other atmospheric variables.
2 Methodology
2.1. ERA5 reanalysis
This study is based on data from the ERA5 reanalysis product provided by the European Centre for Medium–Range Weather Forecasts (ECMWF) (Hersbach et al., 2020). We use the sea surface temperature (SST), the 2m–air temperature (T2m), mean sea level pressure (MSLP), 300hPa geopotential height and temperature (Z300, T300), surface heat fluxes (turbulent and radiative), total precipitation and cloud cover (low, medium, high). Further parameters, explained in section 2.3, also require the vertical velocity at 500, 600 and 700hPa isobaric levels, the temperature, geopotential height and the horizontal wind components at 700 and 850hPa levels and the potential temperature at the 2 Potential Vorticity Unit (2PVU) surface. We regrid the retrieved data onto a 2.5° longitude x 2.5° latitude grid using bilinear interpolation.
All data are daily means for the period 1979–2019, and our analysis is focused on summer, June–August. A linear trend is removed from daily anomalies of all data to avoid compositing more extreme heat episodes occurring later in the studied period. We also remove the 1979–2019 climatology from each day within the JJA season.
2.2. Composites
We perform a composite analysis to investigate the relationship between North Atlantic SST events and European heat events. The first analysis is based on 5 composites of different North Atlantic SST states. A second analysis involves a single composite based on European heat events (see Table A1). The details of the composite analysis are further described below.
2.2.1. Composites based on North Atlantic SST events
We average the SST over a North Atlantic box south of Greenland (15–40°W, 45–60°N) (Figure 1a) coinciding with the area used by Duchez et al. (2016), where the strongest negative anomalies are found during the European heat event of 2015. In the following, this North Atlantic SST box average is referred to as the North Atlantic SSTs.
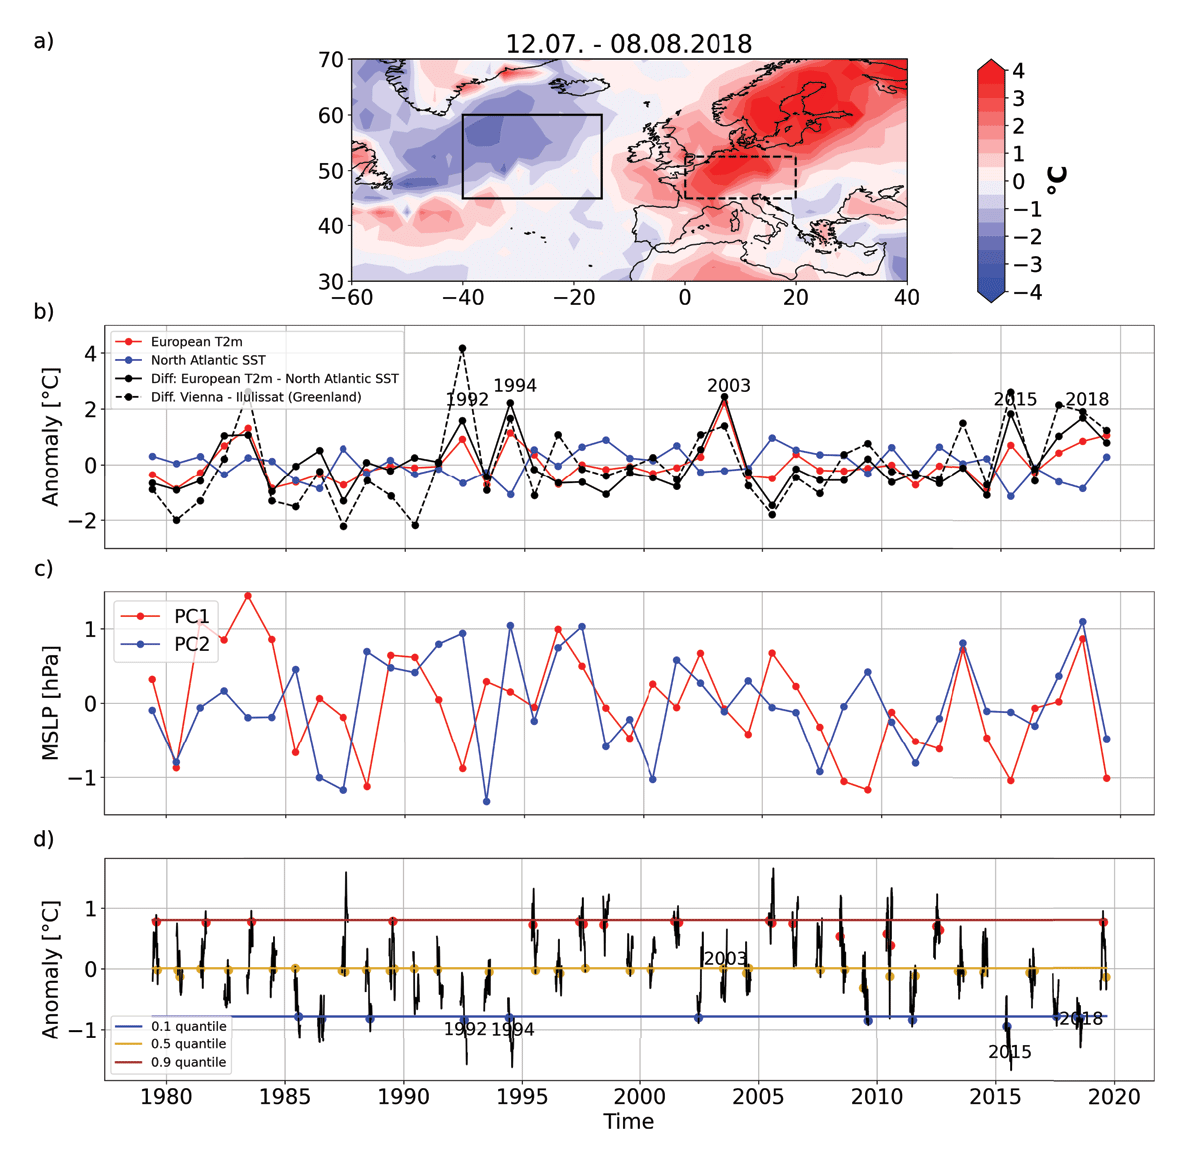
Figure 1
a) 12.07–08.08.2018 anomalies of SST (ocean) and T2m (continent) after removing daily climatology and linear trend from whole time series; North Atlantic box (15–40°W, 45–60°N) and European box (0–20°E, 45–52.5°N) used for subsequent average; b) Deseasonalised and detrended JJA mean values for North Atlantic (blue) and European box average anomalies (red) and difference (black); seasons of outstanding differences are highlighted; T2m anomaly difference between Vienna and Ilulissat (Greenland) representing the earlier SNAO defintion (dashed black); c) PC1 time series of the SNAO and PC2 time series of the SEA (see section 2.4); d) Deseasonalised and detrended daily JJA SST anomalies (black); quantiles (horizontal lines) and composite dates of events with negative tendencies of cold SSTs (blue dots), warm SSTs (red dots) and neutral SSTs (orange dots) as well as European heat event years highlighted; Composite dates of events with positive tendencies are not shown for visibility reasons.
We hypothesise that both the absolute North Atlantic SST state and a relative SST change might play a role for a subsequent shift of the European T2m anomalies. Thus, we separate events based on the sign of the tendency of North Atlantic SSTs. We further separate into cold and warm North Atlantic SST events by finding daily summer SST anomalies below the 0.1 or above the 0.9 quantiles, respectively. We thus get four classes of events with positive or negative SST anomalies and positive or negative tendencies. In order to inspect gradual changes among classes with a negative SST tendency but different absolute SST states, we also add a fifth class for neutral SST events with a negative tendency crossing the 0.5 quantile (median) of daily summer SST anomalies.
For the above mentioned 5 classes, we only collect the events which fulfill all following criteria regarding intensity (1), duration (2) and frequency (3), described here based on the example of cold SST events with a negative tendency:
We identify the first day on which the value falls below the 0.1 quantile as the start date.
The SST anomaly remains below the threshold for at least 3 consecutive days in order to eliminate short–lived anomalies.
The start dates of two events are at least 30 days apart in order to avoid overlap between events in the composites.
The classes with a positive tendency employ the same quantile thresholds, i.e. the 0.1 quantile for cold SST events and the 0.9 quantile for warm SST events. However, the values have to be above the respective threshold for criteria 1 and 2 (see Table A1). We do not specifically define a value for the tendency, as it would reduce the sample size, but still all 5 classes already show similar slopes with amplitudes between 0.3 and 0.5°C per week in the composite mean and all centered on the onset date (Figure 2a).
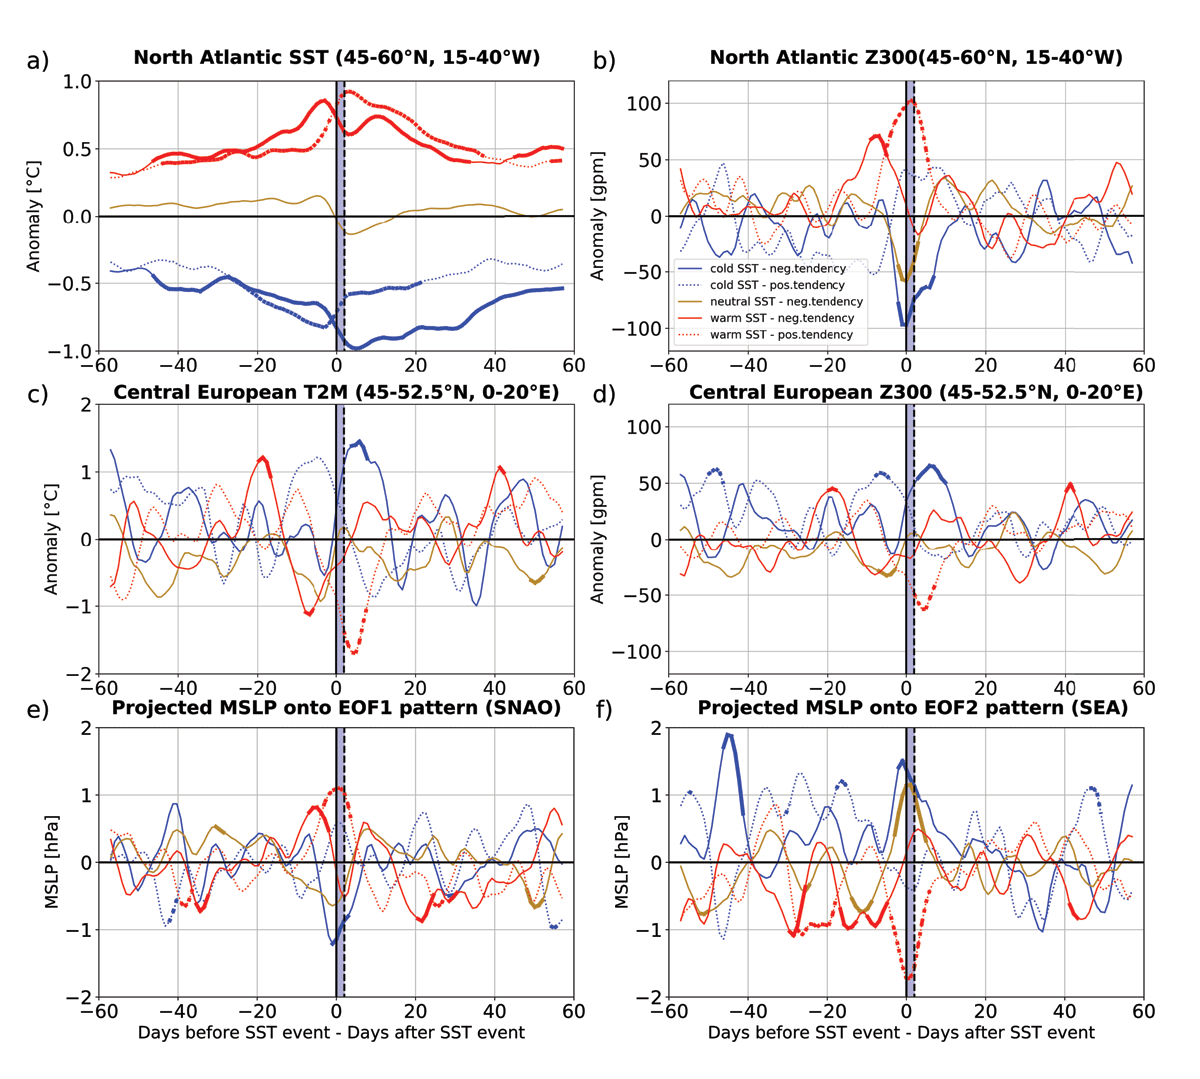
Figure 2
Evolution of cold SST events with negative tendency (solid – blue), with positive tendency (dashed – blue), neutral SSTs with negative tendency (solid – orange), warm SST events with negative tendency (solid – red), with positive tendency (dashed – red) relative to the respective onset date smoothed with a 5–day running mean; the composite mean is shown for a) North Atlantic SST anomalies (15–40°W, 45–60°N), b) North Atlantic Z300 anomalies (15–40°W, 45–60°N), c) European T2m anomalies (0–20°E, 45–52.5°N), d) European Z300 anomalies (0–20°E, 45–52.5°N), e) the projected MSLP data onto the EOF1 pattern (SNAO) scaled to unit variance, f) the same as e) but onto the EOF2 pattern (SEA) (see section 2.4); the light blue area highlights the required range of consecutive days (see section 2.2.1); a thicker line width indicates significance according to the 95% confidence interval based on the bootstrap method (see section 2.6).
We identify 12 events for cold North Atlantic SSTs with a negative tendency and another 12 events for a positive tendency, 35 events for neutral SSTs with a negative tendency, and 19 events for warm SSTs with a negative tendency and another 19 for a positive tendency. The dates for the respective cases with a negative tendency are shown in Figure 1d and the 12 events for cold North Atlantic SSTs with a negative tendency are listed in Table 1. We seek to analyse relevant meteorological variables based on the respective dates of the explained 5 composites. These parameters are smoothed by applying a 5–day running mean. The choice of the running mean has little to no impact on the results and conclusions. The anomalies of the parameters are smoothed, but the timing of the maxima and minima do not change after applying the filter (Figure A1).
Table 1
List of cold North Atlantic SST events with a negative tendency (box average: 45–60°N, 15–40°W) (12 events) and of European heat events (box average: 45–52.5°N, 0–20°E) (18 events); bold highlighted dates indicate a match between both parameters. The selection of cold North Atlantic SST events with a negative tendency and European heat events is described in section 2.2.1 and 2.2.2, respectively.
| COLD NORTH ATLANTIC SST EVENTS WITH A NEGATIVE TENDENCY | EUROPEAN HEAT EVENTS |
|---|---|
| 3 Aug 1985 | 9 Jul 1983 |
| 27 Jul 1986 | |
| 6 Aug 1988 | |
| 28 Jul 1992 | 7 Aug 1992 |
| 21 Jun 1994 | 27 Jun 1994 |
| 4 Aug 1994 | |
| 6 Jun 1996 | |
| 5 Jun 1998 | |
| 19 Jun 2002 | 16 Jun 2002 |
| 26 Aug 2009 | 10 Jun 2003 |
| 5 Jul 2011 | 03 Aug 2003 |
| 19 Jul 2006 | |
| 9 Jul 2010 | |
| 19 Aug 2012 | |
| 17 Jun 2013 | |
| 08 Jun 2014 | |
| 25 Jun 2015 | 1 Jul 2015 |
| 29 Jul 2017 | 26 Aug 2016 |
| 16 Jun 2018 | 19 Jun 2017 |
| 26 Jul 2018 | 24 Jun 2019 |
2.2.2. Composite based on European heat events
We also perform a second composite analysis but now based on European heat events by using a European box average (45–52.5°N, 0–20°E). Here, the focus is solely on a single composite which consists of the European heat events. Therefore, we use the same three criteria as used for the composites based on the North Atlantic SST events above, except for the quantile threshold. Here, we seek to extract events which have a more extreme intensity criterion, still considering a sufficient sample size for the analysis. Thus, a European heat event is defined as the first day on which the daily T2m anomaly of the European box is above the 0.95 quantile threshold (see Table A1). We identify 18 European heat events and their onset dates are given in Table 1.
Here, the associated North Atlantic SST is again smoothed by applying a 5–day running mean. Note that generally the data is not smoothed before the selection of the events, neither for the SST data in the composites based on North Atlantic SST events analysis nor for the T2m data in the composite based on European heat events.
2.3. Derived variables
We estimate the mid–tropospheric vertical velocity, the Maximum Eady Growth Rate and the horizontal potential temperature gradient as follows.
2.3.1. Vertical integral of vertical velocity
We calculate the integral W of the vertical velocity w between 700 and 500hPa based on three different levels, i.e. dw = 100hPa:
2.3.2. Maximum Eady Growth Rate
The Maximum Eady Growth Rate (EGR) is based on the Eady Model and is a measure to assess baroclinic instability (Hoskins and Valdes, 1990). The EGR is defined as follows:
where f is the Coriolis parameter, is the magnitude of the horizontal wind, Z is the geopotential height and N is the static stability parameter (where , g being the gravity acceleration, z the vertical coordinate and θ the potential temperature). We compute the EGR between the 850 and 700hPa levels. Thus, we obtain values on the 775hPa level in agreement with the level used by Athanasiadis et al. (2022) and in close agreement with Hoskins and Valdes (1990), who presented results at about 780hPa.
2.3.3. Horizontal potential temperature gradient
By assuming an adiabatic and frictionless flow, the potential temperature θ at the dynamical tropopause can be used to diagnose dynamical features such as the potential for the propagation of Rossby waves (Hoskins et al., 1985). The dynamical tropopause is most commonly defined at the 2 Potential vorticity unit (PVU) surface (e.g., Holton et al. (1995)). To better constitute favourable regions of Rossby wave propagation (Woollings et al., 2022), the horizontal gradient of θ at the 2PVU surface is calculated:
2.4. EOF analysis
Dominant weather regime patterns are identified by conducting an EOF analysis based on daily MSLP anomalies in the North Atlantic–European domain according to Folland et al. (2009). The first EOF pattern, classified as the SNAO pattern, appears very similar to the pattern identified in Folland et al. (2009) apart from a slight westward shift (not shown). We identify the SEA pattern as the second EOF pattern, which is in agreement with the pattern found by Wulff et al. (2017) (not shown). We use the associated July–August mean principal components, PC1 and PC2, as indices for the SNAO and SEA respectively (Figure 1c).
Additionally we project the full daily MSLP data set onto the SNAO and the SEA fields. The resulting ‘pseudo’ PC1 and PC2 timeseries are again used for the composite analysis to elaborate on the role of the modes in the 5 composites of North Atlantic SST events (Figure 2e,f).
2.5. Wave filtering
To study anomalies in midlatitude waves (section 5.2), we first perform a fast Fourier transform (FFT) in longitude for the absolute Z300 values. Subsequently, we decompose it into contributions of planetary waves (PW) defined as zonal wave numbers 1 to 3 and synoptic–scale Rossby wave packets (RWP) defined as intermediate wave numbers 4 to 15, a range typically used in previous studies (Wirth et al., 2018; Zimin et al., 2003; Wolf and Wirth, 2017). Such wave analysis captures nearly all day–to–day variability and allows spatial propagation of signals, while selecting a few principal components, e.g., the SNAO, does not account for all variability, apart from obtaining a static pattern in space.
2.6. Significance
We use the bootstrap method for testing the significance of our results, as this method is ideal for small samples (Fisher and Hall, 1991). We draw 1000 samples from all daily summer (JJA) values between 1979 and 2019, each with the sample size that equals the number of events within the respective composite to be tested (see listing below).
12 events for the composites of cold North Atlantic SST with a negative or positive tendency
35 events for the composite of neutral SST events with a negative tendency
19 events for the composites of warm North Atlantic SST with a negative or positive tendency
Results are significant if the composite mean falls within one of the 2.5% tails of the distribution of 1000 bootstrap sample means (95% confidence interval). For testing the significance of the composite of 18 European heat events, we again create a distribution of 1000 bootstrap sample means, however, with each sample having a size of 18 T2m events.
3. Statistical Relationship between North Atlantic SSTs and European T2m
The European heat events in 2015 and 2018 provide examples of positive T2m anomalies over Europe associated with cold SST anomalies over the North Atlantic ocean (Figure 1). The North Atlantic SST anomalies reached negative values of up to –2.5°C, particularly in the period between 12 July to 08 August 2018, while Scandinavia and central Europe recorded T2m anomalies with values of up to +4°C (Figure 1a).
Before examining the relationship on the daily scale, we find that the seasonal–mean (JJA) time series of European T2m and North Atlantic SST anomalies appear anti–correlated. (Figure 1b). The difference time series ΔT = T2m – SST exhibits a positive correlation with an early SNAO index based on the temperature difference between Ilulissat and Vienna identified by Hann (1890) with R=+0.75 (p–value < 0.001). Prominent heat event years (1992, 1994, 2003, 2015, 2018) expose a large difference ΔT. We note that the large ΔT in 2003 is mostly caused by a strong positive T2m anomaly and a very small negative North Atlantic SST anomaly.
Large ΔT may be related to a dominant mode of variability during summer. Our EOF–based index of SNAO shows a positive phase during the summer of 2018 (Figure 1c), consistent with the positive temperature anomaly pattern over Scandinavia (Figure 1a). The negative SNAO phase appears in 1992 and 2015. The SEA shows a preference for the positive phase during summers of 1992, 1994, 2018. No particular phase of the two modes is present during the high summer season 2003. In general, neither PC1 or PC2 is largely consistent with the large ΔT identified in Figure 1b. As some heat events only last for a few weeks their signal may be suppressed in seasonal means. Daily values of PC1 and PC2 will be discussed in section 4.1.
A more detailed examination of the temperature contrast between the North Atlantic and Central Europe is undertaken by turning to the daily JJA values and the composites based on North Atlantic SST events described in section 2.2.1. The events of the composites with warm, neutral and cold SST events respectively, and a negative SST tendency in all three cases are shown in Figure 1d. We note that 5 of 12 cold SST events with a negative tendency lie within 1985 to 1995 and only 2 events are detected within 1995–2010. The composite of warm SSTs with a negative tendency reveals 2 of 19 events identified within 1985 to 1995 and 11 events within the subsequent 15–year period. Such a temporally uneven distribution with a shift from a higher frequency of cold SST events to a higher frequency of warm SST events at around 1995 is consistent with the change from a cold to a warm phase of the Atlantic multi–decadal variability (AMV) at the same time (Sutton and Hodson, 2005). The identification of events is insensitive to detrending the data as the linear trend over our North Atlantic region is very small in the period from 1979 to 2019.
The aforementioned years of large ΔT (1992, 1994, 2003, 2015, 2018) all contribute with at least one event to the composite of cold North Atlantic SSTs with a negative tendency, except for the heat event in 2003, where we find a large positive T2m anomaly but a weak negative North Atlantic SST anomaly.
Table 1 illustrates the events of cold North Atlantic SSTs with a negative tendency and European heat events. A temporal correspondence between events of the two composites is identified in 4 cases, without having applied a specific criterion for the temporal correspondence. For the SST events in 1992, 1994 and 2015 we obtain a matching European heat event 6 to 10 days later. In 2002, there is a date matching as well, but the start date of the SST event occurs 3 days after the European heat event. Nevertheless these dates might not be unrelated to each other, as there may have been a cooling of North Atlantic SSTs prior to the start date of the European heat event, but the North Atlantic SST is crossing the 0.1 quantile threshold afterwards.
We identify a hint towards a temporal correspondence between extremes on both sides, however, a statistical value is not added at this stage of the study. Now we seek a more general spatio–temporal relationship between the North Atlantic SST and central European T2m anomalies of the composites using a lead–lag analysis and adding the bootstrap method for indicating significance.
4. Composite Analysis
The 5 composites of different North Atlantic SST events (see Table A1) are discussed in section 4.1. Another single composite based on European heat events is analysed in section 4.2.
4.1. Composites based on North Atlantic SST events
For completeness and for the purpose to check whether SST anomalies of opposite sign are linked to T2m anomalies of opposite sign as well, we analyse the composites of all 5 classes of North Atlantic SST events defined in section 2.2.1.
We display the temporal evolution of North Atlantic SST (Figure 2a), European T2m (Figure 2c) and Z300 anomalies over both the North Atlantic (Figure 2b) and Europe (Figure 2d) for the composite mean of all 5 classes, respectively. Note that the applied 5–day running mean (section 2.2.1) does not change the timing of a maximum or a minimum, when comparing the results to data without the 5–day running mean applied (Figure A1).
All 5 composites experience SST tendencies of +/– 0.3–0.5°C per week starting prior to the onset date at lag = 0 (Figure 2a). The North Atlantic Z300 reveals robust negative anomalies, indicating a North Atlantic trough, with a peak value of –100 gpm occurring shortly before the negative SST tendency of cold North Atlantic SSTs (Figure 2a,b), which implies that the negative SST tendency is driven by an overlying atmospheric trough.
All 3 composites of negative SST tendencies show a negative Z300 tendency over the North Atlantic before lag = 0, developing trough conditions in the composite of cold and neutral North Atlantic SSTs or diminishing ridge conditions in the composite of warm North Atlantic SSTs (Figure 2b). From the composites with a positive SST tendency the case of warm SST events indicates a North Atlantic ridge around lag = 0.
Only the composite of cold SSTs with a negative tendency reveals a significant central European temperature maximum a few days after lag = 0 (Figure 2c) (see also Figs. A3 and A4). The central European Z300 anomalies co–vary with the European T2m anomalies, exhibiting significant positive T2m anomalies of almost +1.5°C for roughly one week together with Z300 anomalies of +60 gpm, building up a ridge over central Europe (Figure 2c,d). These results are consistent with our previous findings that some European heat events occur a few days after cold North Atlantic SST events with a negative tendency (Table 1), but these results now include non–extreme positive European T2m anomalies too.
By projecting the full daily MSLP data set onto the EOF1 and EOF2 pattern, we obtain a preference for the negative SNAO phase (Figure 2e) and the positive SEA phase (Figure 2f) in the case of cold North Atlantic SSTs with a negative tendency. The identified trough–ridge pattern resembles the positive SEA phase well, however, the positive SEA phase (Figure 2f) loses significance before lag = 5, while the European ridge signal (Figure 2d) peaks at lag = 6. The explanation of the trough–ridge pattern using the SNAO or SEA patterns is not sufficient, as the development of the European ridge follows the formation of the North Atlantic trough. This suggests a non–stationary pattern, which is why we perform a wave decomposition in section 5.2 that allows the detection of propagating waves.
The composite of cold North Atlantic SST events with a negative tendency exhibits the largest and most robust anomalies in North Atlantic Z300, European Z300 and European T2m of all 5 composites based on North Atlantic SSTs. We thus focus on this specific composite in the following comparison with the composite based on European heat events.
4.2. Comparison with composite based on European heat events
In addition to the previously described composite based on cold North Atlantic SSTs with a negative tendency, we now add a composite based on 18 European heat events (Figure 3). The selection of European heat events is described in section 2.2.2.
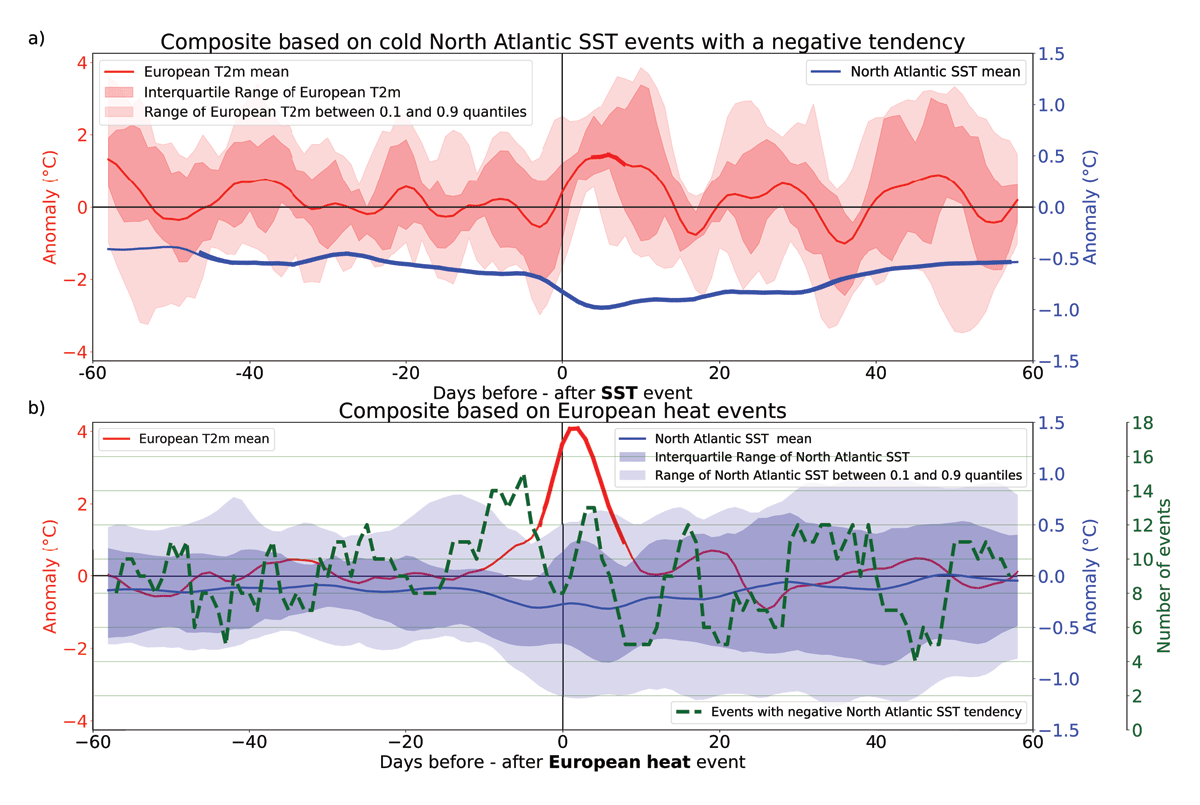
Figure 3
a) Composite based on 12 cold North Atlantic SST events with a negative tendency with composite mean of the North Atlantic SST anomaly (blue line – right y–axis); the associated European T2m anomaly and quantile ranges of these 12 events (red – left y–axis); b) Composite based on 18 European heat events with composite mean of the European T2m anomaly (red line – left y–axis); the associated North Atlantic SST anomaly, quantile ranges of these 18 events (blue – right y–axis) and the number of events with a negative North Atlantic SST tendency (dashed green line – offset y–axis); a thicker line width indicates significance according to the 95% confidence interval based on the bootstrap method.
The composite of cold North Atlantic SSTs with a negative tendency shows, on average, positive European T2m anomalies up to lag = 14 (Figure 3a). Apart from the significance based on the bootstrap method, we also demonstrate robustness: 90% of events, i.e., 11 out of 12, show positive European T2m anomalies following a cold North Atlantic SST event with a negative tendency. Only a single event (in 1985) reveals negative T2m anomalies. Here, a trough spreading from the North Atlantic into Europe was present 5 days after the negative SST tendency in August 1985 (Figure A2a). We note that the event in 1985 did have a European warm event, but shifted to northwest Russia and thus outside our area of study.
The composite mean of 18 European heat events shows that the European T2m anomaly peaks with +4°C 2 days after the 0.95 quantile was exceeded (Figure 3b). The majority, i.e., 14 of 18 heat events, are accompanied by below–average North Atlantic SSTs already 5 days before the onset of a European heat event. At the same time we observe a negative tendency in 15 of 18 events. Although the North Atlantic SST signal is non-significant and characterized by small anomalies, still, the majority of the European heat events exhibits both negative anomalies and negative tendencies in North Atlantic SSTs, in agreement with our findings from the composite based on cold North Atlantic SST events with a negative tendency.
5 Linking North Atlantic SST Anomalies to Large–Scale Flow
After showing the statistical relationship, we now try to link the North Atlantic SST anomalies to the atmospheric large–scale flow, inferring dynamic and thermodynamic processes.
5.1. Spatial evolution of several atmospheric variables
The chronology of cold North Atlantic SST events with a negative tendency is shown by computing composite means of several variables at lags 0, 5 and 10 days (Figures 4 and 5).
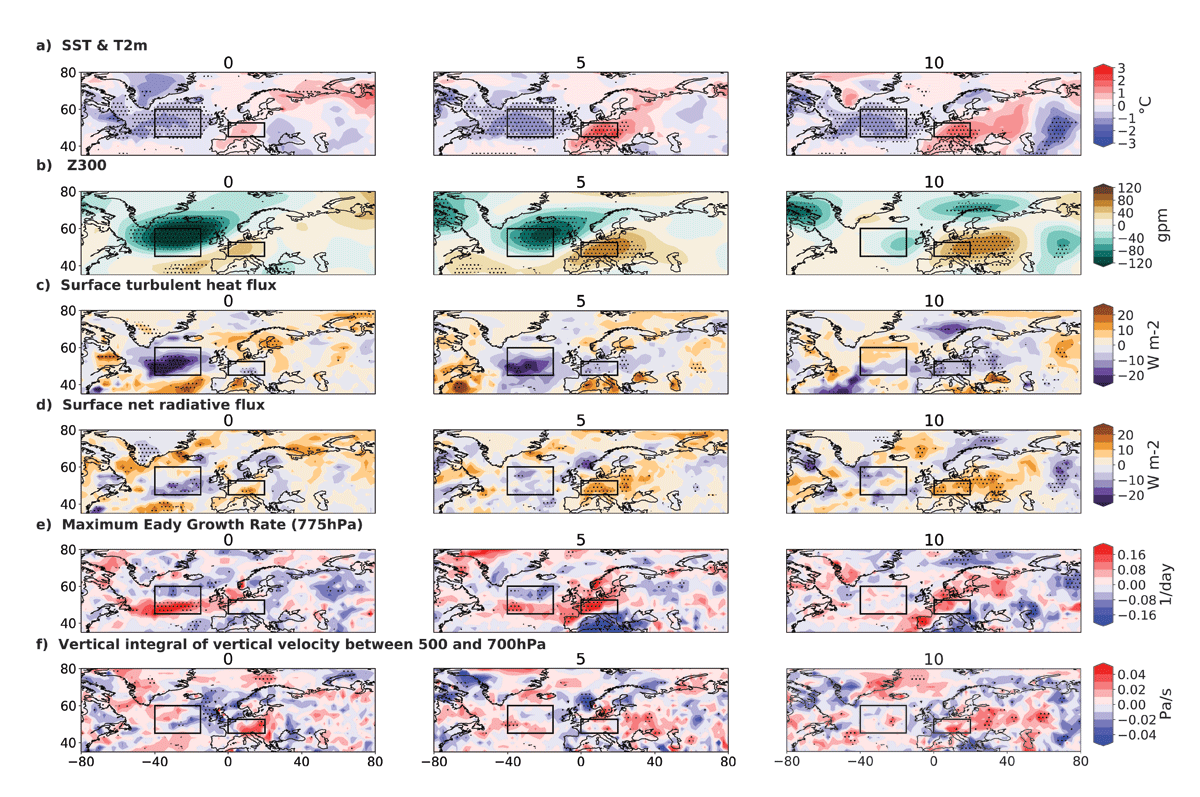
Figure 4
Maps of composite mean of anomalies of different parameters during (0) and 5, 10 days after cold North Atlantic SST events with a negative tendency; stippling indicates significance according to the 95% confidence interval based on the bootstrap method; the sign convention of the surface turbulent heat flux and surface net radiative flux is positive downwards, i.e., heat transfer is positive from the atmosphere to the ocean; negative values of the vertically integrated vertical velocity W indicate ascending air movement.
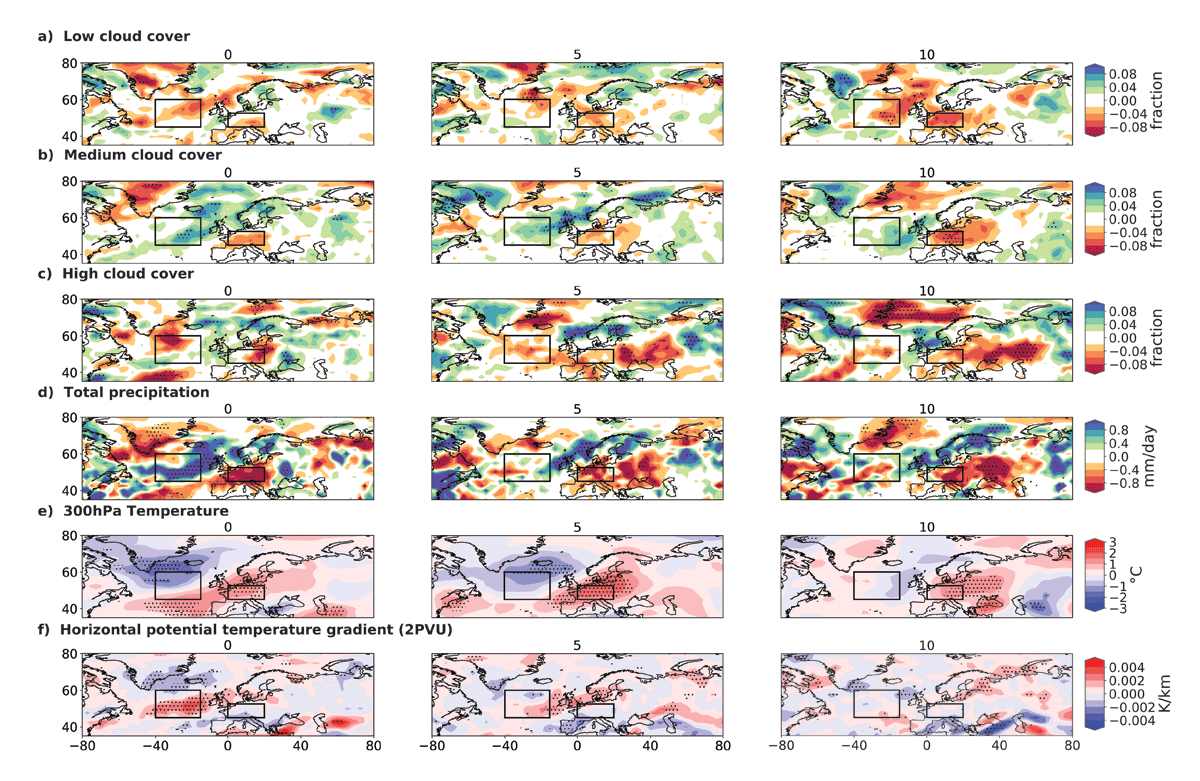
Figure 5
Same as Figures 4, but with different parameters; stippling indicates significance according to the 95% confidence interval based on the bootstrap method.
A widespread pattern of negative North Atlantic SST anomalies is present in the eastern North Atlantic with the negative tendency centered at lag = 0 (Figure 4a). A well–established trough over the North Atlantic is also present at lag = 0 (Figure 4b). Positive Z300 anomalies emerge over central Europe at lag = 5 leading to an overall trough–ridge pattern in the North Atlantic–European sector. As the European ridge intensifies, positive T2m anomalies begin to form over central Europe in 11 out of 12 events, followed by a shift of the European ridge and positive T2m anomalies towards eastern Europe at lag = 10.
A noticeable anomaly of the surface turbulent heat flux is found over the North Atlantic at lag = 0 and lag = 5 (Figure 4c), which is mainly caused by an intensified upward latent heat flux (not shown). These anomalies of more than 20 Wm-2 might be driven by advection of cold and dry air masses, which induce the cooling of the ocean. The surface net radiative flux reaches values locally of up to 20 Wm-2 over central Europe (Figure 4d) at lag = 5 and lag = 10. This net surface heating over central Europe through enhanced incoming solar radiation (not shown) is amplified through contributions of turbulent heat fluxes, though with a smaller magnitude (~5 Wm–2) (Figure 4c).
The EGR at 775hPa, as a measure of how well a trough can develop (Hoskins and Valdes, 1990), show a band of positive anomalies in the North Atlantic at 50°N latitude at lag = 0 and lag = 5, which is likely a response of the intensification of the trough in the lower troposphere (Figure 4e). Anomalous vertical velocity, here diagnosed by the vertically integrated velocity W between 500 and 700hPa, show strong upward velocities near the British Isles of up to –0.05 Pa/s at lag = 0 (Figure 4f), associated with a change in the cloud cover type. The eastern North Atlantic reveals a decline in the low cloud cover of up to 8% at lag = 0, 5, 10, while the medium cloud cover fraction is increasing with values of up to 8% (Figure 5a,b). In addition, we identify positive high cloud cover anomalies over the British Isles and towards the southwestern corner of the North Atlantic box at lag = 0, though non–significant and with a slightly lower magnitude (Figure 5c).
We also note a band of precipitation anomalies from Newfoundland to the British Isles (Figure 5d), likely related to frontal systems. The upper level temperature anomalies support the existence of strong southwesterly winds (Figure 5d) and a positive and significant upper level temperature anomaly is identified over Europe with values of +2°C (Figure 5e). We note that the anomalies in cloud cover and precipitation, the upward vertical velocity in the mid–troposphere, southwesterly wind anomalies, and the upper–level heating over Europe, all suggest a slantwise ascent of moist air over the North Atlantic which has been linked to the development of a ridge over Europe (Zschenderlein et al., 2020).
This composite of cold North Atlantic SST events with a negative tendency suggests a coherent chain of anomalies shown in Figures 4 and 5 and described as follows. Initially, a cyclonic anomaly in the atmospheric circulation passes the already cold SSTs south of Greenland. The cyclonic anomaly is capable of developing into a strong and persistent North Atlantic trough that induces an enhanced upward turbulent heat flux contributing to a further cooling of the ocean to the west and to an ascending air movement and a precipitation band to the east. Subsequently, the anomalous circulation field extends towards Europe as a pronounced ridge develops, which favours positive T2m anomalies of up to +3°C. The warm T2m anomalies probably emerge through a combination of advection and subsidence, a reduced total cloud cover and increased incoming solar radiation over Europe. Surface turbulent heat fluxes over Europe contribute to an intensification of the European surface heat conditions. This can be shortly summarized as below:
Persistent cold North Atlantic SST anomaly
Appearance of atmospheric cyclonic anomaly over the North Atlantic
Negative SST tendency and ocean heat loss
Reinforced and more persistent North Atlantic trough
Advection and subsidence contribute to European ridge development and surface temperature increase
The composite of neutral SST events with a negative tendency also shows the presence of enhanced upward turbulent heat fluxes, again likely induced by the Z300 minimum (Figure A5b,c). In contrast to the composite of cold SSTs with a negative tendency, we identify no indication for a strong central European ridge and heat event in this composite (Figure A5a,b). The composite of warm SST events with a negative tendency has neither a North Atlantic trough nor a central European ridge or heat event signal (Figure A6a,b). Thus, the above mentioned sequence of processes predominantly develops under the presence of cold North Atlantic SSTs. The role of the persistent cold SSTs can be understood as preconditioning rather than predicting or driving this sequence of processes, i.e. a passing atmospheric cyclonic anomaly has a higher potential to persist, amplify and to initiate the above mentioned sequence of processes. Systematic testing of this finding can be done using climate models, and will be the topic for future studies.
The development of the European ridge in the composite of cold SST events with a negative tendency can be described by a wave development. The North Atlantic trough intensification leading to positive EGR anomalies at 775hPa (Figure 4e) can be complemented by anomalies of the horizontal potential temperature gradient at the 2PVU surface (Figure 5f). serves as a measure for waveguidability. There is no universal definition for the term ‘waveguide’, however, a ‘waveguide’ commonly refers to a low-pass filtered or time-averaged state to describe the background flow (Wirth et al., 2018). To examine the waveguidability in our study we refer to the 5-day running mean applied to .
A significantly zonally orientated band of positive anomalies at 50°N latitude at lag = 0 indicates an enhanced waveguide at the tropopause, enabling downstream wave development. This anomaly pattern moves eastward as the European ridge develops. These characteristics are only present under persistently cold North Atlantic SSTs, as the composites of neutral and warm SST events with a negative tendency indicate neither a significant North Atlantic trough intensification (Figs. A5e and A6e) nor a strongly enhanced waveguide (Figs. A7f and A8f).
The presence of the waveguide during events of cold North Atlantic SSTs with a negative tendency encourages to disentangle whether planetary–scale waves, locally amplified waves or a combination of both are eventually present.
5.2. Wave decomposition
Z300 values are separated and anomalies are calculated for both the contribution of planetary waves (PW; wave number 1 to 3; Figure 6c) and Rossby wave packets (RWP; wave number 4 to 15; Figure 6d). The full Z300 data displays negative anomalies of up to –80 gpm in the eastern North Atlantic, whereas positive anomalies of up to +80gpm are present over central and eastern Europe at lag = 5. Z300 anomalies of +/– 60–70 gpm occur further upstream near the Labrador Sea, whereas anomalies over Asia reach only values of +/– 20 gpm (Figure 6a).
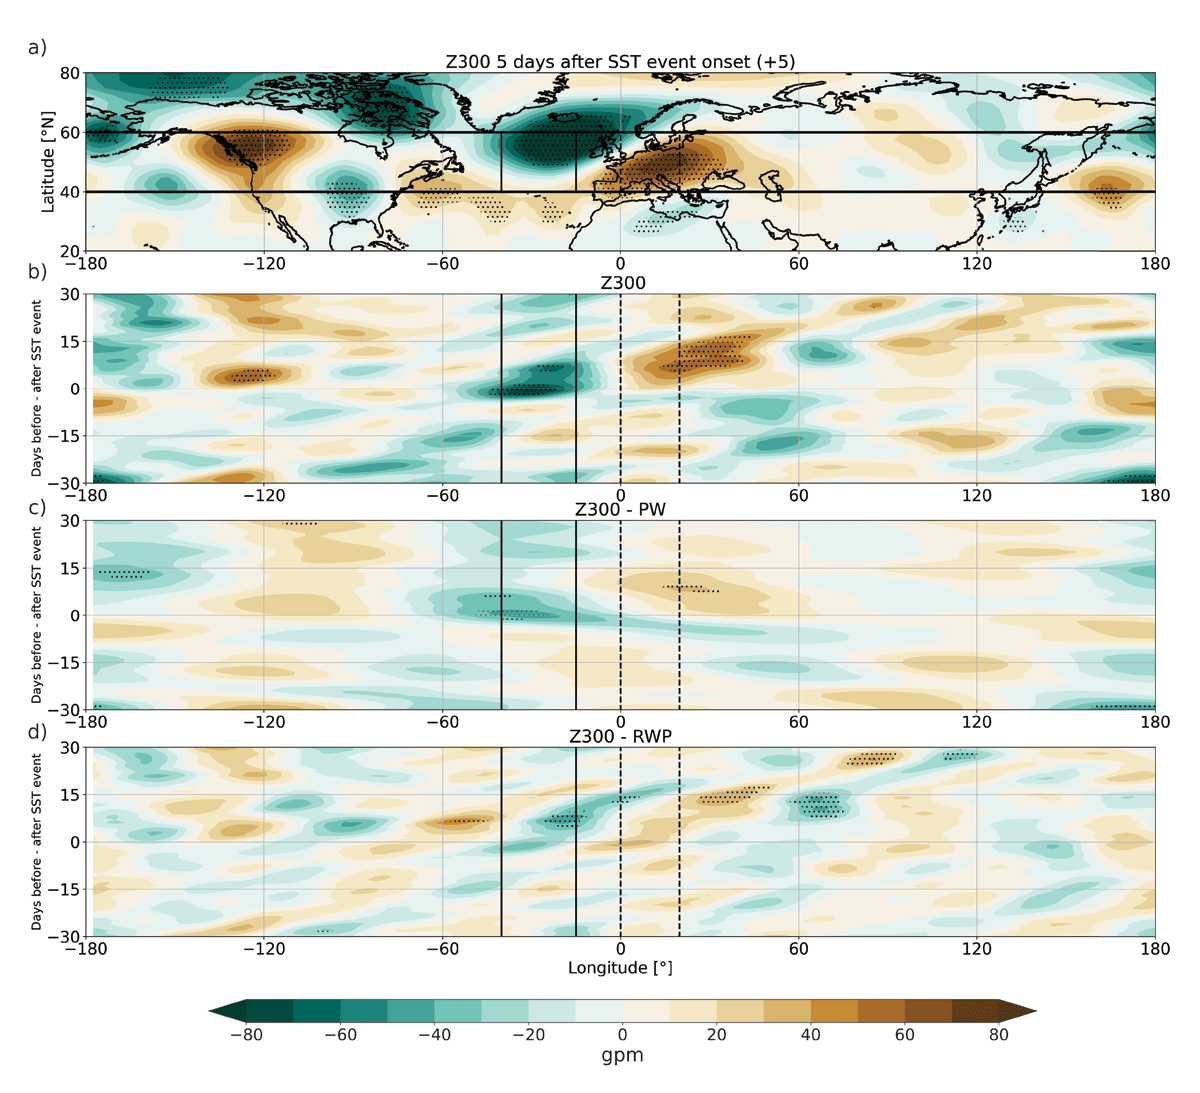
Figure 6
a) Map of full Z300 anomalies 5 days after the onset of a cold SST event with a negative tendency (enlargement of Figures 4b over all longitudes); b) Hovmöller diagram of full Z300 anomalies after a latitudinal average over 40–60°N (boundaries are shown as horizontal lines in a)); c) Same as b) but for PW filtered Z300 anomalies; d) Same as b) but for RWP filtered Z300 anomalies; solid vertical lines illustrate the longitude boundaries of the North Atlantic box (15–40°W) and dashed lines the boundaries of the European box (0–20°E); stippling indicates significance according to the 95% confidence interval based on the bootstrap method.
The time evolution at 40–60°N of the full Z300 data (Figure 6b) shows that the North Atlantic trough develops ahead of the negative SST tendency (lag = –5) while the ridge over Europe develops later (lag = 5).
The PW anomalies show maxima at 120°W, 0° and 120°E longitude with anomalies of up to +40 gpm (Figure 6c), producing a distinct wave number 3 pattern. Around lag = 0 the trough over the North Atlantic propagates westward, resulting in significantly negative Z300 anomalies prevailing in the North Atlantic longitude band.
A negative RWP anomaly develops over the North Atlantic near lag = 0 and a positive RWP anomaly follows, as expected from the waveguide diagnosed from anomalies (Figure 5f). The eastward propagation of the positive RWP anomaly over Europe (Figure 6d) matches the eastward propagation of the full Z300 field (Figure 6b), suggesting RWP anomalies dominate the local signal.
Both PW and RWP activity seem to play important roles for the emergence of the strong trough–ridge pattern, as both show significant patterns around lag = 0. The results from Figure 6 motivate further study about origins and interaction between PW’s and RWP’s, leading to European heat events. This topic has not been applied to such events on the Northern Hemisphere during summer in research before, but is beyond the scope of this study.
6. Summary & Discussion
Our composite analysis of SST and T2m anomalies in the Euro–Atlantic sector reveals that cold North Atlantic SSTs with a negative tendency are associated with a shift in the European surface temperature distribution towards warmer temperatures and a higher likelihood for heat events (Figures 2 and 3). The distinct majority of the events with cold SSTs and a negative tendency reveals significant signals in the examined meteorological variables (Figures 4 and 5), consistent with the enhanced European ridge development. We also find that European heat events are preceded by an increased probability for cold North Atlantic SST anomalies and a negative SST tendency. It is only during summers with persistently cold North Atlantic SSTs that we find an atmosphere-driven negative SST tendency preceding the development of a trough–ridge pattern over the North Atlantic–European sector. In the state of neutral or warm North Atlantic SSTs we observe a lack of these characteristics, particularly the absence of the European ridge development (Figs. A5 and A6).
By tracing backward trajectories from European heat events, Zschenderlein et al. (2020) identified a sequence of processes, happening in their so called ‘remote heating branch’ with its origin in the North Atlantic. The described branch involves diabatic heating through the release of latent heat by stratiform precipitation, which facilitates the onset of an upper–tropospheric anticyclone over Europe and is thus connected to European heat events. By studying the events from an Eulerian point of view using several atmospheric variables, we hypothesize that this mechanism is present in our composite of cold North Atlantic SSTs with a negative tendency. An upward surface turbulent heat flux occurs over the North Atlantic where we also find ascending air movement and enhanced medium cloud cover (Figures 4 and 5). The upward motion of moist air helps fueling the precipitation pattern identified in the North Atlantic (Dong et al., 2013). Also, the observed upper–level heating over Europe indicates that the suggested mechanism by Zschenderlein et al. (2020) could play an important role in the delayed European ridge amplification relative to the setup of the North Atlantic trough (Figure 4, 5, 6a,b). The Z300 anomaly patterns (Figure 6b) demonstrate that a strong North Atlantic trough is more persistent during cold North Atlantic SSTs, in agreement with Wulff et al. (2017). This persistence would also favour the development of an anchored remote diabatic heating branch, leading to the delayed European ridge and positive European T2m through subsidence. For instance, the European heat event in 2016 was influenced by subsidence rather than temperature advection (Zschenderlein et al., 2018).
Events of North Atlantic SST anomalies are not evenly distributed over the time period 1979–2019, as only 3 of the 12 cold SST events with a negative tendency are found during 1995 and 2014 (Figure 1c). This 20–year long period is dominated by the positive phase of the Atlantic multi–decadal variability (AMV). Based on our results that cold North Atlantic SSTs can increase the probability for European heat events, the AMV may be able to modulate the probability of central European heat events. Observational and model–based studies provide evidence that the AMV has a strong influence on European summer temperatures (Sutton and Hodson, 2005; Folland et al., 2009; Dong et al., 2013). Investigating the influence of multi–decadal AMV on European heat event frequency would require up to a century or more of data and is thus not possible with the ERA–5 data. Multi–centennial control simulations with climate models would provide a better dataset for such a purpose. Still, the correct representation of the amplitude and persistence of the AMV provides a challenge for climate models (Qasmi et al., 2017). The study by Qasmi et al. (2021) carried out idealized experiments with two climate models to test the sensitivity of the atmospheric response and the European climate to the amplitude of the AMV. Both climate models agree about an increase of the temperature and the heat event duration during the positive AMV phase over Scandinavia and the Mediterranean, however, the models disagree and do not show significant changes with regard to the temperature and the heat event duration over central Europe.
The contrast between North Atlantic SST anomalies and central European T2m anomalies is comparable to the early definition of the NAO which was based on temperature anomalies over Ilulissat, Greenland and Vienna, Austria. (Hann, 1890). The observed trough–ridge pattern in the North Atlantic–European sector has similarities to the negative SNAO phase and the positive SEA phase and can thus not be assigned to a single weather regime pattern. The non–simultaneous development of the North Atlantic trough and the European ridge downstream rather suggests that the similarities to the stationary patterns of the negative SNAO and positive SEA are shaped by an amplified atmospheric Rossby wave development in the North Atlantic–European sector (Teubler and Riemer, 2016; Benedict et al., 2004; Woollings et al., 2008). Planetary waves as well as regionally confined RWP’s both are proposed to have an influence on regional weather extremes (Röthlisberger et al., 2016). Our wave decomposition shows that both RWPs and PWs are important to explain the significant North Atlantic Z300 signal during cold SST events with a negative tendency (Figure 6c,d).
Our results suggest that surface heat fluxes over Europe and associated feedbacks do not initiate European heat events (Figure 5), as also noted by Findell and Delworth (2005), but play a more important role in amplifying ongoing European heat events. As the cold SST over the North Atlantic is concurrent with a deep trough, cold and dry air advection arriving from the Greenland– Labrador region is likely driving an enhanced upward turbulent heat flux over the North Atlantic, inducing the negative tendency of the North Atlantic SSTs (Wallace and Gutzler, 1981).
Further sensitivity experiments using a higher number of events or ensembles are necessary to separate the relative contributions of thermodynamical and dynamical mechanisms to understand the dominant processes involving North Atlantic SSTs, the atmospheric circulation and European heat events.
7. Conclusion
Apart from previous case studies, ours provides a first general statistical estimate on how a specific North Atlantic SST state favours a shift in the European surface temperature distribution towards higher values during boreal summer. Below we summarize the main findings of the conducted composite study:
Events of cold North Atlantic SSTs with a negative tendency (11 out of 12) are connected to a shift in the European summer temperature distribution towards positive anomalies a few days later. These events are marked by a deep North Atlantic trough and subsequent development of a European ridge.
A composite based on European heat events reveals that 14 of 18 events have preceding negative North Atlantic SST anomalies and 15 of 18 events have a negative tendency of the North Atlantic SST 5 days before the events. A comparison of composites shows that the dates of 4 of 18 European heat events within the period of 1979 to 2019 are related to cold North Atlantic SSTs below the 0.1 quantile with a negative tendency a few days in advance.
Cold North Atlantic SSTs with a negative tendency are generally accompanied by reduced cloud cover and enhanced downwelling solar radiation over central Europe which do not trigger but rather amplify an existing heat event. There is an increase in turbulent heat flux, ascent, precipitation over the North Altantic. Further, an enhanced waveguide promotes the downstream development of the ridge over central Europe.
An atmospheric wave filtering into planetary waves with wave numbers 1 to 3 and Rossby wave packets with wave numbers 4 to 15 unravels a wavenumber 3 pattern and a regionally confined Rossby wave packet superimposed, leading to the trough–ridge pattern in the North Atlantic–European sector. The results highlight the importance of analysing both wave types simultaneously.
The results of our study disclose that a change of the North Atlantic SST on the synoptic time scale can precede a shift of European T2m anomalies and a higher likelihood of European heat events. Due to the limitation of a small sample size, model-based studies with larger samples are required to support the identified statistical relationship and to confirm the hypothesized causal mechanism.
Data Accessibility Statement
ERA5 reanalysis data on single levels from 1979 to 2019 used in this study was freely retrieved from: https://cds.climate.copernicus.eu.
Notebooks about the data analysis are freely accessible through: https://github.com/jukrueger/ERA5-NASST-EuroHW. For the EOF analysis a python package was used and freely retrieved from: https://ajdawson.github.io/eofs/.
Additional File
The additional file for this article can be found as follows:
Acknowledgements
We thank the European Centre for Medium–Range Weather Forecasts (ECMWF) data server for the freely available ERA5 reanalysis data.
Funding information
J.Krüger was supported by JPI Climate & JPI Oceans (ROADMAP, grant 01LP2002C).
Competing Interests
The authors have no competing interests to declare.
Author contributions
J.Krüger wrote the manuscript and performed the EOF and the composite analysis. Both J.Kjellsson and RPK contributed in discussions and with comments on the content and on the scientific writing style. RPK performed the wave decomposition. MC contributed with helpful comments on the manuscript.