
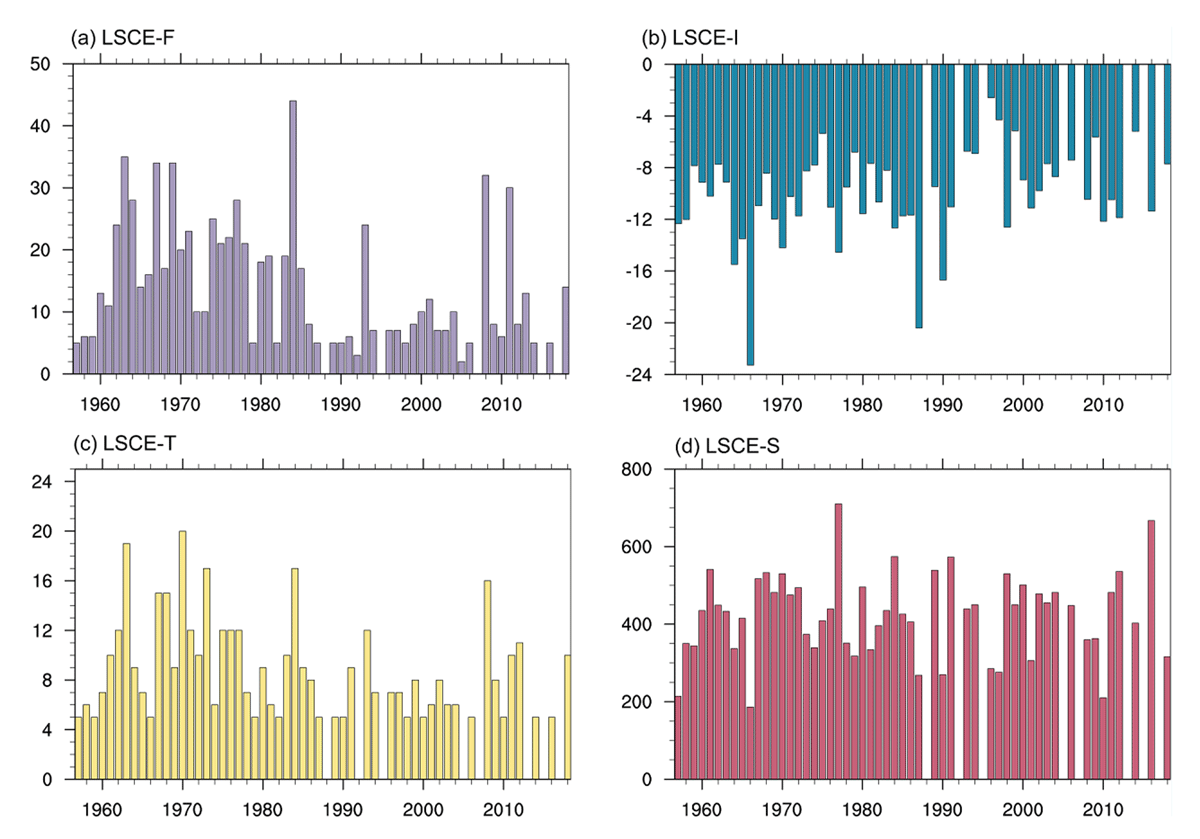
Figure 1a
Annual feature of winter time frequency of LSCE (LSCE-F, a), intensity of LSCE (LSCE-I, b), lasting-time of LSCE (LSCE-T, c), and scale of LSCE (LSCE-S, d) from 1958 to 2019.
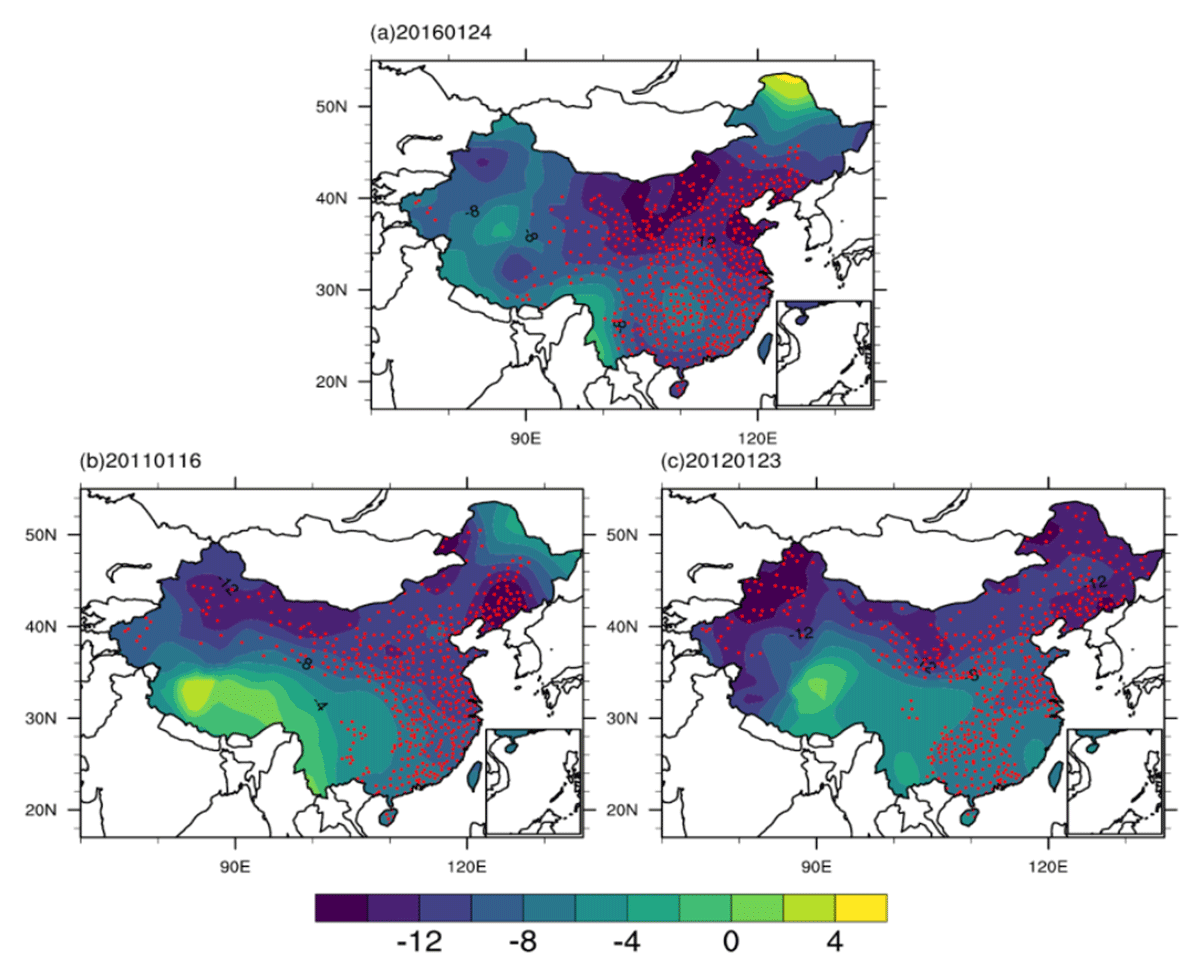
Figure 2
The spatial distribution of temperature anomalies (shaded, °C) and the affected stations (red points) in (a) 2016, (b) 2011, and (c) 2012.
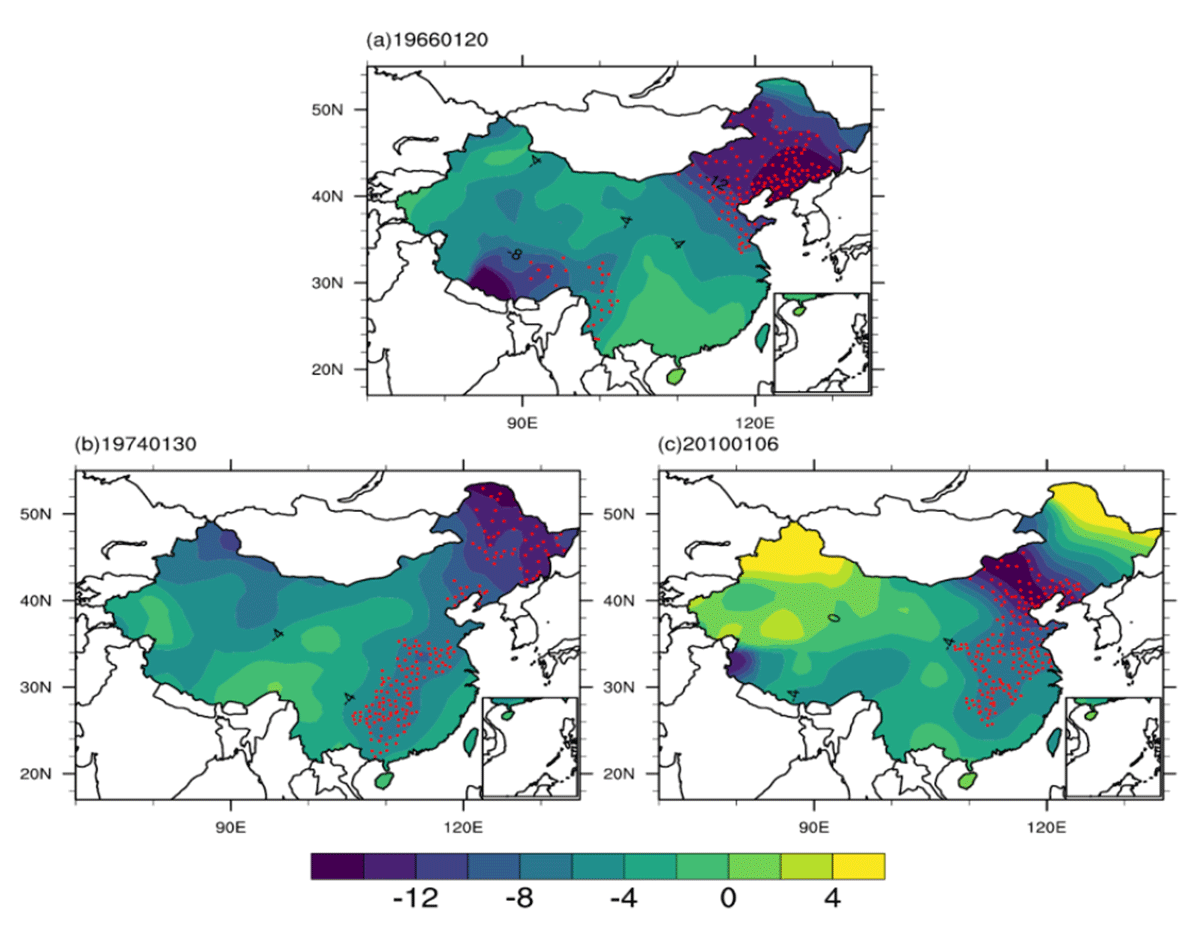
Figure 3
Same as Figure 2 but in (a) 1966, (b) 1974, and (c) 2010.
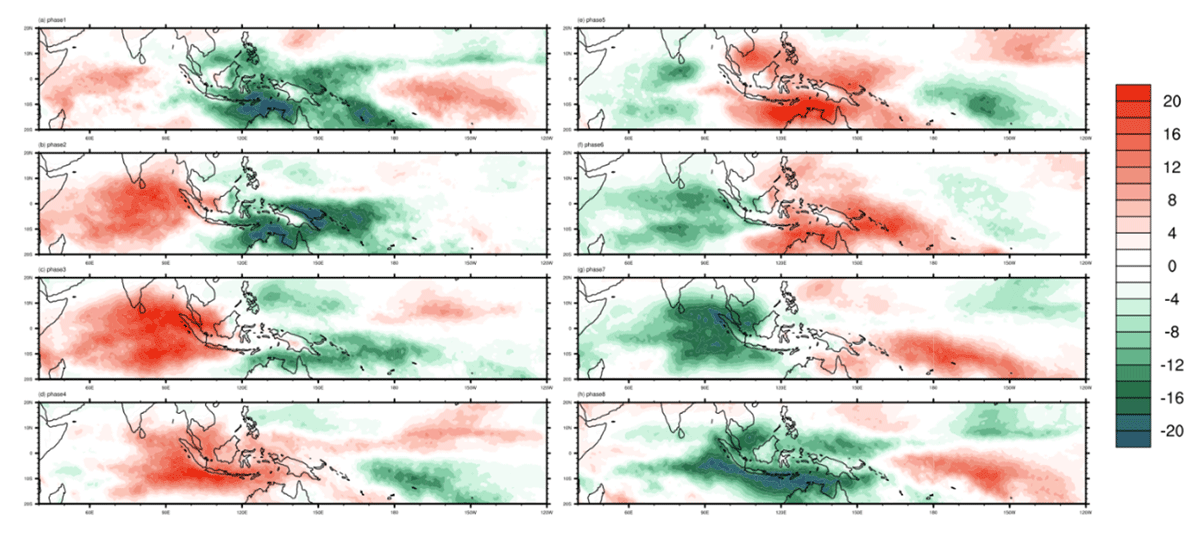
Figure 4
Spatial distribution of tropical OLR (shaded, W m-2) under the different phases of MJO. Here the values are multiply by –1 for clear recognition.
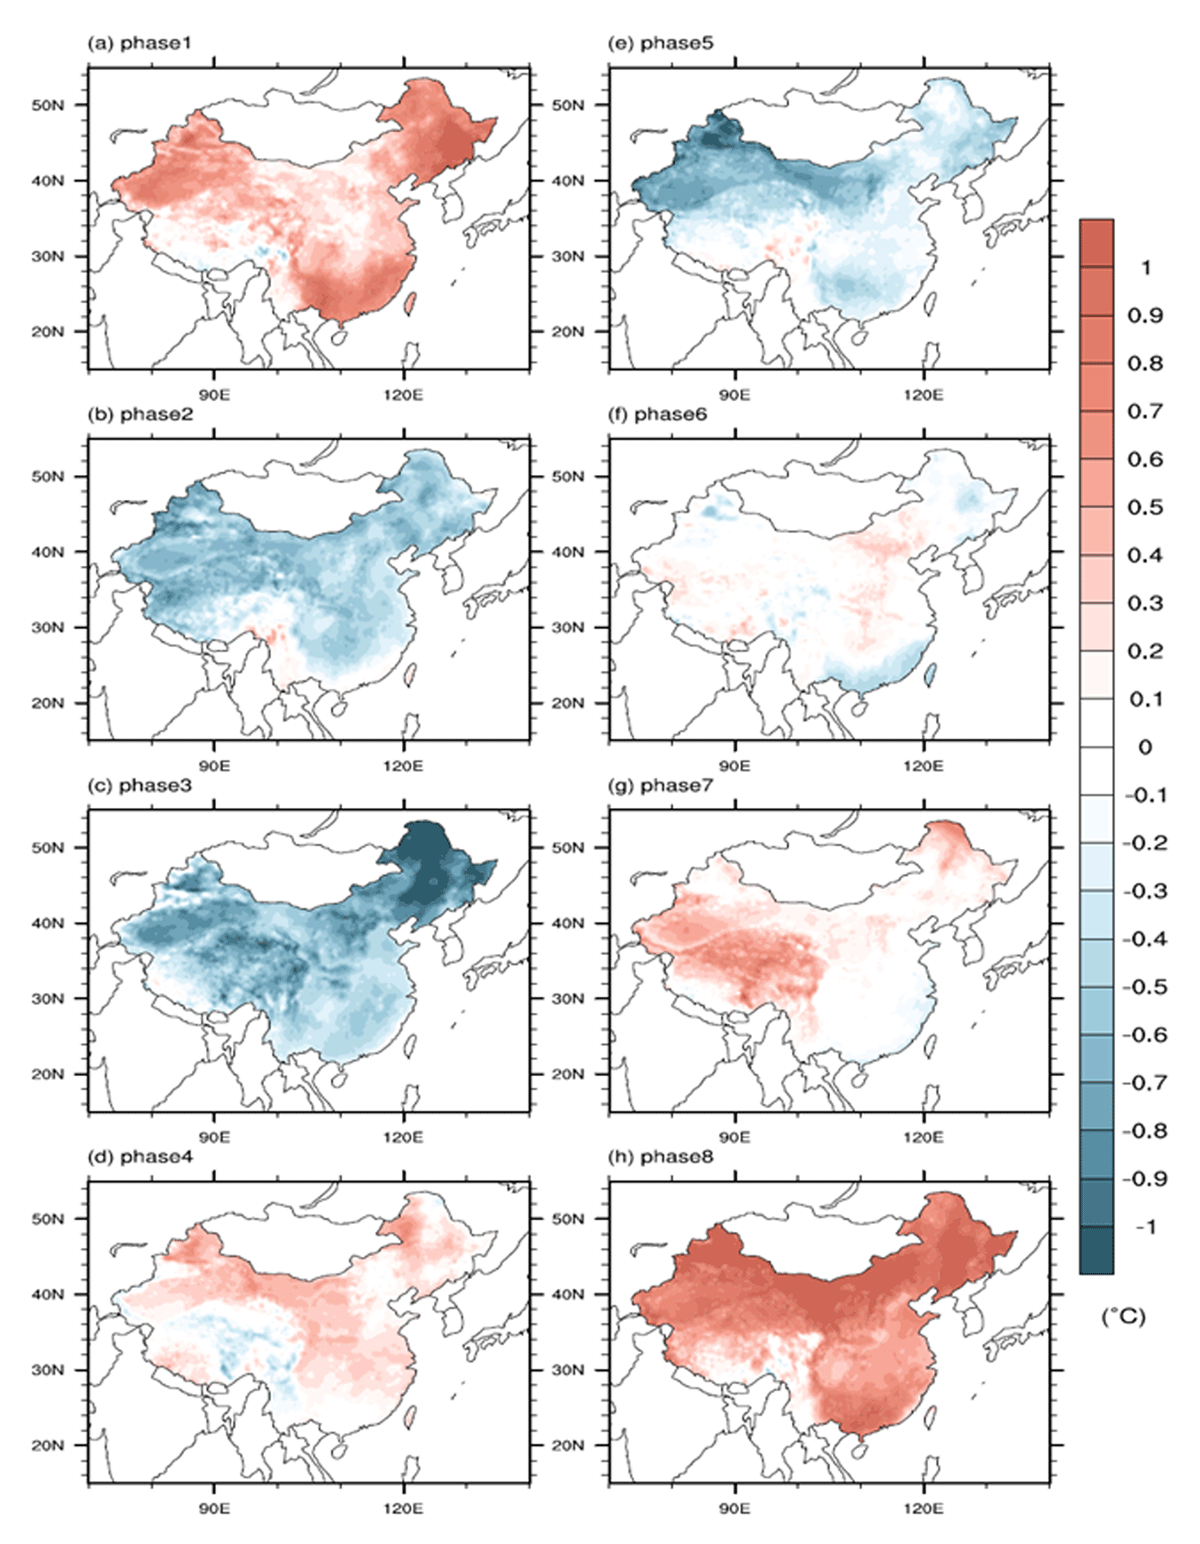
Figure 5
Spatial distribution of temperature anomalies for 8 phases separately.
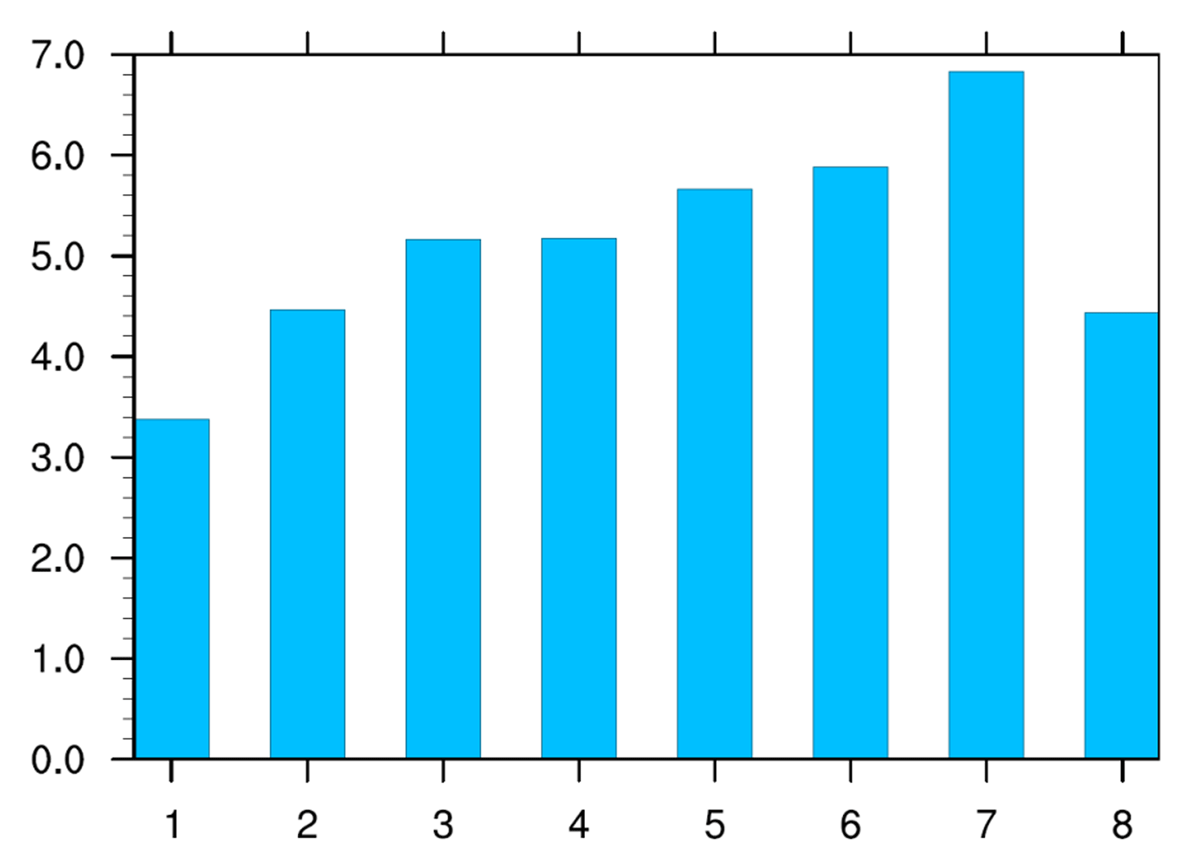
Figure 6
The average number of days for 8 phases in winter.
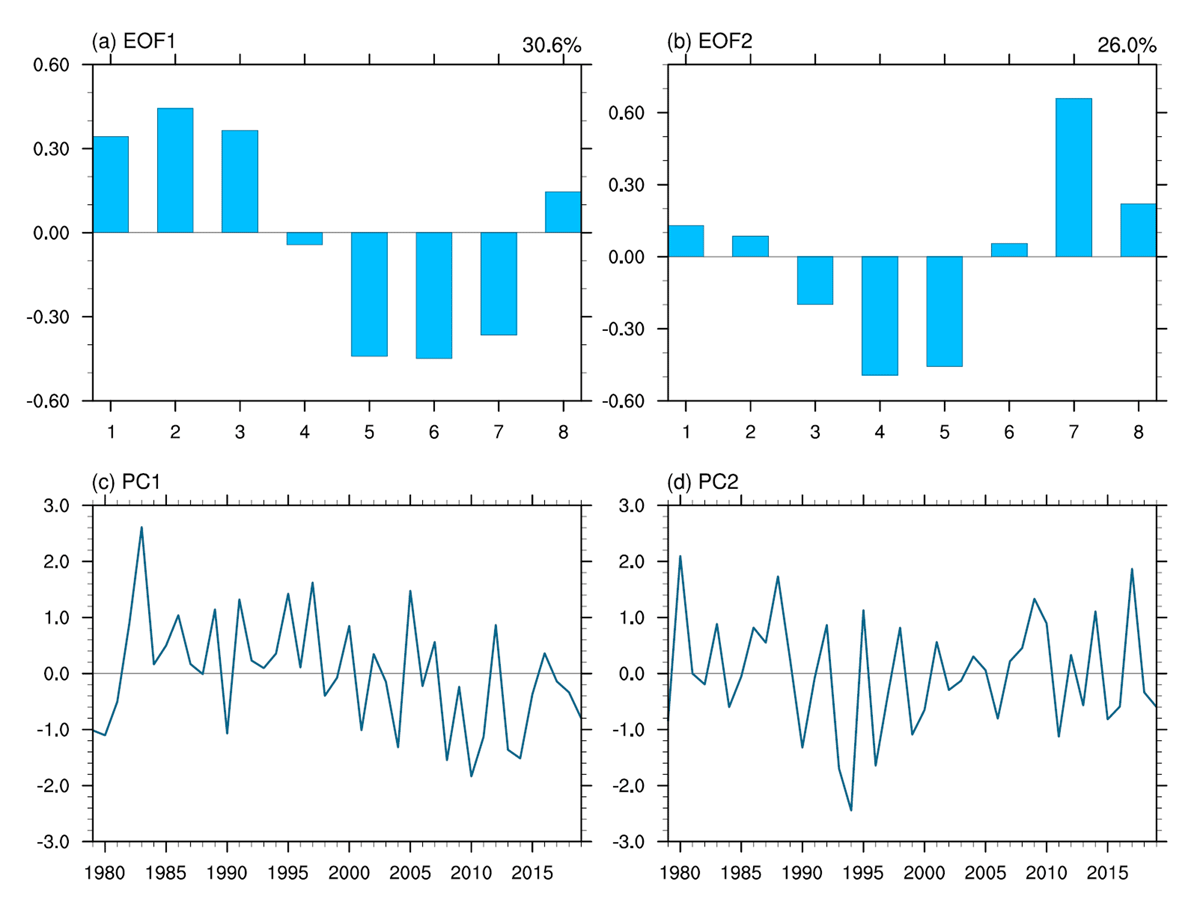
Figure 7
The first two EOFs (a and b) of MJO frequency in 1979–2019 winters, and the corresponding time series (c and d).
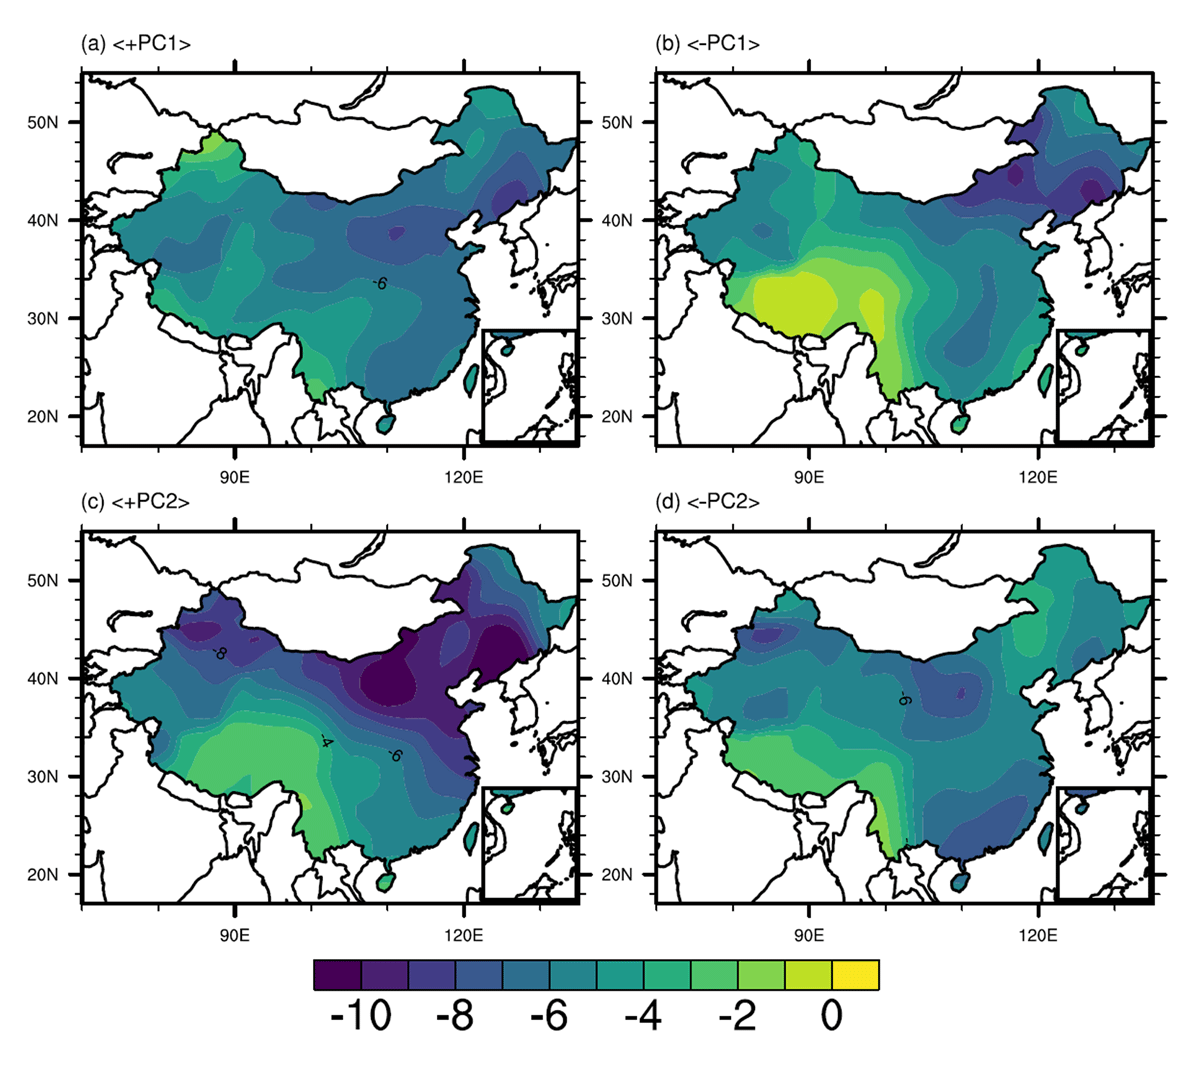
Figure 8
The spatial distribution of surface temperature anomaly at 500 hPa for the cases of (a) +PC1, (b) –PC1, (c) +PC2, and (d) –PC2, respectively.
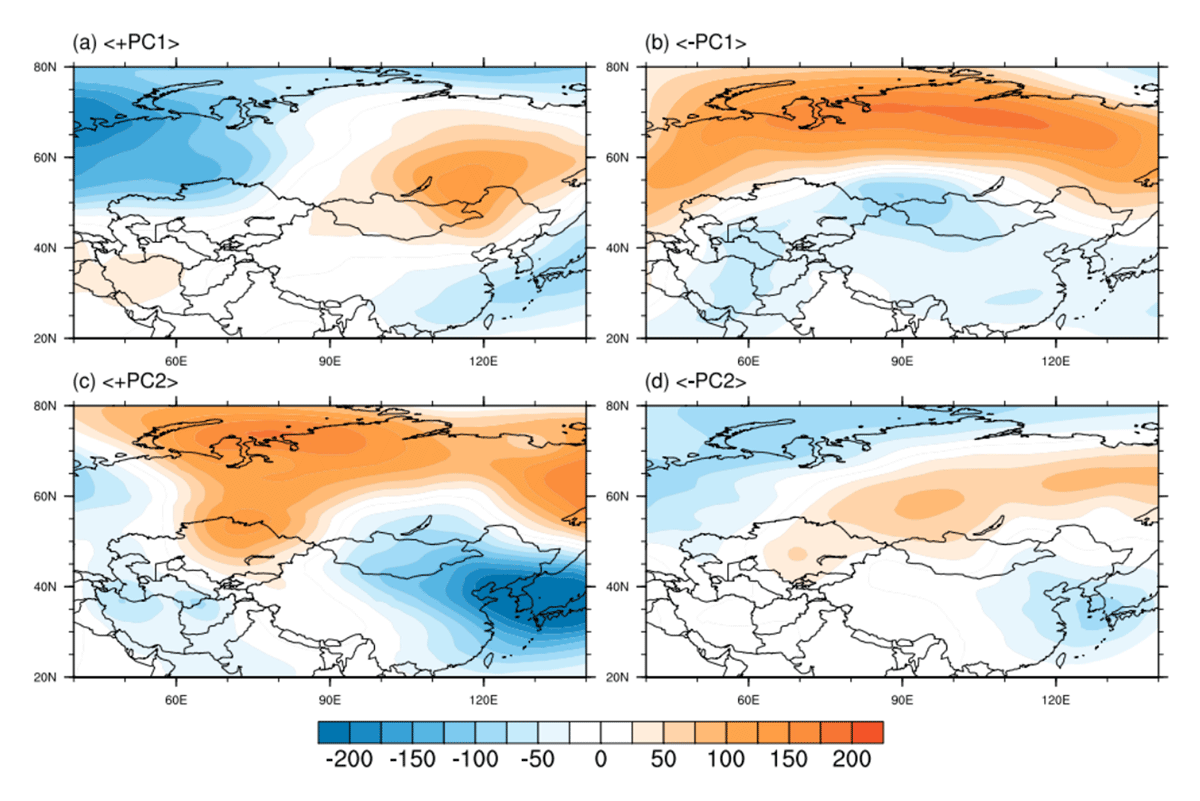
Figure 9
The spatial distribution of geopotential height anomaly at 500 hPa for the cases of (a) +PC1, (b) –PC1, (c) +PC2, and (d) –PC2, respectively.
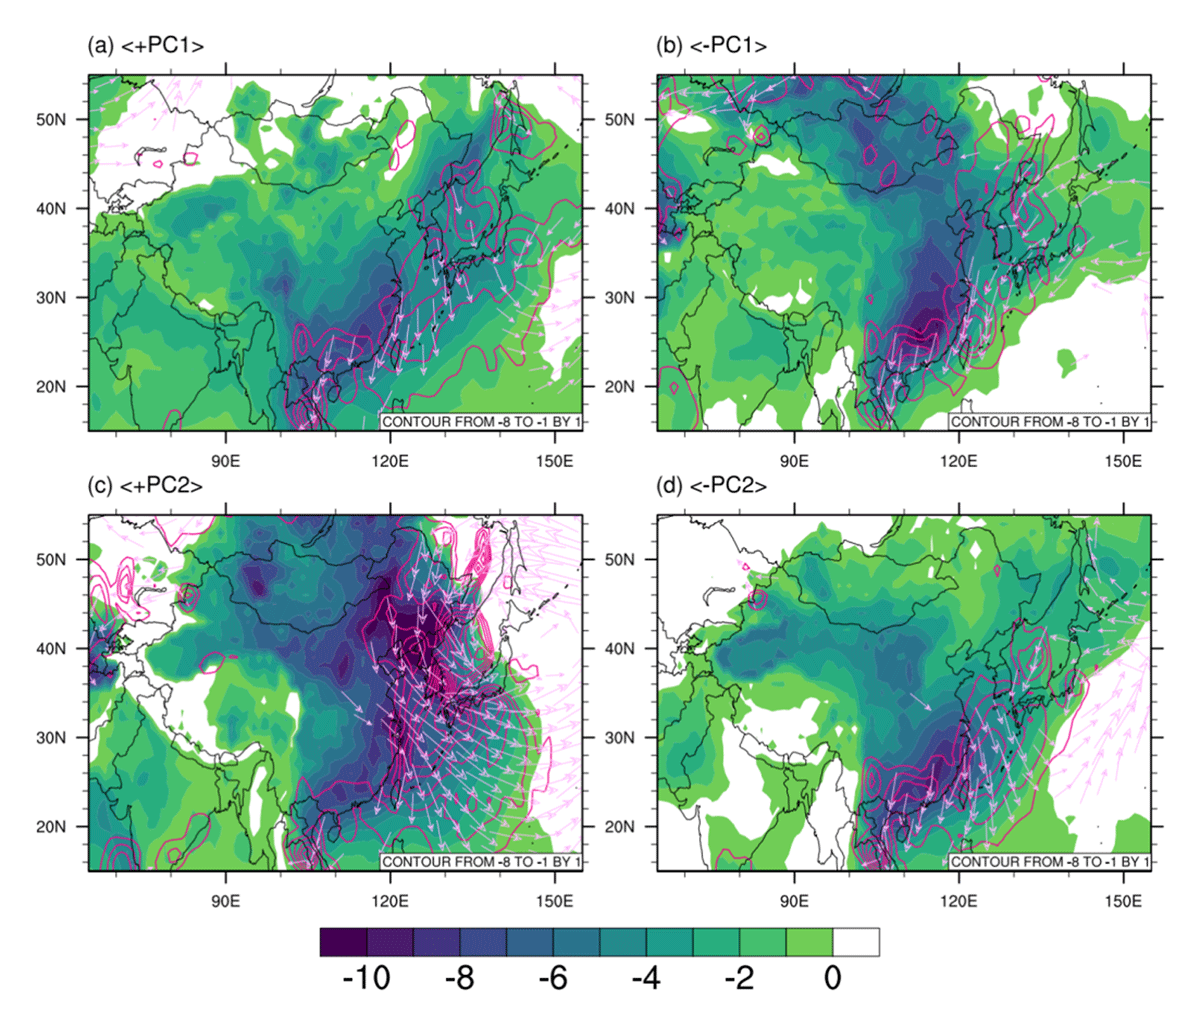
Figure 10
Same as Figure 9 but for the temperature anomalies (shades, °C), zonal wind (vectors, m/s), and horizontal advection of temperature (contours, °Cs–1).