
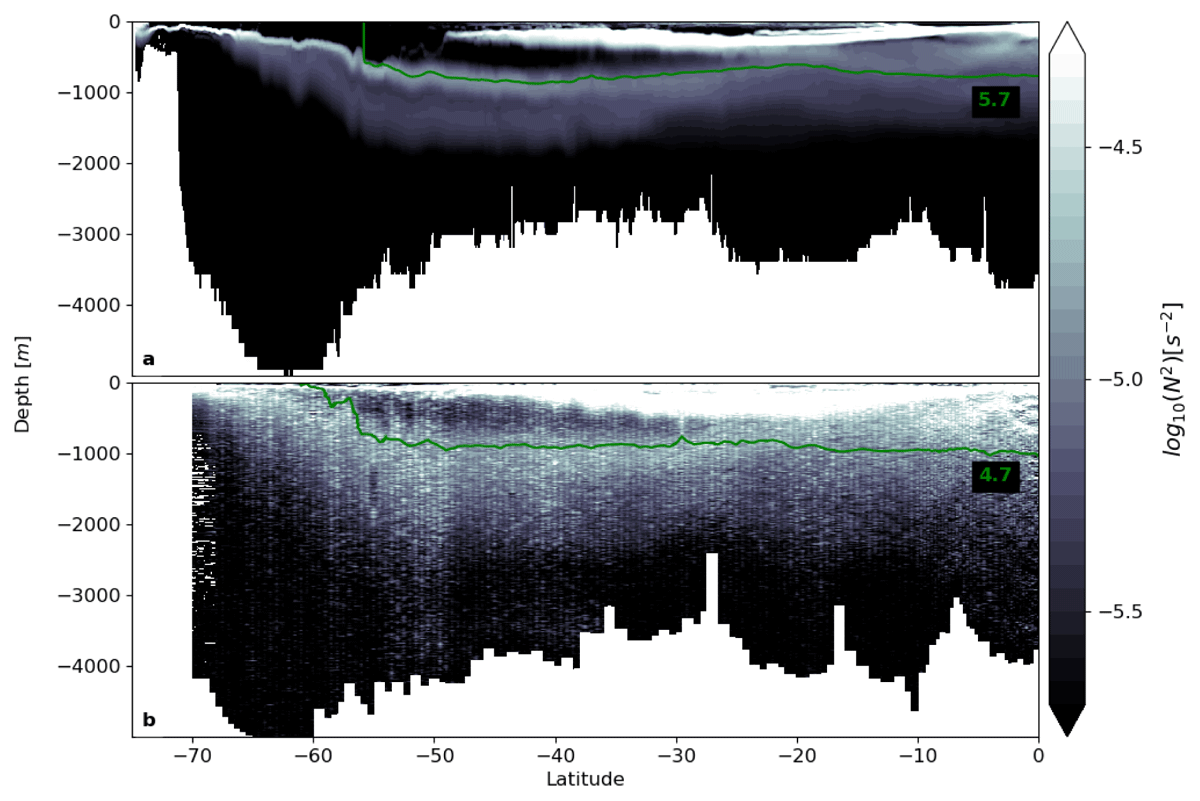
Figure 1
Stratification in a realistic model and observations. (a) Model output of stratification, shown as log10(|N2|), from a realistic eddying ice-ocean model (Kiss et al. 2020) at a longitude of 110°W, shown for the (Austral) winter month of September 2015. The green line is the isotherm T = 5.7°C. (b) Ship-based observations of stratification, shown as log10(|N2|), for WOCE transect P18 (between longitudes 110°W and 100°W) from a R/V Ronald H. Brown cruise in November 2016–February 2017. The green line is the isotherm T = 4.7°C.
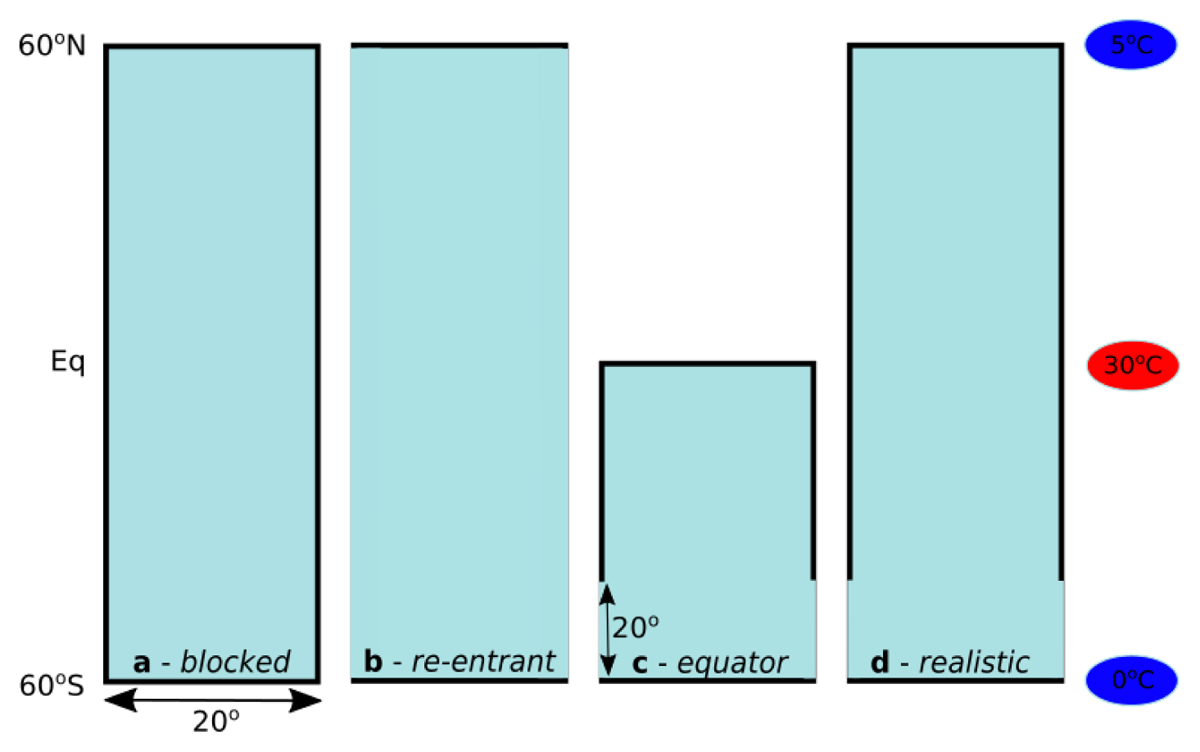
Figure 2
Model domains. (a) Model domains used for the experiments are (a) blocked, (b) re-entrant, (c) equator, and (d) realistic. All domains extend 20° in longitude, and from 60°S to 60°N in latitude, apart from the equator domain which is limited to the southern hemisphere. The re-entrant channel in the (c) equator and (d) realistic domain extends 20° in latitude. Black lines are solid boundaries, whereas blue boundaries are re-entrant, that is, fluid which leaves the domain in the east (west) enters the domain in the west (east). The temperature at the equator is restored to 30°C, the southern end of the domain to 0°C, and the northern end of the domain to 5°C.
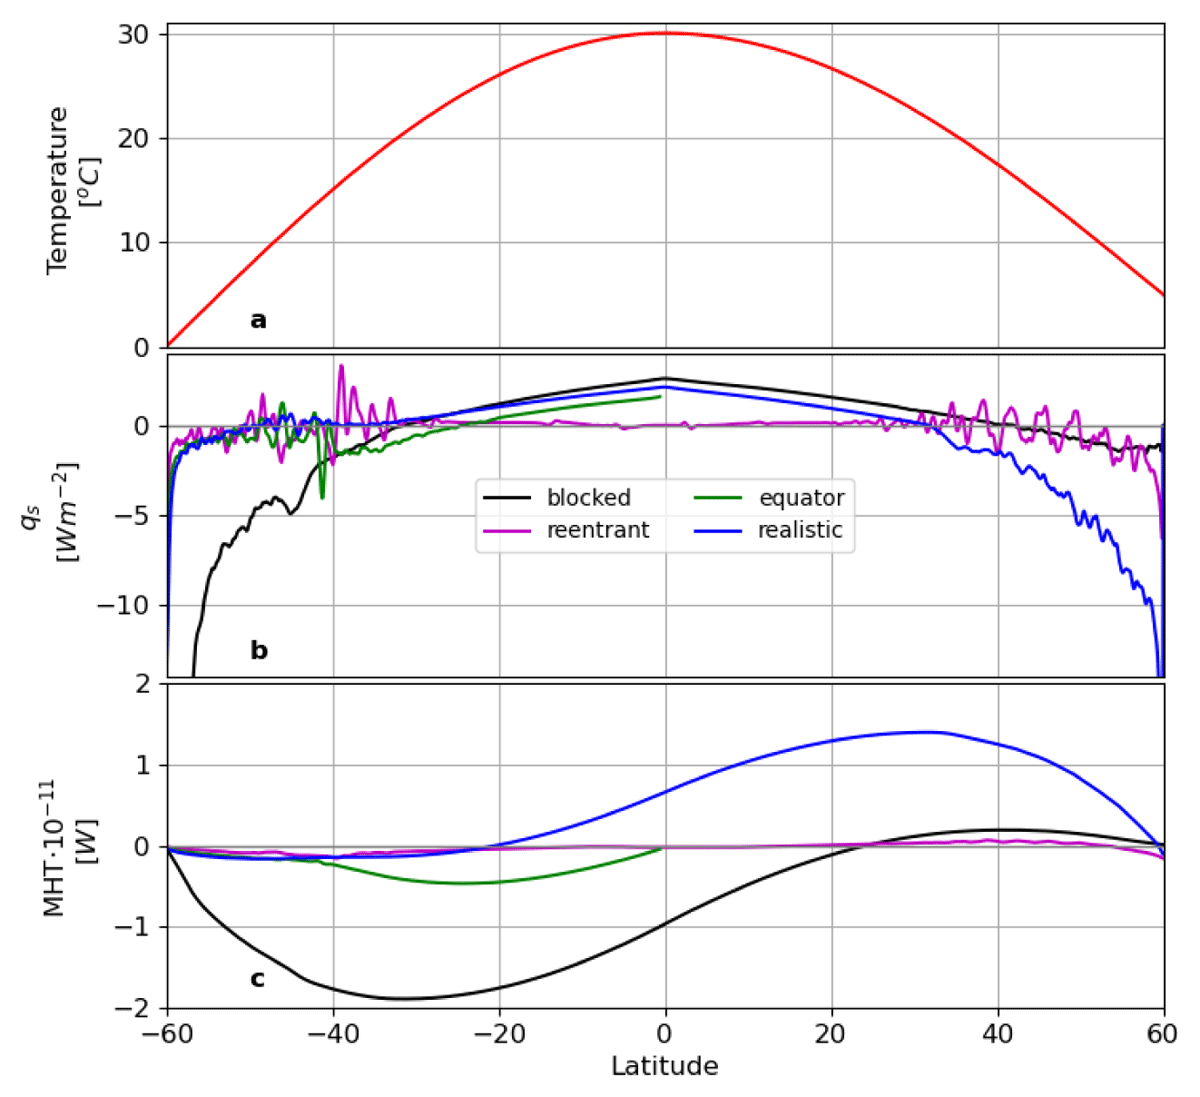
Figure 3
Surface forcing and meridional heat transport. (a) Sea-surface temperature restoring profile, (b) resulting temperature fluxes (qs), and (c) meridional heat transport (MHT) for the blocked (black), re-entrant (magenta), equator (green), and realistic (blue) domains.
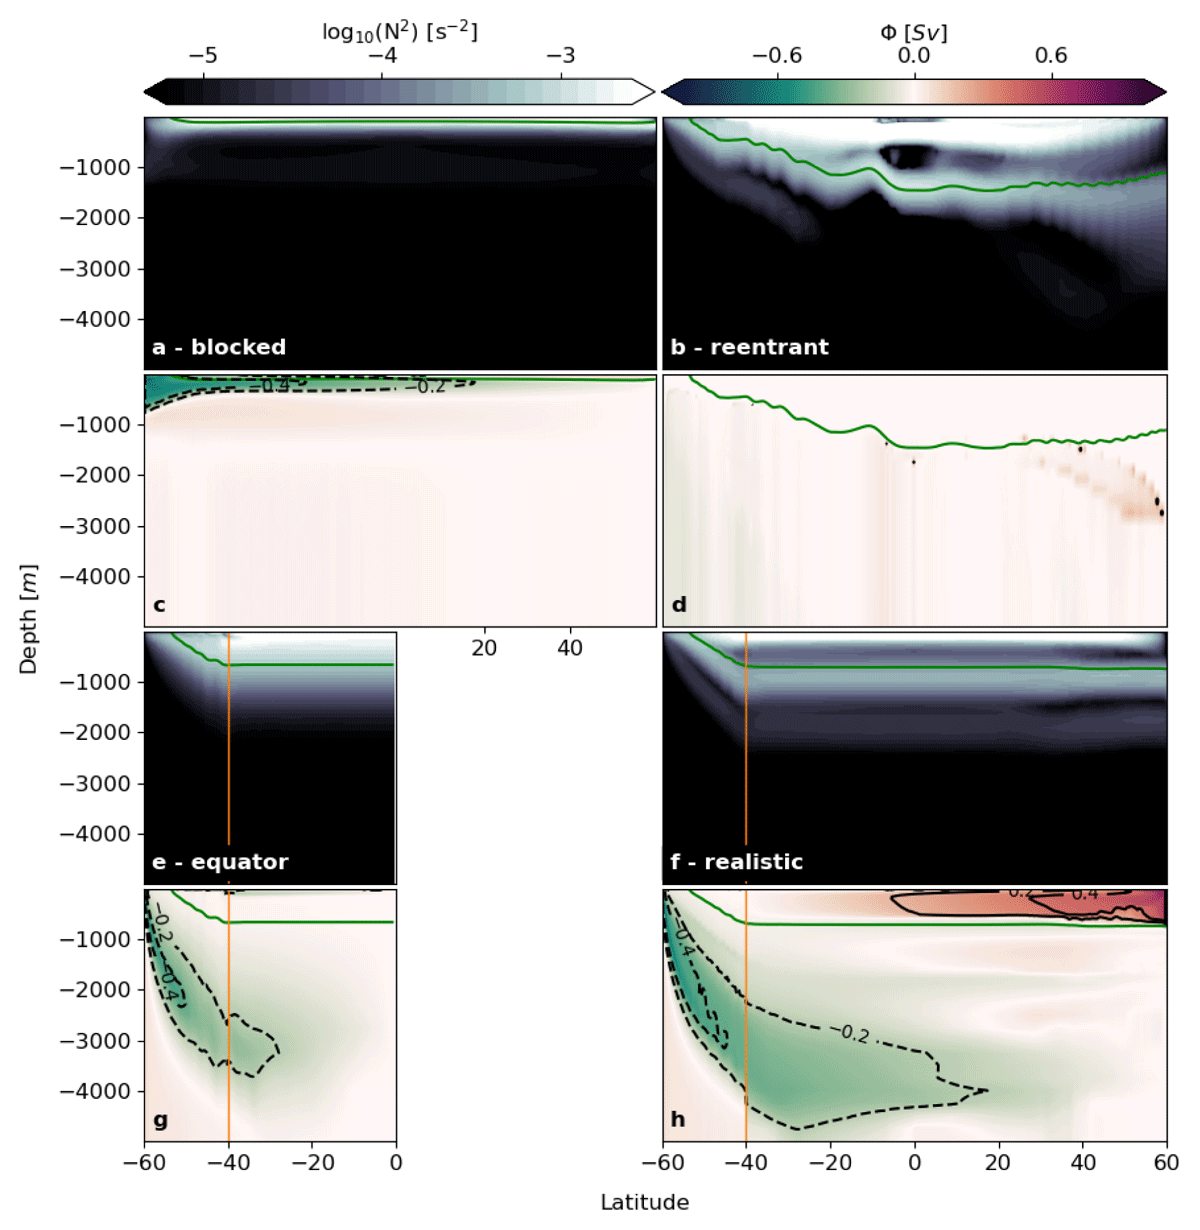
Figure 4
Stratification and overturning circulation; sensitivity to domain geometry. Vertical sections of zonal and temporal mean values of (a,b,e,f) the stratification, N2, shown as log10(|N2|), and (c,d,g,h) the overturning circulation (also shown as black contour lines), Φ, for the (a,c) blocked, (b,d) re-entrant, (e,g) equator, and (f,h) realistic domain. The orange lines mark the northern extent of the circumpolar channel, and the green lines mark the 5°C isotherm.
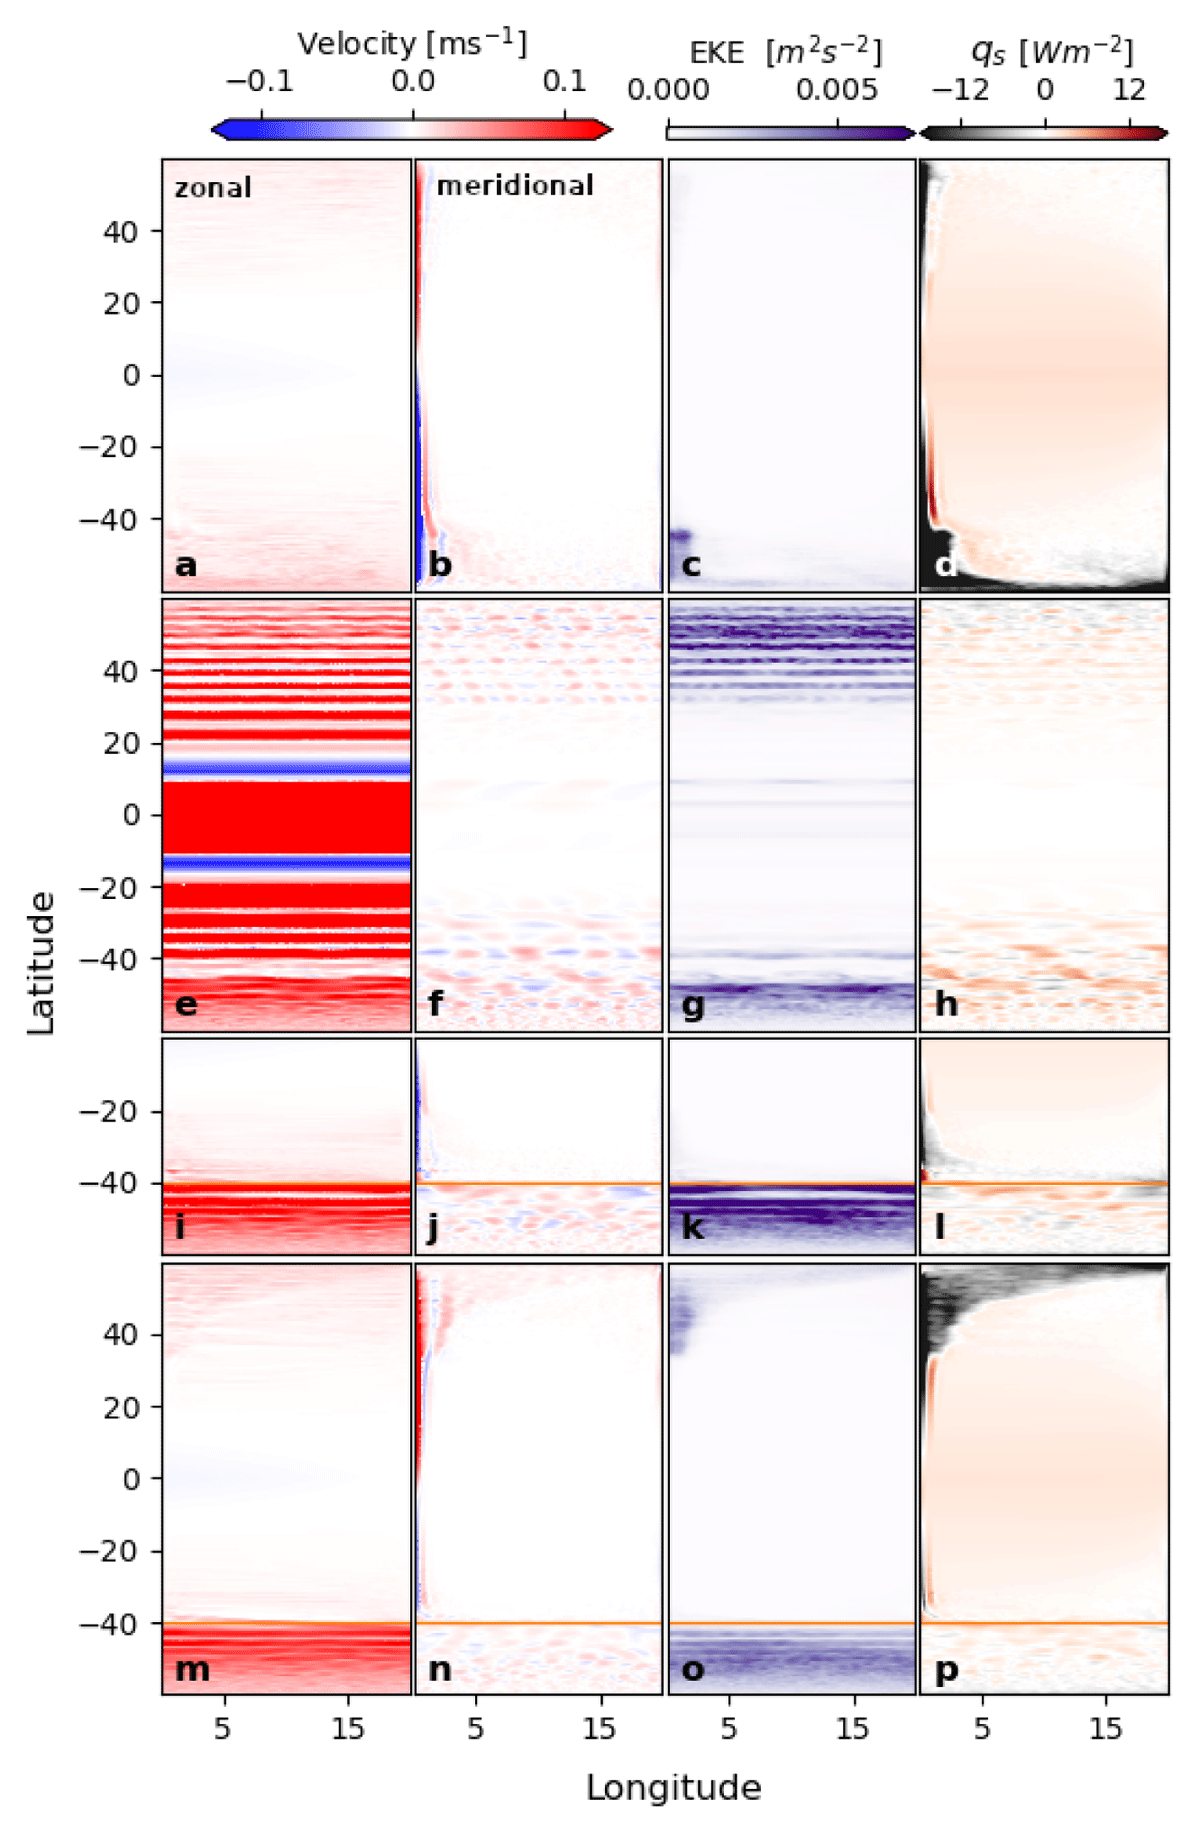
Figure 5
Horizontal circulation. Mean surface values of the (a,e,i,m) zonal velocity (U), (b,f,j,n) meridional velocity (V), (c,g,k,o) eddy kinetic energy (EKE), and (d,h,l,p) surface temperature fluxes (qs) for the experiment in (a,b,c,d) the blocked domain, (e,f,g,h) the re-entrant domain, the (i,j,k,l) the equator domain, and the (m,n,o,p) the realistic domain. The orange lines mark the northern extent of the circumpolar channel.
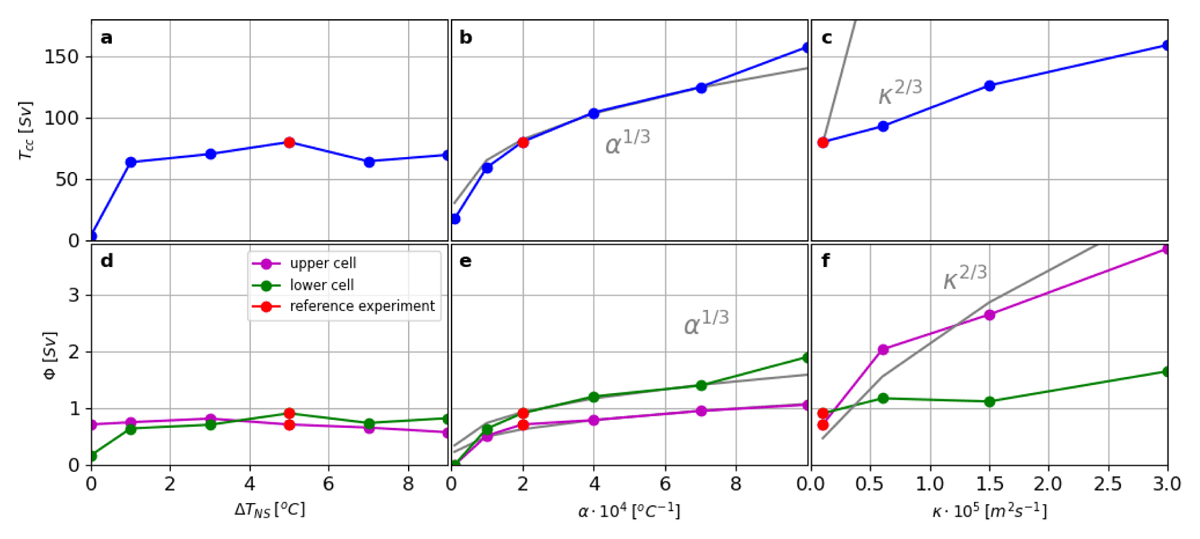
Figure 6
Circumpolar current transport and overturning strength. The circumpolar current transport, Tcc is shown as a function of (a) the north-south temperature difference, ΔTNS, (b) the thermal expansion coefficient, α, and (c) the vertical diffusivity, κ. The strength of the overturning circulation, Φ, is shown for both the upper (magenta) and lower (green) cell as a function of (d) the north-south temperature difference, ΔTNS, (e) the thermal expansion coefficient, α, and (f) the vertical diffusivity, κ. The red dots show values for the reference experiment. Grey lines show scaling arguments.
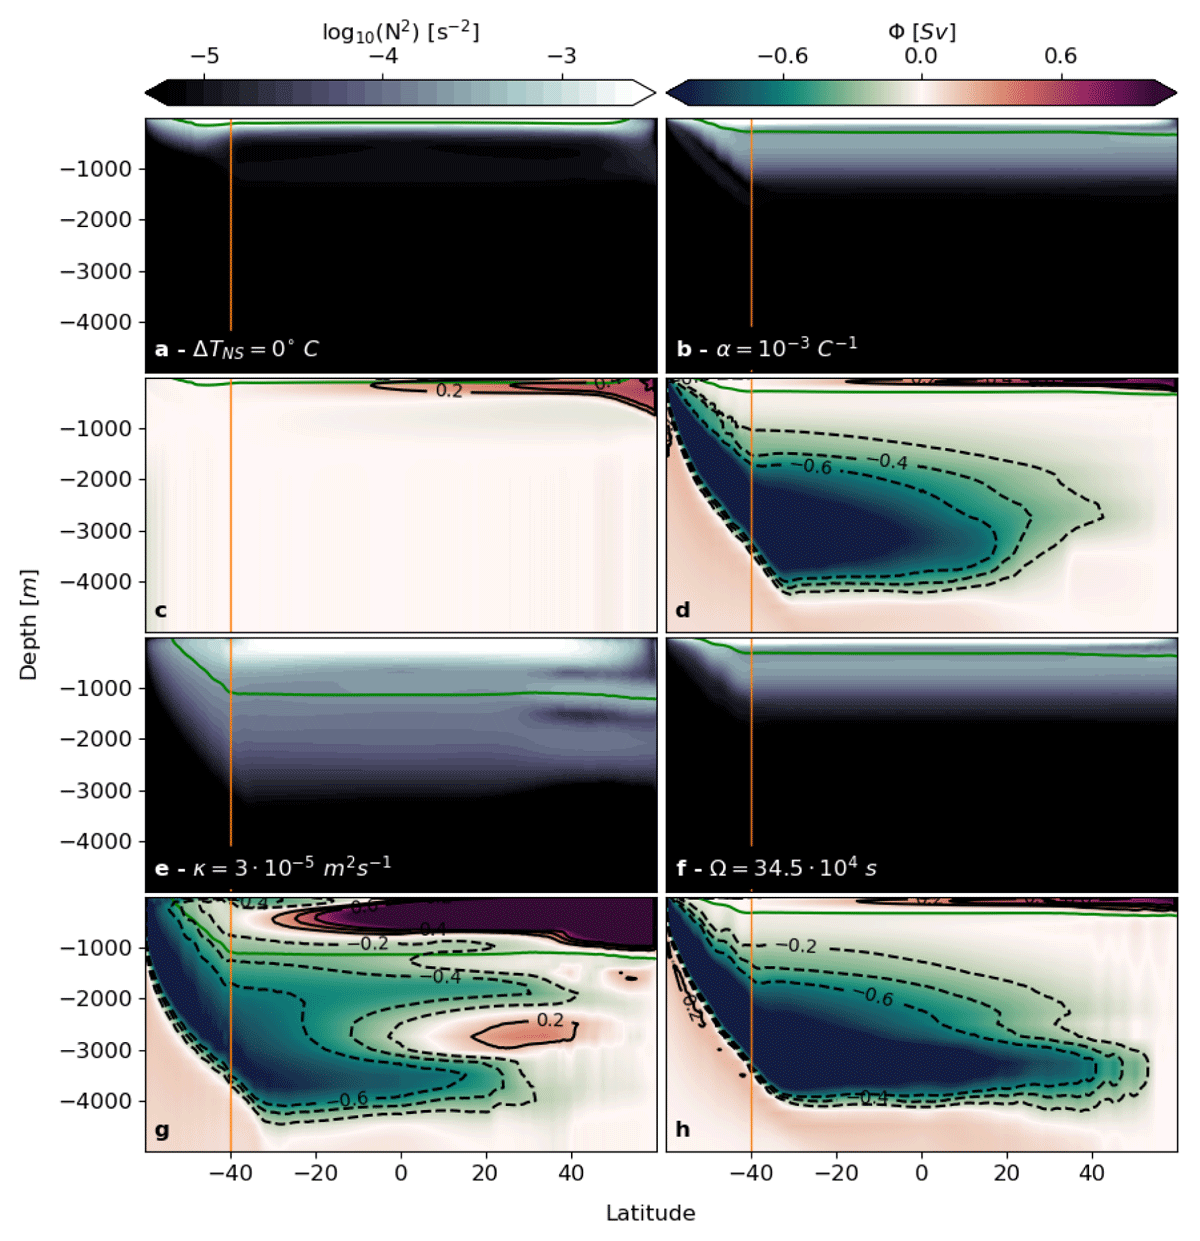
Figure 7
Stratification and overturning circulation; parameter sensitivity. Vertical sections of zonal and temporal mean values of (a,b,e,f) the stratification, N2, shown as log10(|N2|), and (c,d,g,h) the overturning circulation (also shown as black contour lines), Φ, for (a,c) a north-south temperature difference of ΔTNS = 0°C, (b,d) a thermal expansion coefficient of α = 10–3°C–1, (e,g) a vertical diffusivity of κ = 3·10–5 m2s–1, and (f,h) a rotation period of Ω = 34.5·104 s. The orange lines mark the northern extent of the circumpolar channel, and the green lines mark the 5°C isotherm.
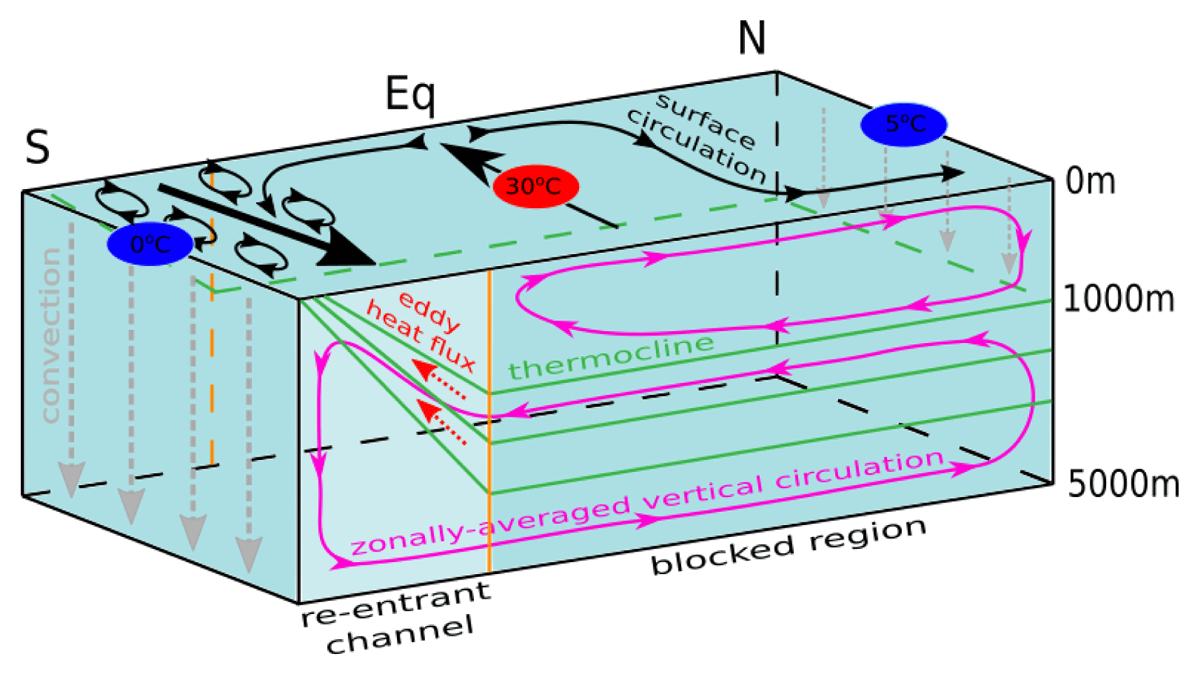
Figure 8
Schematic of thermally-forced circulation. Black arrows indicate the surface circulation, and magenta arrows the zonally-average vertical circulation. Green lines are isotherms, grey dashed arrows indicate convection, and red dashed arrows indicate the eddy heat flux. The orange line marks the northern edge of the re-entrant channel, splitting the re-entrant channel to the south from the blocked region to the north. Numbers in ellipses are the temperatures the ocean surface is restored to, with the red ellipse (at the equator) indicating a region of stabilizing buoyancy flux (heating), and blue ellipses (at the southern and northern boundaries) indicating regions of destabilizing buoyancy flux (cooling).