
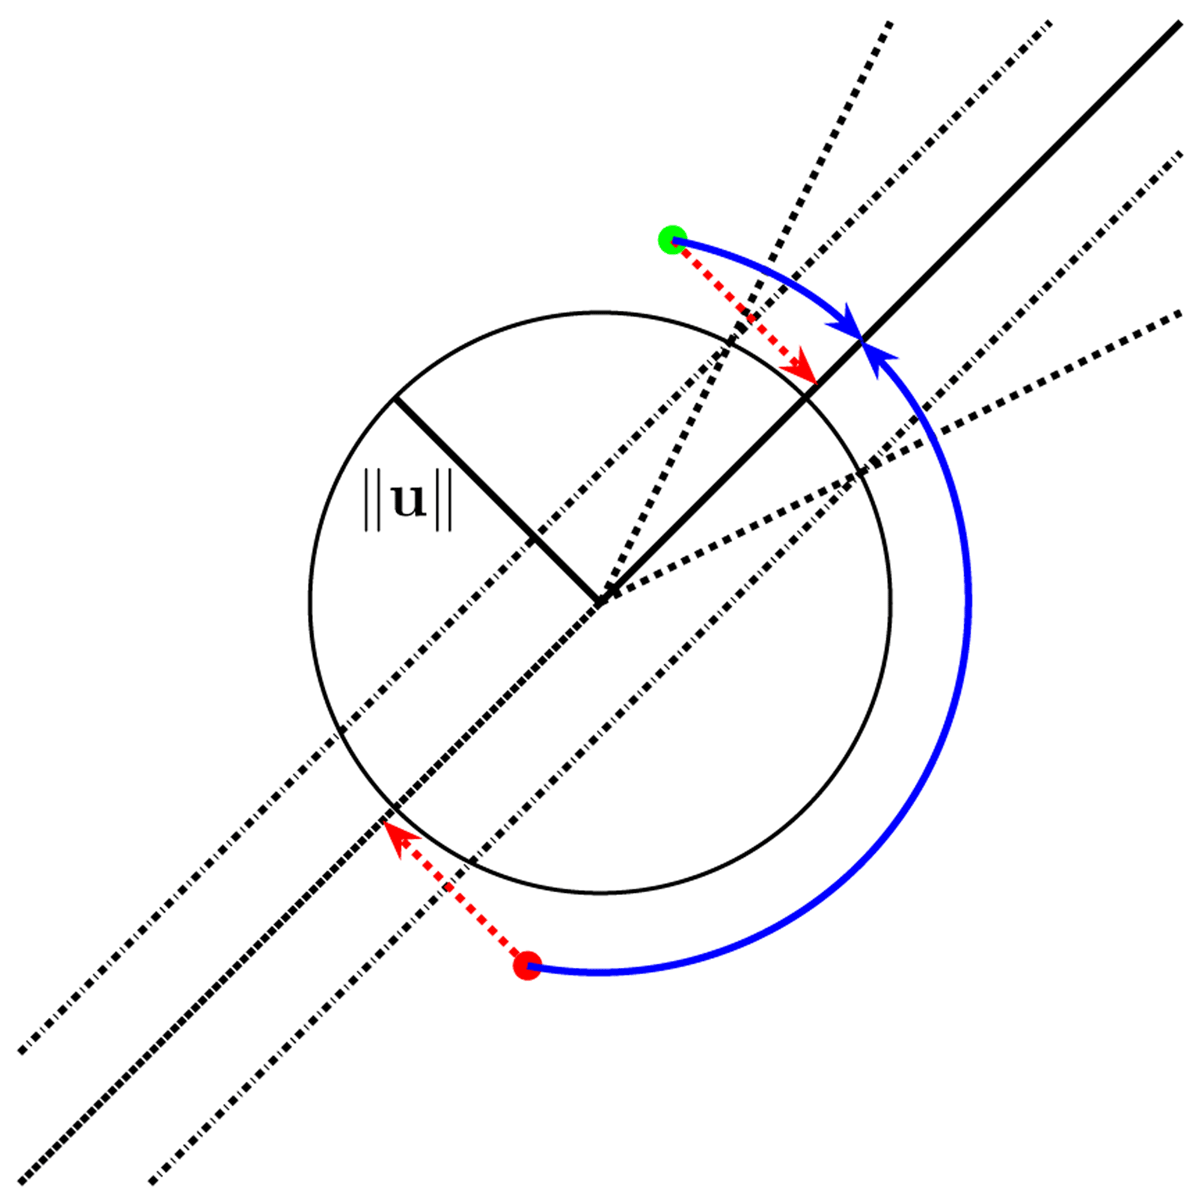
Figure 1
The solid line emanating from the center of the circle indicates the observed wind direction, while the dashed lines flanking the solid line indicate the uncertainty in the measurement of the wind direction. The dotted lines indicate the linear observation model: The central dotted line is parallel to the observed wind direction, and the flanking dotted lines represent the uncertainty in the magnitude of the wind perpendicular to the observed wind direction. The magnitude of the uncertainty in the linear model is chosen so that it matches the magnitude of the uncertainty in the wind direction at a particular wind speed; this wind speed where the uncertainties match is the radius ∥u∥ of the circle. The red lines indicate the way in which a wind vector (solid circles) is adjusted by the EnKF approach, while the blue lines indicate the way in which a wind vector is adjusted by the TSEF approach. The green solid circle is adjusted similarly by the EnKF and TSEF approaches, while the red solid circle is adjusted correctly by the TSEF and incorrectly by the EnKF.
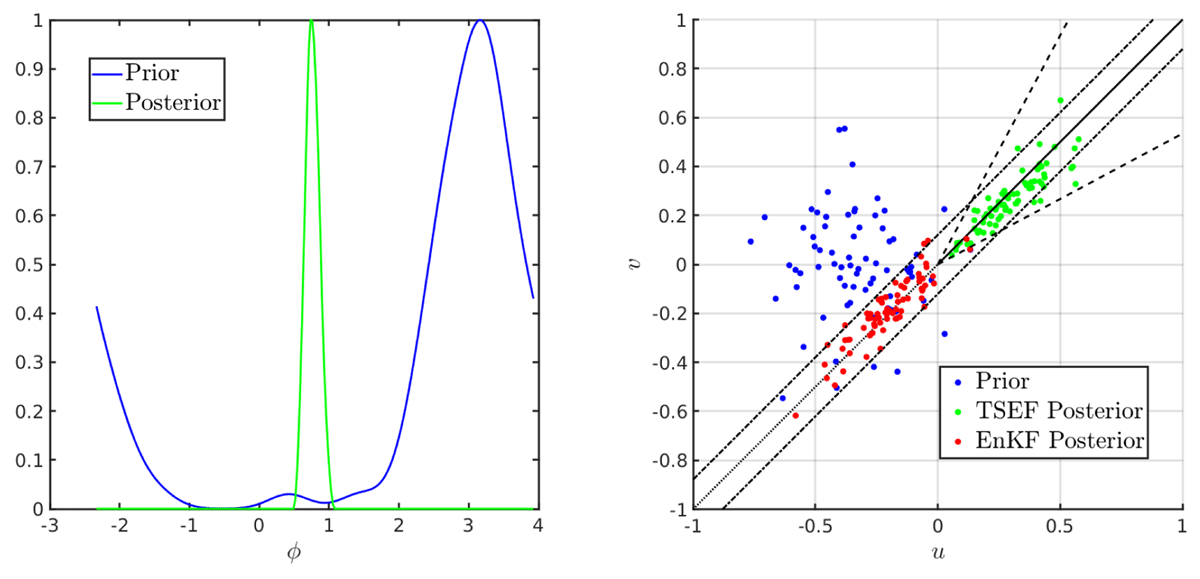
Figure 2
Left: The prior (blue) and posterior (green) pdfs of angle ϕ. Both are normalized to have unit maximum height so their shapes can be compared more easily. Right: A prior ensemble of wind vectors (blue), together with the posterior ensemble of wind vectors produced by the probability integral transform approach (green) and the EnKF approach (red). The solid black line is in the direction of the observed wind; the dotted black line is opposite to the direction of the observed wind; the dashed lines enclose the directions with nonzero likelihood; and the dash-dotted lines enclose the 95% confidence interval associated with the EnKF observation model.
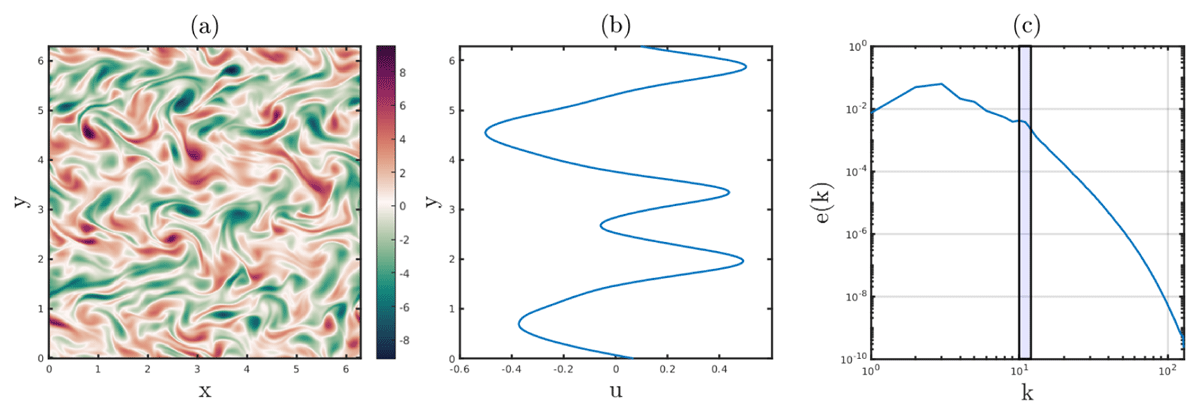
Figure 3
Properties of the reference experiment. (a) A snapshot of vorticity ω. (b) The time-mean and zonal-mean velocity profile. (c) The kinetic energy spectrum; the range of forcing wavenumbers is shaded. All variables are nondimensional.
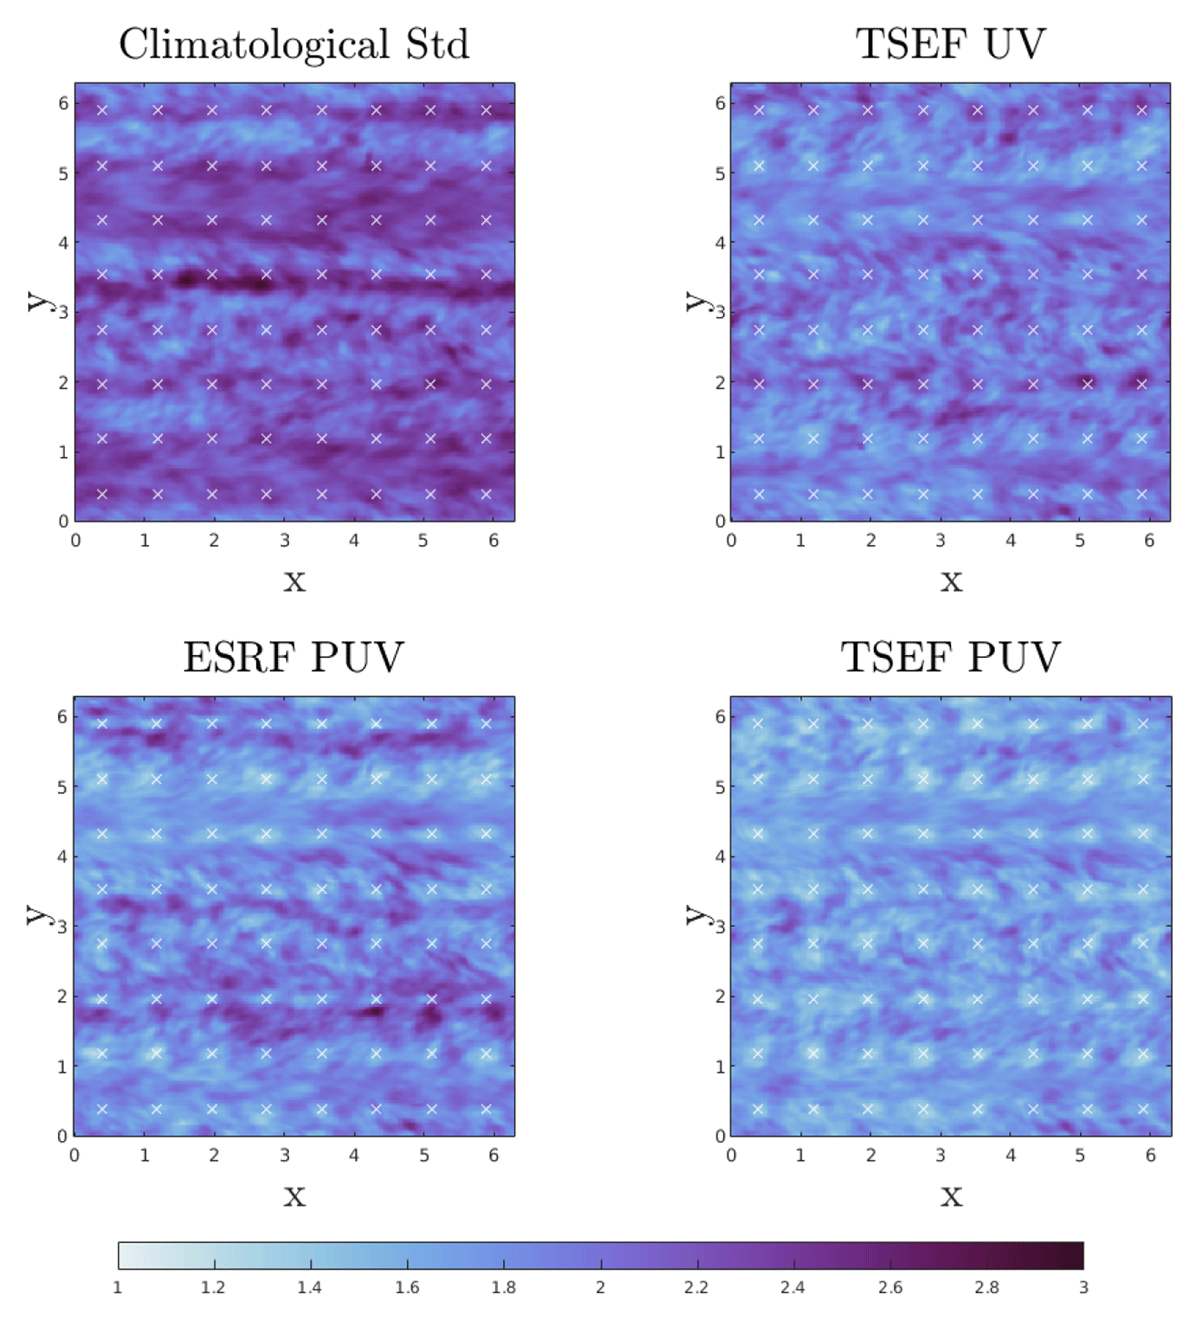
Figure 4
Upper left: Local standard deviation of climatological variability in the reference simulation vorticity. Upper Right: RMSE for the TSEF filter assimilating only wind direction. Lower Left: RMSE for the ESRF filter assimilating geostrophic streamfunction and wind direction. Lower Right: RMSE for the TSEF filter assimilating geostrophic streamfunction and wind direction. The white crosses in each figure are the locations of the observations.
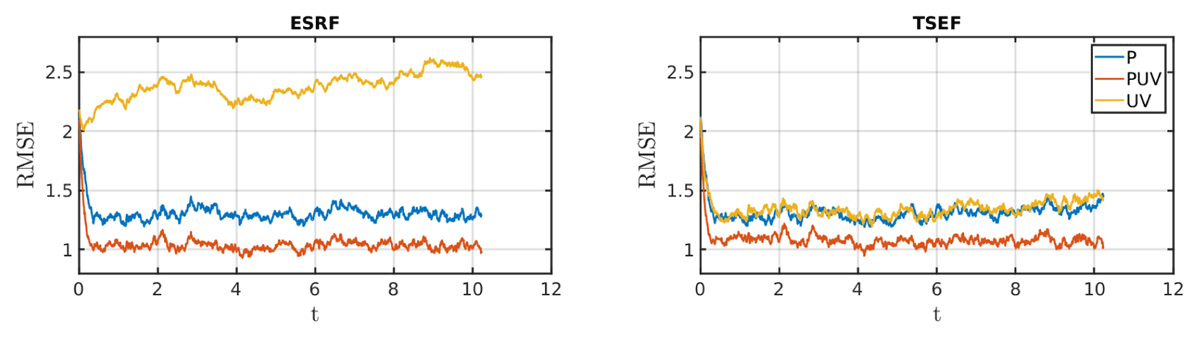
Figure 5
Time series of RMSE for the ESRF (left) and TSEF (right) filters with random observation locations. In the legend, P denotes experiments assimilating only observations of pressure, PUV denotes experiments assimilating observations of pressure and wind direction, and UV denotes experiments assimilating only observations of wind direction. The climatological standard deviation of vorticity is 2.17, for reference.