
Corrections
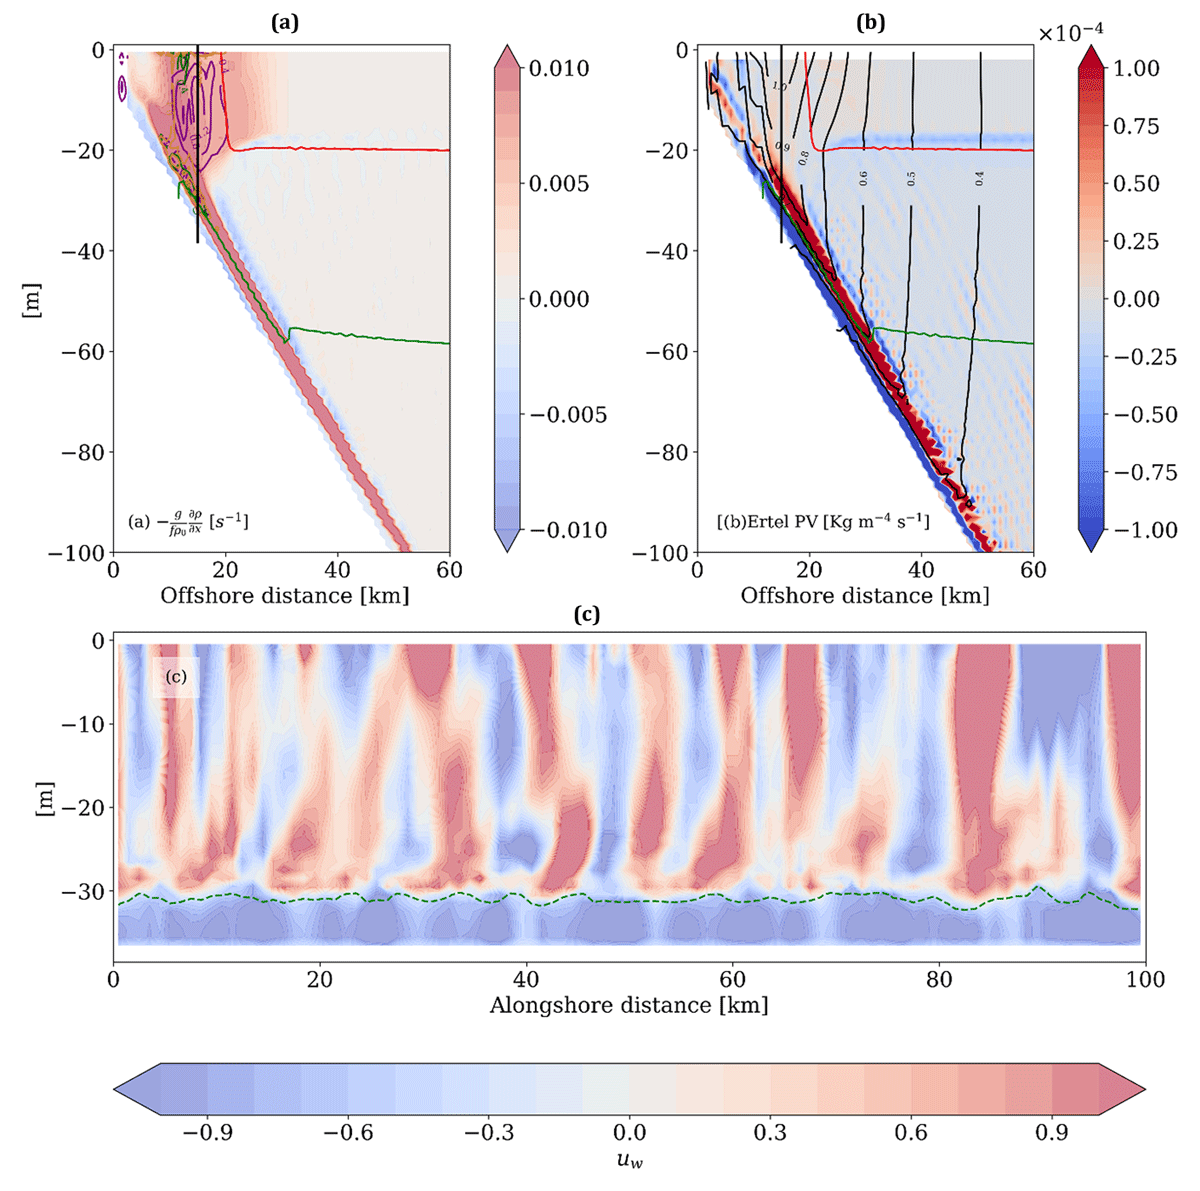
The article ‘Dynamics of Upwelling and Downwelling in a Channel Basin of the Baltic Sea’ (Masini, et al., 2025) was published with an error in Figure 7 (p. 52) and Figure 8 (p. 53). The following changes have been made:
The order of the two figures has been switched;
The field in panel b) of both figures has been corrected by multiplying by a constant value;
The units reported in panel b) labels have been corrected.
In the caption of the new Figure 7 item ‘b)’ has been updated.
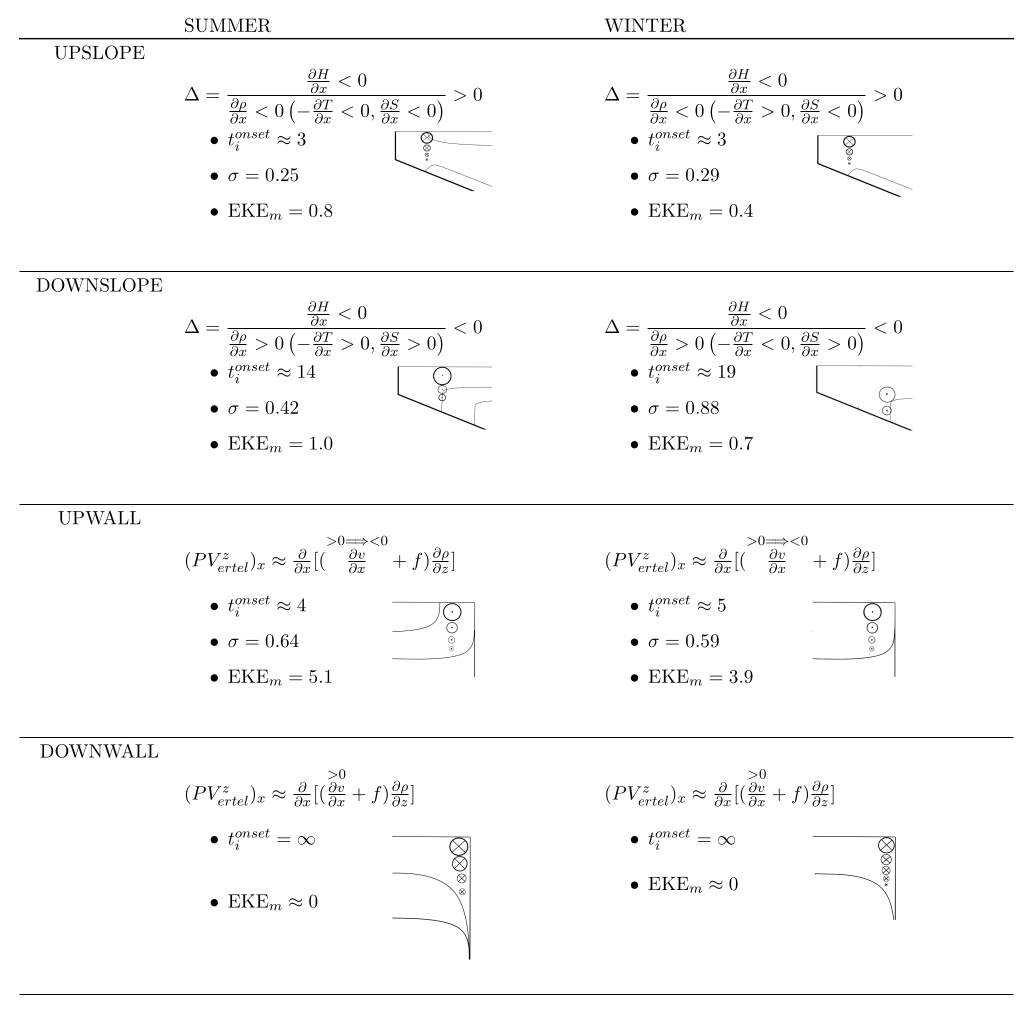
Figure 4 has also been corrected and text added to the caption.
Corrected Caption Figure 7
Instability diagnostics after the onset of instability (ti = 6) for UPSLOPE, summer. (a): Thermal wind overlapped with contours of cpe (purple lines) and cmke (green lines). Contour lines show the interval (0.4, 1.6) · 10–8, with every interval given by 0.4 · 10–8. Thermocline and halocline are given by the dashed red and green lines, respectively. The vertical solid black line marks the frontal jet location alongshore section in (c) is taken. (b) PV field superimposed on the contours of alongshore velocity (coastal jet; black lines). (c) Alongshore section of normalized cross-shore velocity uw at the frontal jet location (black solid line in (a)).
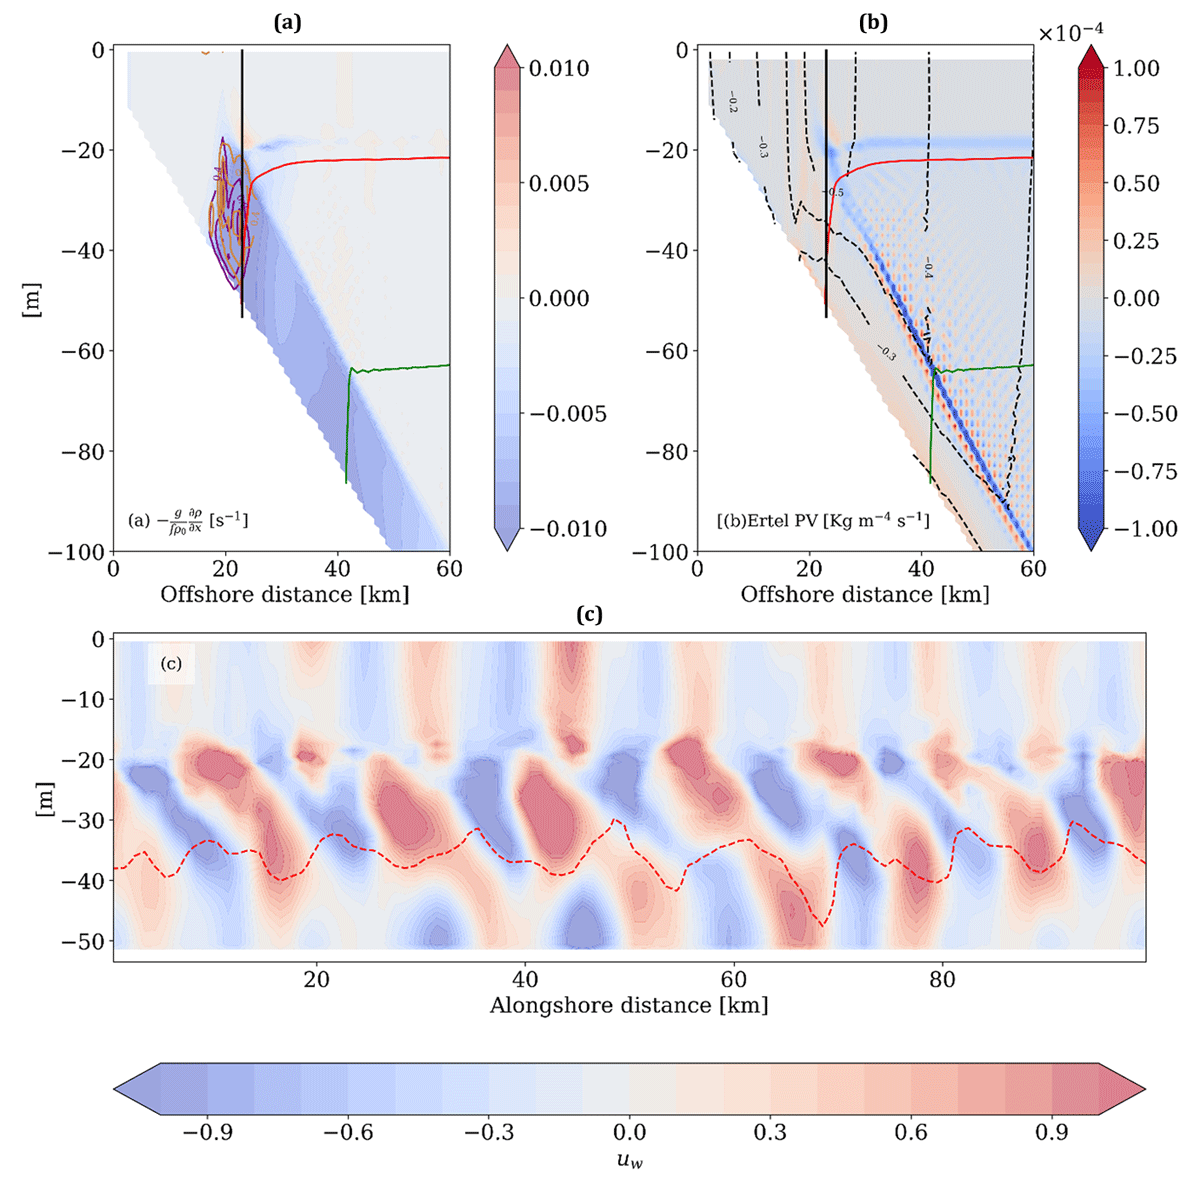
Figure 8
Same as Figure 7 but for DOWNSLOPE, summer, ti = 18.
The errors are only in the figures, and they do not alter the results.
The new versions of Figures 7 and 8 are shown below.
In the caption of Figure 7 the following change has been made:
(b) PV field contours of alongshore velocity (coastal jet; black lines).
is now
(b) PV field superimposed on the contours of alongshore velocity (coastal jet; black lines)
Figure 4 has the following edits:
PVertel needs to be substituted with the (PVz ertel)x because we are showing and discussing only the x-gradient (cross-shore) of the vertical Ertel PV in the image.
∂v/∂z needs to be substituted with the ∂v/∂x which is the correct term in the vertical vorticity ξz = ∂v/∂x – ∂u/∂y ≈ ∂v/∂x to be considered for computing the vertical Ertel PV.
the following sentence is added at the end of the caption in Figure 4: “Signs in the brackets in the bottom two rows (PV gradient condition) refer to the sign of the cross-shore PV gradient.”
Corrected Caption Figure 4
A schematic summary of the instability diagnostics for the different model configurations. EKE is given in 10–6 m2 s–2. Growth rate in day–1. See text for details. Signs in the brackets in the bottom two rows (PV gradient condition) refer to the sign of the cross-shore PV gradient.
A correction has also been made to the affiliation of author Masini, M. where the country ‘Italy’ has been corrected to ‘Sweden’.