
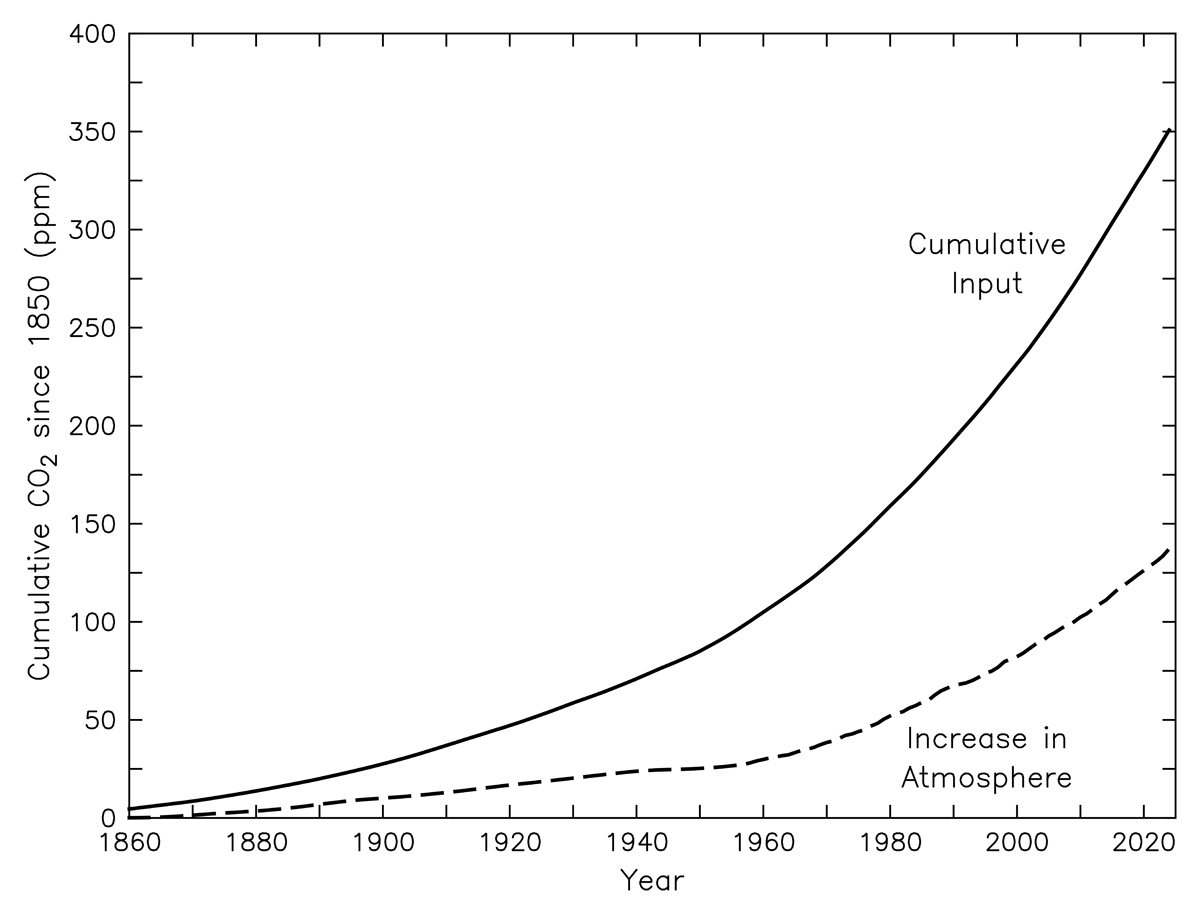
Figure 1
An estimate of the input of anthropogenic CO2 into the atmosphere and the increase of atmospheric CO2 since the mid-nineteenth century; units are in ppm. Updated from Keeling (1970).
Table 1
Global carbon budget in 1990, when the first IPCC report was published (IPCC, 1990), and now, in the latest global carbon budget report (Friedlingstein et al., 2026). All values are decadal averaged, in GtCyr–1. Fractions of total emissions are also shown (in %).
| 1980–1989 | FRACTION (%) | 2015–2024 | FRACTION (%) | |
|---|---|---|---|---|
| Fossil emissions | 5.4 ± 0.5 | 77 ± 14 | 9.8 ± 0.5 | 88 ± 8 |
| Land use change emissions | 1.6 ± 1.0 | 23 ± 15 | 1.4 ± 0.7 | 13 ± 6 |
| Accumulation in the atmosphere | 3.4 ± 0.2 | 49 ± 8 | 5.6 ± 0.02 | 50 ± 4 |
| Uptake by the ocean | 2.0 ± 0.8 | 29 ± 8 | 3.2 ± 0.4 | 29 ± 4 |
| Uptake by the land | 1.6 ± 1.4 | 23 ± 20 | 2.4 ± 0.8 | 21 ± 7 |
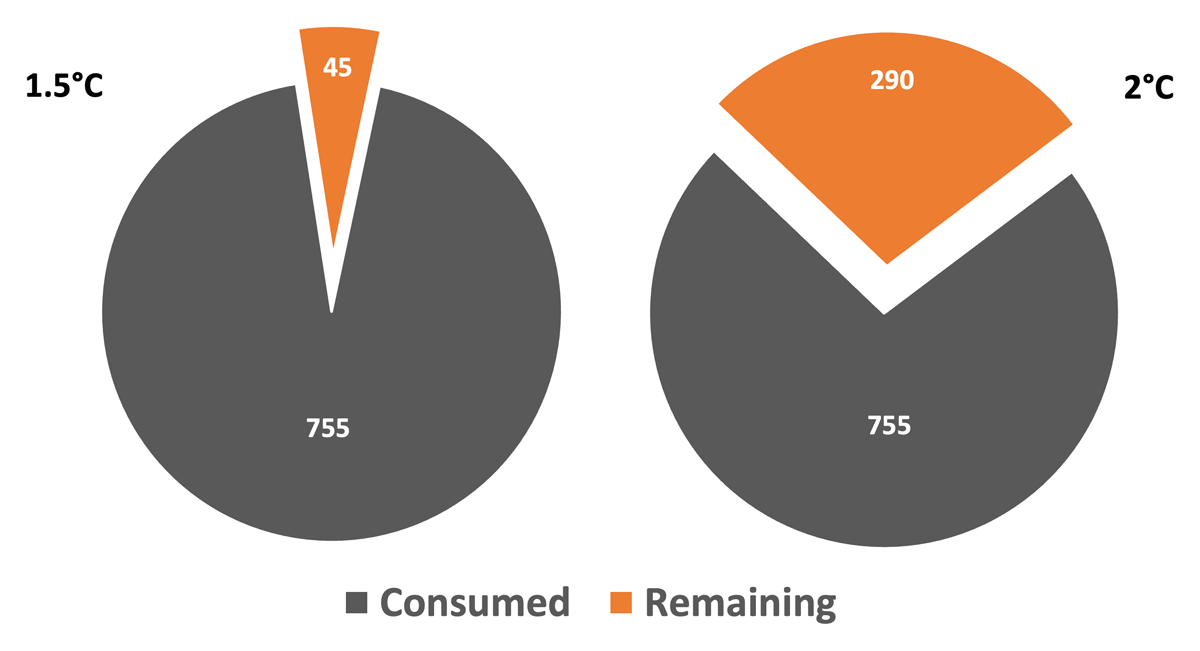
Figure 2
The remaining carbon budget for limiting warming to 1.5°C and 2°C above pre-industrial levels; units are in GtC. Adapted from Friedlingstein et al. (2026).