
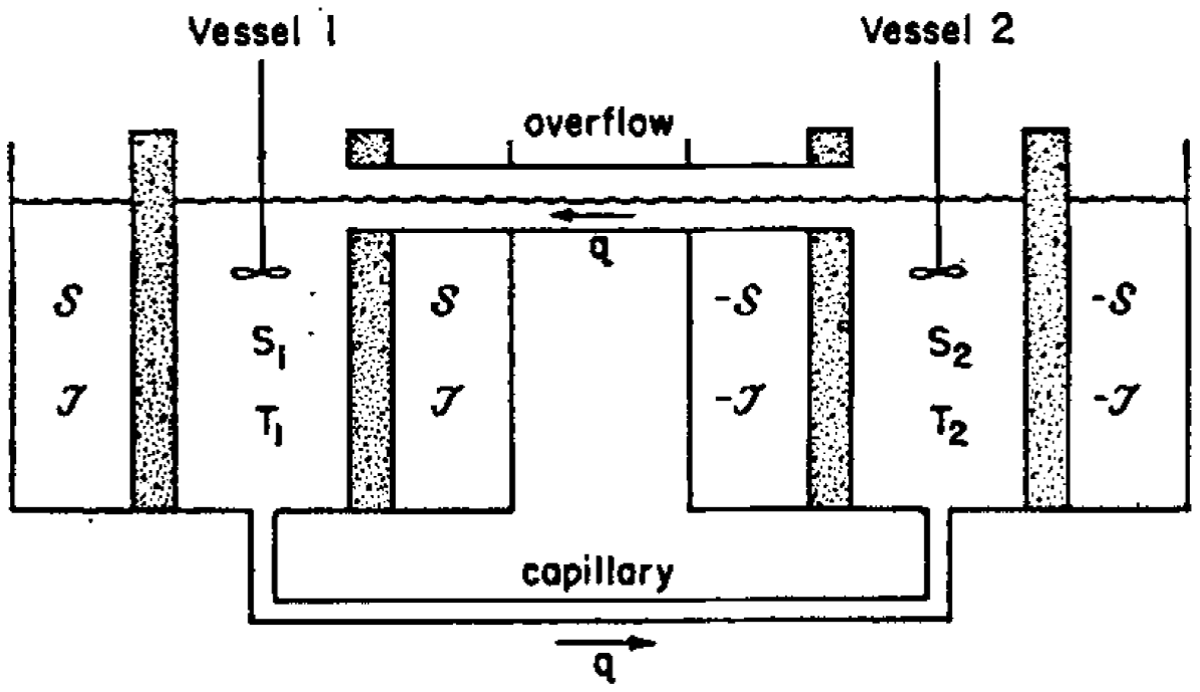
Figure 1
Sketch of the original two-box model by Stommel (1961). The original caption reads (p. 227): “Two vessel experiment, with rate of flow, q, through capillary determined by the density difference between the two vessels. The upper overflow is provided so that the surface level in each vessel remains the same. The density difference between the two vessels depends on the flow rate as well as the nature of the transfer through the walls.” Reproduced from Stommel (1961) under CC BY, https://doi.org/10.3402/tellusa.v13i2.9491.
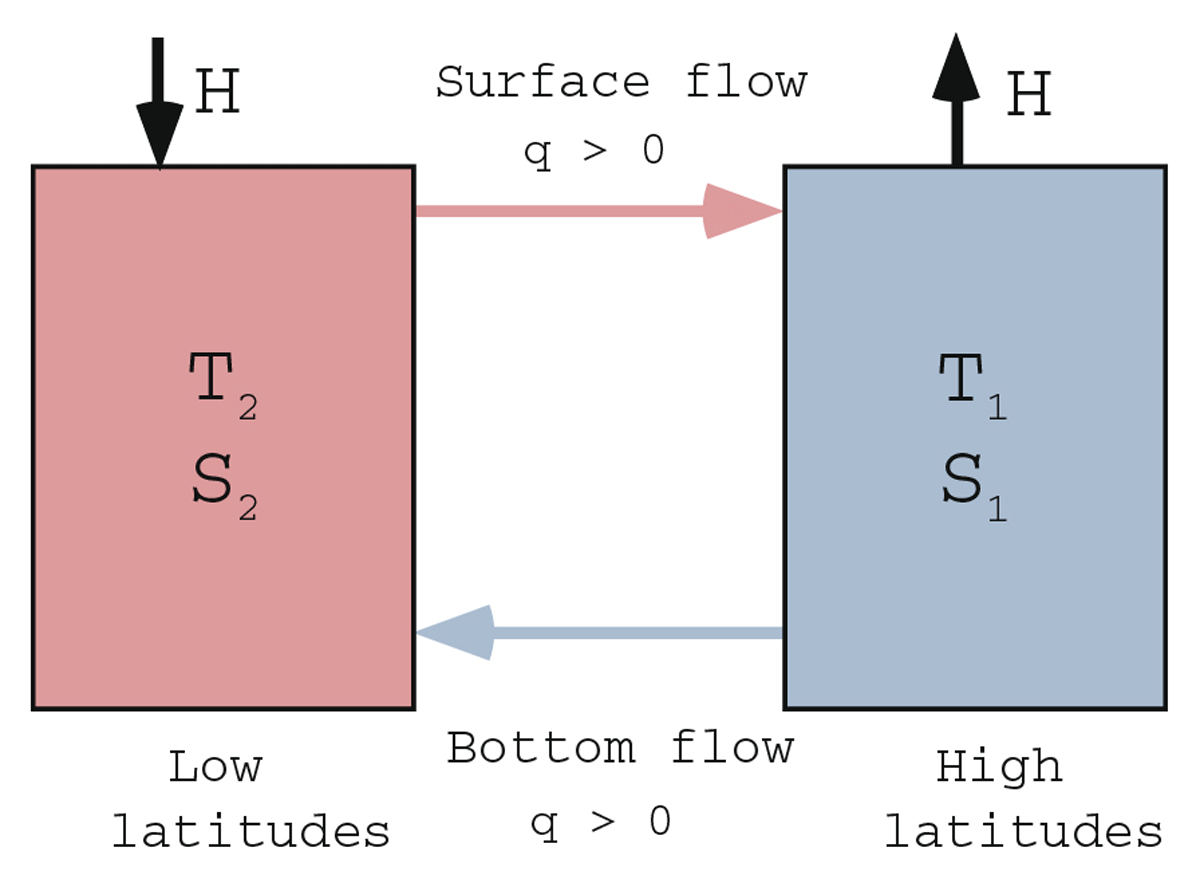
Figure 2
Stommel’s conceptual model of the THC, as simplified by Marotzke (1990); see text for definitions. Note that the q > 0 flow direction is defined opposite to the original choice in Stommel (1961), see Figure 1.
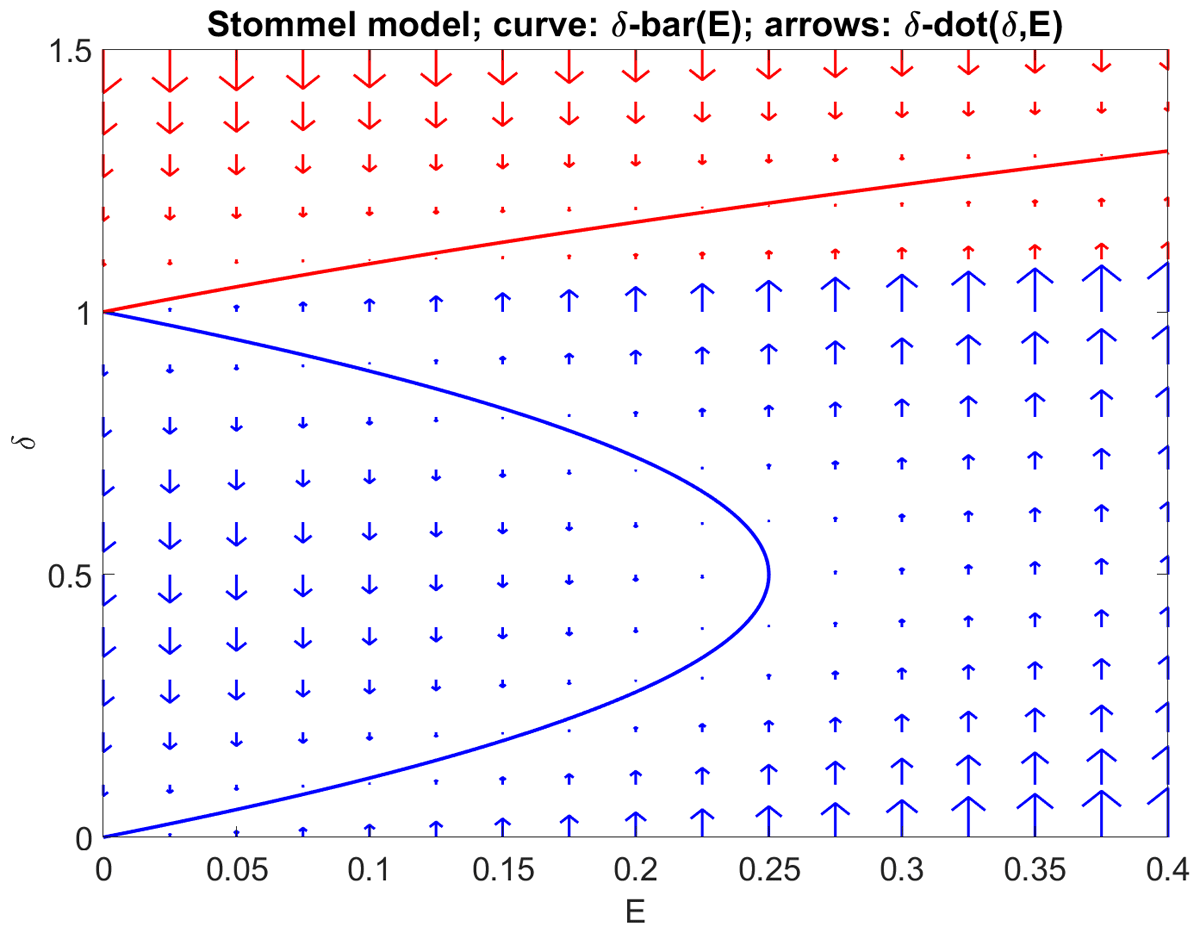
Figure 3
Solution portrait of the box model defined by (12) in phase space defined by dimensionless salinity difference δ and dimensionless surface salinity flux E. The curves mark the equilibrium solutions, while the arrows show the tendencies in phase space. Positive q-branches in blue; negative q-branch in red. Note the existence of three equilibria for E < 0.25.
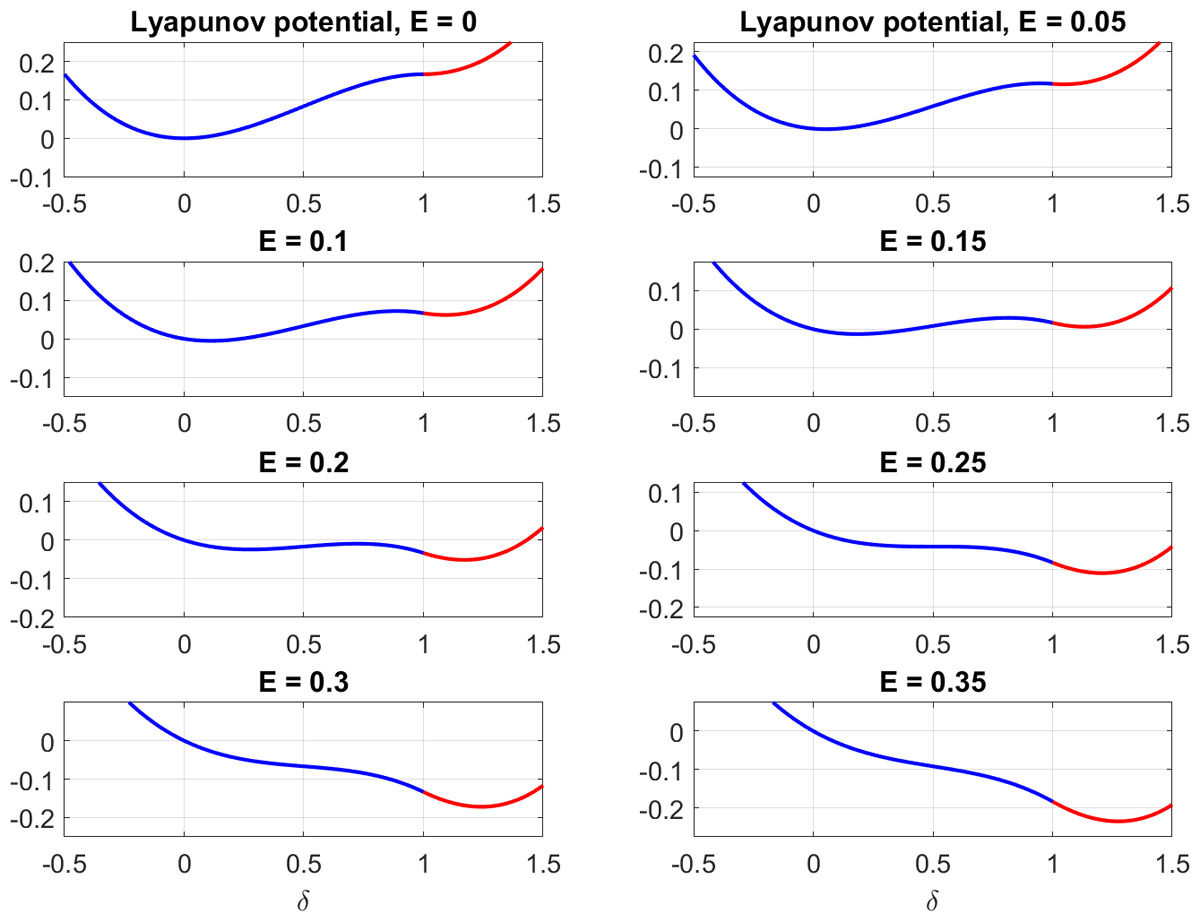
Figure 4
Lyapunov potential as defined by (16) and (17), for a variety of choices for E. Positive q-branch in blue; negative q-branch in red.
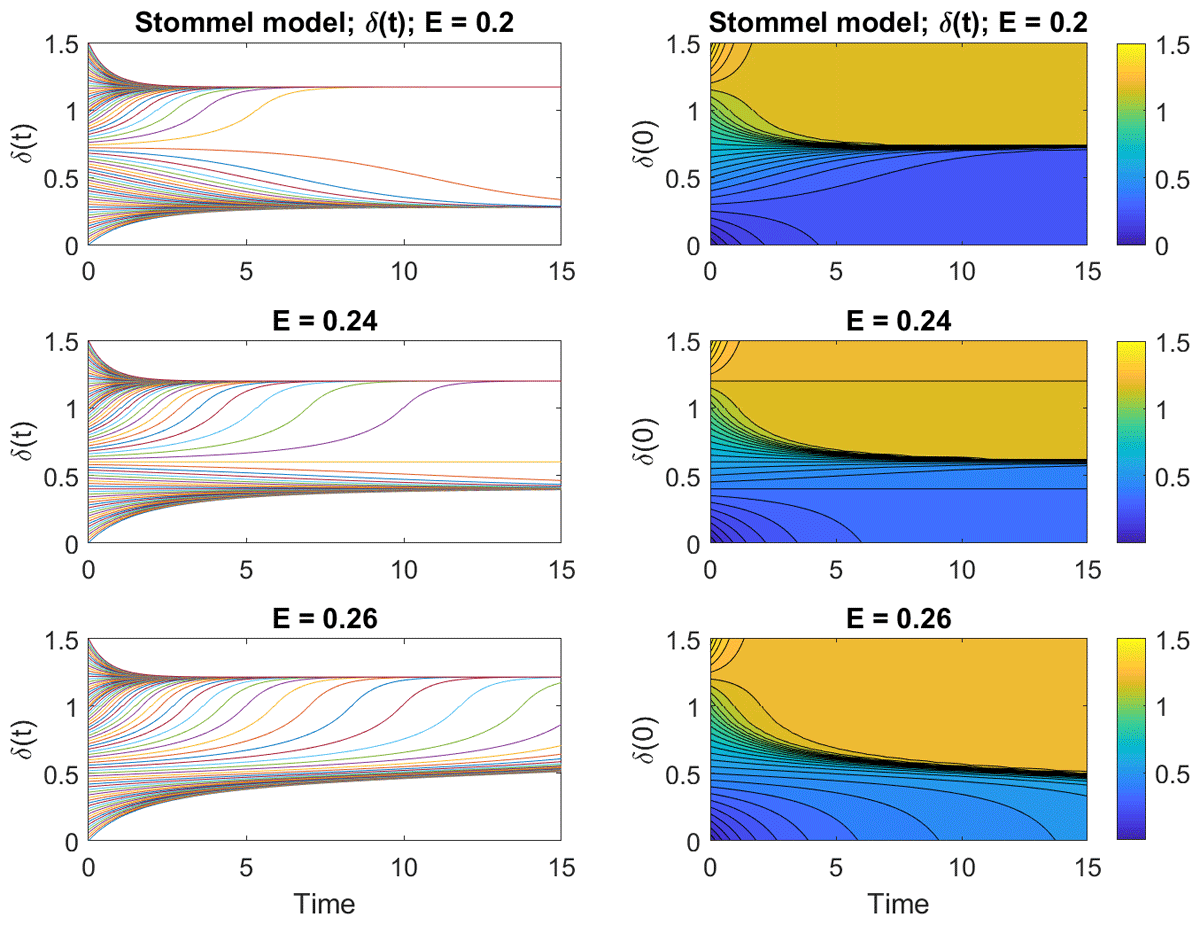
Figure 5
Exact solutions (18) and (19) as a function of dimensionless time and initial conditions. Left column: Time series of solutions. Right column: Contour plot of solutions.
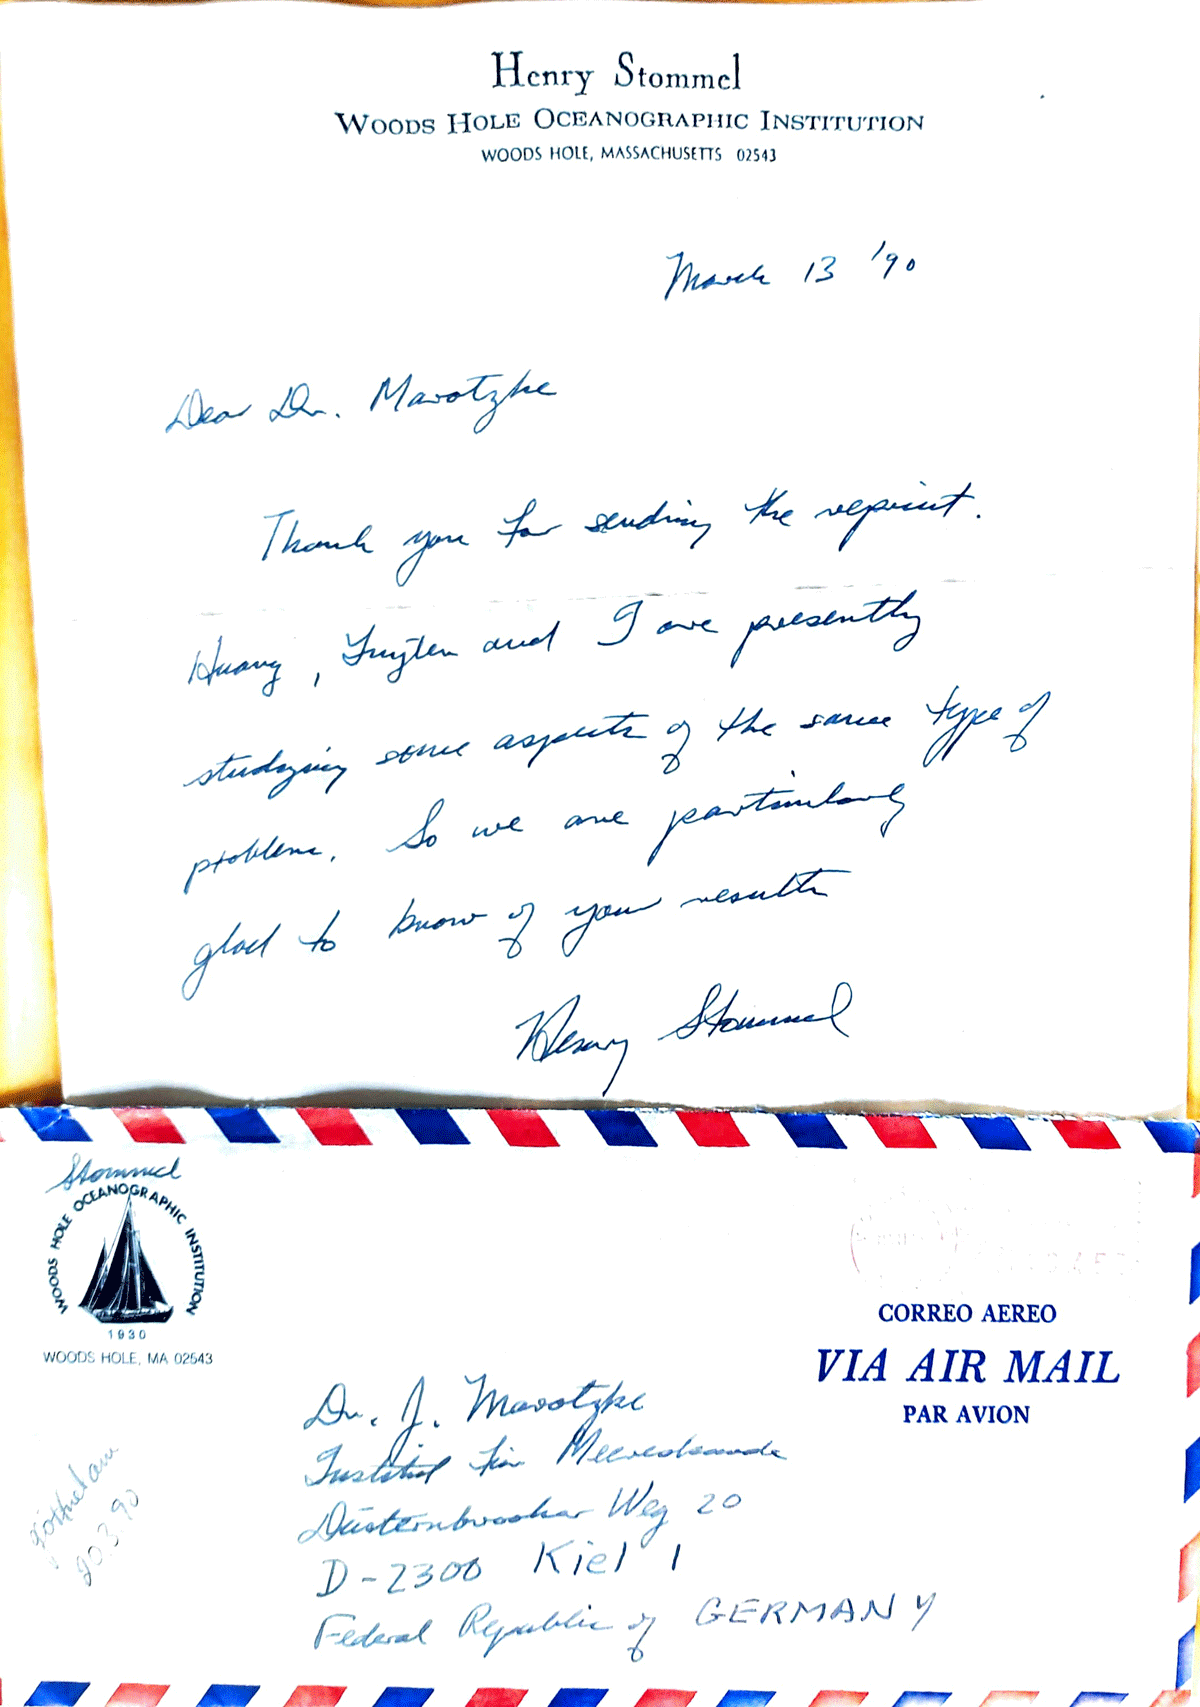
Figure 6
Henry Stommel’s letter thanking for a reprint of Marotzke (1989). The paper mentioned by Stommel later appeared as Huang, Luyten, & Stommel (1992).