
1 History of Land-Use Change
Human land-use change (LUC), rooted in the expansion of agriculture and resource use over millennia, has become a major driver of both climate change and climate-change mitigation. Since its inception some 10,000 years ago, agriculture has spread across the globe as populations grew and people and knowledge migrated, only slowing in some regions in particular in times of epidemics or wars. Over time, agriculture and the use of forest resources, for instance for construction or smelting, became massive forces in altering the landscape and depleting natural resources. Impressed by this, Hans Carl von Carlowitz introduced the concept of sustainability as the long-term responsible use of natural resources in his book ”Sylvicultura oeconomica” in 1713. What began as local landscape modification has become a globally significant driver of environmental change, expanding massively over time (Figure 1, top) and nowadays affecting three-quarters of the ice-free land surface (Luyssaert et al., 2014).
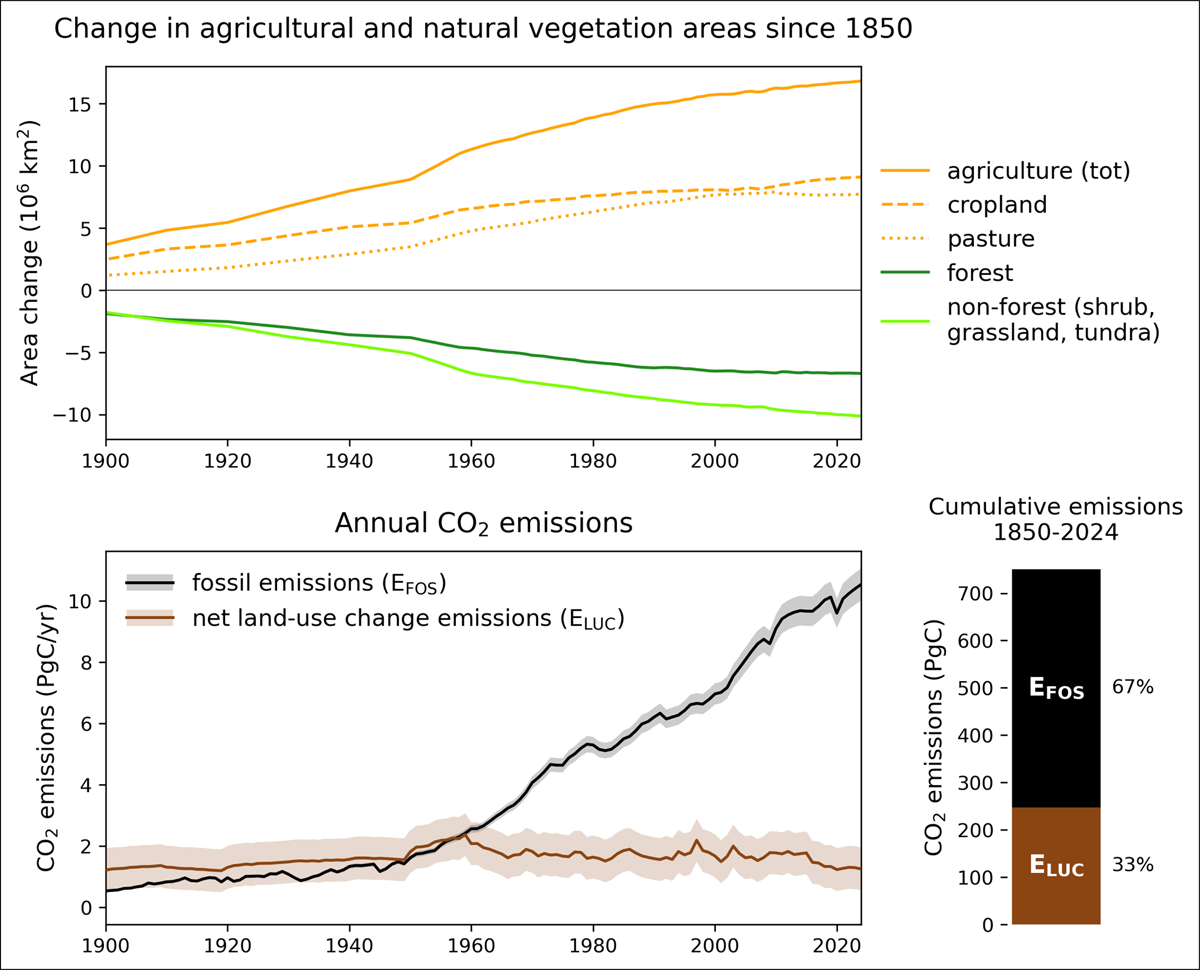
Figure 1
Top: evolution of agricultural land (divided into cropland and pasture) and natural land cover relative to 1850. Bottom: annual net land-use change flux (ELUC) and fossil emissions (EFOS), with cumulative numbers since 1850 (bar plot on the right); data are from the Global Carbon Budget 2025 (GCB2025). Shading indicates the uncertainty range according to GCB2025
LUC may alter local temperatures by up to several degrees Celsius as it influences the exchanges of water, energy and momentum between land and the atmosphere (e.g., Alkama and Cescatti, 2016; Winckler et al., 2017), which may even affect global atmospheric and oceanic circulation patterns (e.g., McGuffie et al., 1995; Portmann et al., 2022)—the so-called biogeophysical effects (Bonan et al., 1992; Claussen et al., 2001). LUC is also a massive driver of global climate change via biogeochemical effects, i.e., influences on the carbon and nutrient cycles. For example, deforestation and drainage of peatlands release CO2 to the atmosphere, whereas afforestation, reforestation, and sustainable forest management can act as CO2 sinks. In particular, via these biogeochemical mechanisms, LUC has become an integral part of pathways toward mitigating climate change: most scenarios compatible with the Paris Agreement assume large-scale carbon dioxide removal (CDR) (Babiker et al., 2022). 99.9% of current CDR is provided by land-use such as re-/afforestation and forest management (Pongratz et al., 2024). Additionally, countries have pledged to re-/afforest more than a billion hectares of land (Dooley et al., 2025). In addition to sequestering carbon during regrowth, forests play a crucial role in mitigation also because they often respond beneficially to increases in atmospheric CO2 (Walker et al., 2020). At the same time, however, climate change increasingly puts forests at risk, as disturbances such as fires, droughts, or pests become more frequent or intense in many parts of the world (Anderegg et al., 2020).
Given the high relevance of LUCs for climate change, climate policy, and the future state of the Earth system, we review in this article the progress made in assessing the impacts of LUC on the global carbon cycle and provide recommendations for future research. In particular, the interactions of land-use with environmental changes will become increasingly more relevant as climate change progresses. To date, these interactions have been understudied. This perspective argues that these interactions are no longer a secondary accounting detail but a central determinant of (i) historical carbon budgets, (ii) reconciliation between global and national accounting frameworks and consistency within budgets, and (iii) the effectiveness and risks of land-based mitigation in the future.
In this article, we investigate LUC and its interaction with environmental changes from the perspective of its relevance to the global carbon cycle. While all LUC occurs within specific local environmental settings, we focus here on the globally integrated picture that is directly relevant for designing global mitigation pathways, identifying levers for global emission reduction and assessing the persistence of the future land sink. Furthermore, we provide conceptual guidance on the treatment of interaction terms that is applicable independent of spatial scale.
2 History of Modeling Land-Use Change Impacts
Land use relates to the purposes or functions that humans assign to a given piece of land and how humans interact with it. It is typically categorized in broad classes (e.g., forestry, grazing, cropping), within which various land-use practices (land management) take place (e.g., fertilizing, harvesting, thinning). LUC refers to either conversions among broad land-use classes (e.g., agricultural expansion) or changes in land management within these classes (e.g., agricultural intensification). Both types of LUCs can result in conversions of land cover (e.g., from forest to grassland, clear-cut harvest) as well as in more subtle changes in ecosystem properties (e.g., forest degradation) (Pongratz et al., 2017). The early scientific pre-occupation with only changes in forest cover has been found to be misleading, as more and more studies demonstrate that the presumably subtle effects of land management on surface climate and biogeochemical cycles are actually comparable to the effects of changes in forest cover (Arneth et al., 2017; Erb et al., 2017; Luyssaert et al., 2014). Furthermore, land management occurs on about twice as much area as land conversion (Luyssaert et al., 2014).
Recognizing the importance of LUC for the Earth system, Earth system science has pushed toward understanding and quantifying the effects of LUCs, especially with regard to climate variability and changes in the carbon cycle. To be able to disentangle the signal from natural variability and other forcings—often impossible in Earth observations—Earth system science turned to modeling. The first study investigating climate impacts of deforestation with a general circulation model (GCM) determined that the global pattern of LUCs required spatial resolution, which was not provided by the early zonally averaged models (Henderson-Sellers and Gornitz, 1984). GCMs were later extended by adding carbon-cycle and other biogeochemical processes to form Earth system models (ESMs), which are able to account for CO2 fluxes related to LUC. Since the Coupled Model Intercomparison Project Phase 5 (CMIP5) (Brovkin et al., 2013), LUC has been routinely included in ESMs that underlie the Assessment Reports of the Intergovernmental Panel on Climate Change (IPCC). Several studies isolated land-use impacts from other forcings (e.g., Amali et al., 2025; Boysen et al., 2014) showing that the CO2 impacts of LUC dominate at global scale, while biogeophysical effects predominate at local and regional scales. However, biogeophysical effects can also have important global consequences, not least through remotely induced changes in the carbon cycle (Guo et al., 2025).
The land surface modules of ESMs and dynamic global vegetation models (DGVMs, several of which are used as land surface modules of ESMs) explicitly resolve processes like photosynthesis, respiration, and the link between carbon, water, and energy. They thus are able to quantify how carbon fluxes react to environmental changes, such as increasing atmospheric CO2 concentrations, impacts of anthropogenic climate change, and nitrogen deposition. The first multi-model DGVM study considering LUC in historical simulations (McGuire et al., 2001) showed a transition of global terrestrial carbon stocks from a source to a sink in the course of the 20th century, suggesting that the overall beneficial effect of rising CO2 on plant growth has gradually overcompensated the emissions from LUC. In other words, the “net land-atmosphere flux,” which is the terrestrial term directly relevant for the atmospheric CO2 concentration, is now a substantial sink globally. This pioneering work has since been continued by the TRENDY project (Sitch et al., 2015, 2024), which vastly expanded the DGVM numbers.
In parallel to the development of process-based models and long before those included biogeochemical land-use effects, fundamental progress was made by the development of a semi-empirical modeling approach for estimating CO2 emissions and removals from LUCs, pioneered by Houghton et al. (1983). This “bookkeeping approach” of annual CO2 emissions covered a wide range of land-use conversions and practices (e.g., wood harvesting) at regional resolution. It also resolved carbon fluxes over time, accounting for different timescales, e.g., the slow regrowth of forest or long-lasting decomposition of woody litter and wood products. To do so, bookkeeping models (BMs) track the carbon stored in vegetation and soils before and after a LUC event (transitions between various natural vegetation types, croplands, and pastures), where each vegetation type is assigned specific literature-/observation-based carbon stocks it would reach in equilibrium. Response curves describe the decay of vegetation and soil carbon, including carbon transfer to wood product pools of different lifetimes, as well as carbon uptake due to regrowth. In addition, BMs capture the long-term degradation of primary forests to secondary forests with lowered standing vegetation, consider soil carbon stocks, and include forest management practices such as wood harvests. Houghton et al. (1983) estimated the net CO2 flux from LUC to be 180 (range 135–228) PgC cumulatively over 1860–1980, with important updates in the Tellus studies of 1987, 1999, and 2003 (Houghton et al., 1987; Houghton, 1999, 2003).
As LUC and environmental responses began to be simulated simultaneously in models, it became apparent that some carbon fluxes could not be uniquely attributed to direct land-use versus environmental drivers. Interaction terms were treated inconsistently across assessments (Friedlingstein et al., 2025; Obermeier et al., 2025), leading to double-counting and omission of fluxes and obscuring their complexity and potentially divergent future behavior. This highlights the need for an explicit assessment of these land-use–environment interactions as well as consistent accounting frameworks.
3 Quantification of Land-Use Change CO2 Fluxes
3.1 Assessing land-use change impacts on the global carbon cycle
The bookkeeping estimates by Houghton (later estimates by Houghton and Nassikas (2017); Houghton and Castanho (2023)) provided the LUC emissions and removals since the inception of the Global Carbon Budget (GCB) (Friedlingstein et al., 2026; Le Quéré et al., 2013). These were later complemented by estimates from the BLUE model (Hansis et al., 2015)—the first spatially explicit BM—in 2017, the OSCAR model (Gasser et al., 2020)—a simple ESM that also provides bookkeeping capabilities—in 2020, and the LUCE model (Qin et al., 2024) in 2024. The latest GCB of 2025, using the latter three bookkeeping estimates, quantifies the net flux of emissions and removals through LUC (ELUC) as 1.4±0.7 PgC/yr in 2015-2024, with cumulative emissions of 250±60 PgC over 1850–2025. ELUC is the most uncertain term in the GCB in relative terms, with about 0.7 PgC/year uncertainty (Friedlingstein et al., 2026). Uncertainties are mainly attributed to the quality of land-use data, incomplete process consideration, and the lack of observational constraints on model parameters (Obermeier et al., 2025; Pongratz et al., 2021). Improvements in these regards have thus led to continuous revisions of ELUC over the course of time (Figure 2).
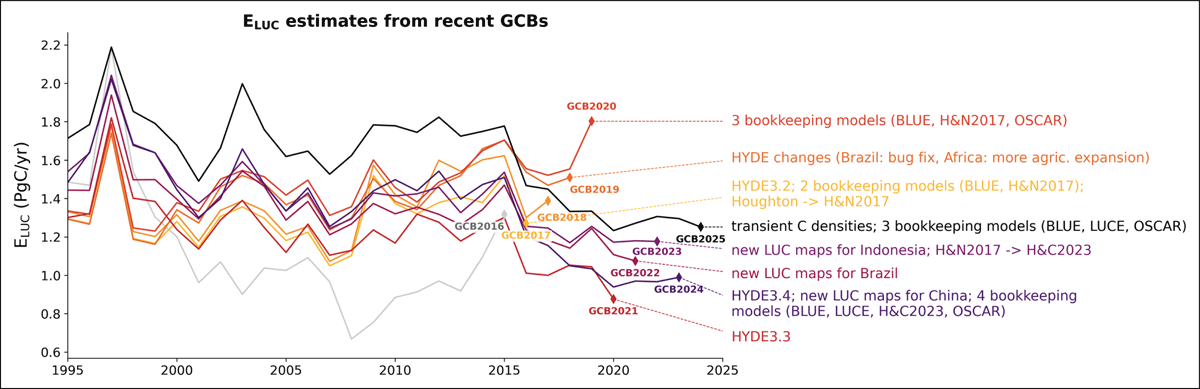
Figure 2
Net emissions from land-use change (ELUC) as estimated by different versions of the Global Carbon Budget (GCB). The text on the right mentions the most important changes introduced for different GCB versions since 2016. These include the use of different models and model versions (for model references see text), successive integration of regionally specific land-use change (LUC) maps, general updates in the global land-use reconstruction dataset HYDE (History Database of the Global Environment; denoted by different version numbers), and the inclusion of effects of environmental changes on carbon densities (as of GCB2025).
For centuries, land-use provided a stronger climate forcing than natural processes and drove the pre-industrial CO2 increase after the Little Ice Age at the end of the 18th century (Reick et al., 2010). While LUC emissions today are an order of magnitude smaller than fossil emissions, their cumulative emissions over a long history (Figure 1, bottom) make their impact on climate substantially larger. LUC has contributed about one third of total historical anthropogenic CO2 emissions (Friedlingstein et al., 2026) and made a similarly large contribution to global warming (Jones et al., 2023; Pongratz and Caldeira, 2012). Until the 1950s, LUC even dominated over fossil emissions (Figure 1, bottom). Over time, a substantial carbon deficit (i.e., a deviation from the potential natural state) in vegetation and soils accumulated due to LUC, driven by both land cover change and land management (Erb et al., 2017; Ganzenmüller et al., 2025; Sanderman et al., 2017). While historically contributing to global warming, this deficit also creates the potential for recovery of carbon through various processes, including ecosystem restoration and CDR efforts.
Today, CO2 emissions from LUC arise primarily from tropical deforestation—with Brazil, Indonesia, and the Democratic Republic of the Congo together contributing 57% of the net LUC emissions (Friedlingstein et al., 2026). Deforestation emissions remain approximately twice as large as global CO2 removals through re- and afforestation (Figure 3), which occur foremost in China, Europe, and the United States (Pongratz et al., 2024). These findings emphasize the need to both stop deforestation and to (re-) create forest areas to reach net-zero and negative CO2 emissions. Considering that current deforestation threatens some of the last pristine and highly biodiverse ecosystems, and that large-scale afforestation may impose larger risks than reducing emissions, any net-zero emission target should also aim at reducing gross fluxes. Ending gross forest loss has also been shown to provide higher mitigation efficiency than ending only net forest loss (Gasser et al., 2022).
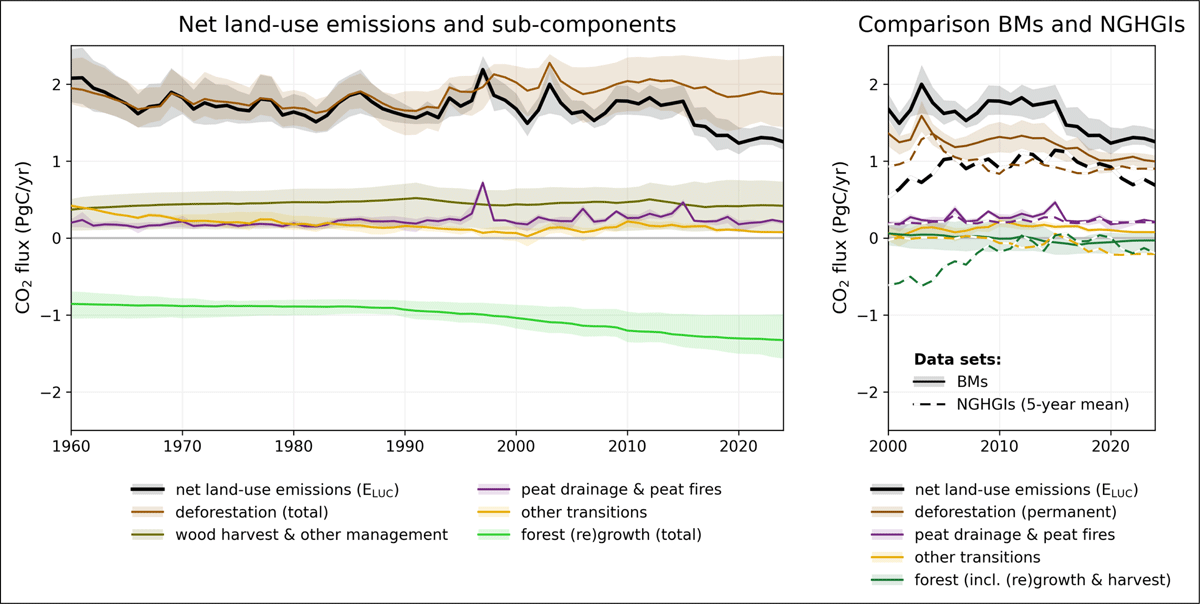
Figure 3
Components of the net land-use change CO2 flux (ELUC). The left panel shows an ELUC decomposition focused on drivers; estimates are derived from three bookkeeping models (BMs, as in the Global Carbon Budget 2025, Friedlingstein et al. (2026)). The right panel shows a decomposition and – for forests – a translation of the bookkeeping estimates that matches the definition of fluxes as used by the national greenhouse gas inventories (NGHGIs; which follow IPCC guidelines and thus include all CO2 fluxes on managed land). Sub-component fluxes are (i) emissions from deforestation (including permanent deforestation and deforestation in shifting cultivation cycles in the left panel, and including only permanent deforestation in the right panel), (ii) emissions from peat drainage and peat fires (same in both panels), (iii) emissions and removals related to other land-use transitions (same in both panels), (iv) removals from forest (re)growth (including forest (re)growth due to afforestation and reforestation and forest regrowth in shifting cultivation cycles) in the left panel, (v) fluxes from wood harvest and other forest management (comprising slash and wood product decay following wood harvest and regrowth after wood harvest) in the left panel, and (vi) forest flux (forest (re)growth and other forest management including the natural land sink in managed forests) in the right panel.
3.2 Modeling land-use change–environment interactions
Although research has addressed vegetation-carbon cycle interactions for decades, the research on land-use impacts and on changes in the natural land sink has been largely independent.1 The global terrestrial biosphere was early recognized not just as a carbon pool but also as a CO2 sink (Keeling, 1973), offsetting part of the anthropogenic emissions at the global scale. The sink was mainly attributed to enhanced plant growth caused by increasing atmospheric CO2 concentrations, the “CO2 fertilization” effect (Bacastow and Keeling, 1973). Interactions between the natural and anthropogenic changes of the land biota have not yet received much attention. Instead, the main focus other than on the natural land sink has been on the emissions of CO2 from LUC. Plass (1956) may have been the first to point out that CO2 emissions from land-use activities, such as forest clearing and peat drainage, are important in addition to fossil emissions, which were first quantified in 1894 (Högbom, 1894). The first estimate of emissions from LUC (70±30 PgC cumulatively since the early 19th century) stems from Bolin (1977). It delivered no temporal and little spatial resolution and was soon afterwards superseded by the detailed bookkeeping modeling (Houghton et al., 1983).
The integration of LUCs in DGVMs and ESMs established alternatives to the bookkeeping approach for quantifying the net CO2 flux from LUC. With them came the blessing and the curse of including the response of vegetation to environmental changes, such as the CO2 fertilization effect. The curse arose from the early unawareness of the complexity of land-use–environment interactions and the resulting need for clear definitions distinguishing between direct anthropogenic versus indirect anthropogenic and natural causes. Pongratz et al. (2014) identified and translated nine different definitions used in the published literature until then, where inconsistencies in attribution amounted to a similar magnitude as the land-use emissions estimated by BMs. The blessing was a more comprehensive understanding of the relevance and magnitude of these interactions and thus better means for projecting them into the future under continuing environmental changes. An important interaction of land-use and environmental changes was found to be the “replaced sinks and sources” (Strassmann et al., 2008) (termed “land-use amplifier” by Gitz and Ciais (2003) or, related, “loss of additional sink capacity (LASC)” by Pongratz et al. (2009)). These result from the reduced sink capacity of the terrestrial biosphere due to the loss of forests, which have a long residence time for carbon in comparison to croplands and pastures and have thus historically and at global scale been a more efficient sink in response to rising CO2 levels.
Interaction effects on CO2 fluxes between LUC and environmental changes arise in various ways and play out differently for different land-use activities (Figure 4). Environmental changes, mainly CO2 fertilization, are the underlying reason for the global natural land sink (“SLAND” in the GCB). SLAND amounts to around 2.4 PgC/yr in 2015–2024 (Friedlingstein et al., 2026). However, some regions have become CO2 sources due to overwhelming effects of pests, droughts, heatwaves and related fires (Figure 5). Individual years saw substantial drops in global SLAND, often related to the El Niño phenomenon bringing dry conditions in the Amazon (Figure A.2). The overall increase in terrestrial carbon stocks also leads to higher emissions if carbon is lost to the atmosphere due to land-use transitions. Considering these environmental effects on carbon densities (δL, the environmental contribution to ELUC) in BMs, based on DGVM simulation results, leads to an increase in net ELUC by 0.3 PgC/yr in 2015-02024 compared to pre-industrial conditions (Dorgeist et al., 2024), as overall historical deforestation progressed. In the future, climate damages reducing the available terrestrial carbon could cause a decrease in ELUC. Although non-forest ecosystems also respond to environmental changes and may sequester (or release) more carbon due to environmental changes, the different sensitivity of ecosystems to environmental changes makes it important to account for δL explicitly. For example, the slower turnover rate of woody ecosystems that respond to the beneficial effects of CO2, combined with historical land-use activities changing more woody to non-woody ecosystems than vice-versa, explains the overall positive sign (increased net emissions) of δL, i.e., effects are non-additive with amplification (synergistic) (Gitz and Ciais, 2003). An analogous mechanism would lead to additional sinks (or sources in case of detrimental environmental changes—non-additive with a dampening effect) when forest cover is (re-)established by re-/afforestation, the difference being that the effect occurs after the land-use transition, not before as for δL. The convention chosen in the GCB is that such (re-)established sinks/sources are not counted toward ELUC but toward SLAND. A practical decision must also be taken to decide which part of regrowth is counted toward ELUC (including δL), and which toward the (re-) established sinks/sources that emerge as environmental conditions keep changing (which are part of SLAND). In bookkeeping modeling, the expected carbon density (carbon stock per unit area of an ecosystem type) at the time of the land-use transition is taken as the target for the calculation of ELUC, while any subsequent environmental changes are attributed to SLAND (Dorgeist et al., 2024). While we introduce “(re-)established sinks/sources” as a novel technical term here, “replaced sources/sinks” were identified as relevant interaction term in 2008 in the Tellus paper by Strassmann et al. (2008). Historically, clearing of forests destroyed not only one third of the global forest area but also the additional sinks they could have provided under rising CO2. Starting with the GCB2025, SLAND has been corrected for the replaced—and, implicitly, (re-)established—sinks/sources (O’Sullivan et al., 2026), reducing the SLAND estimate by 0.5 PgC/yr in 2015–2024.
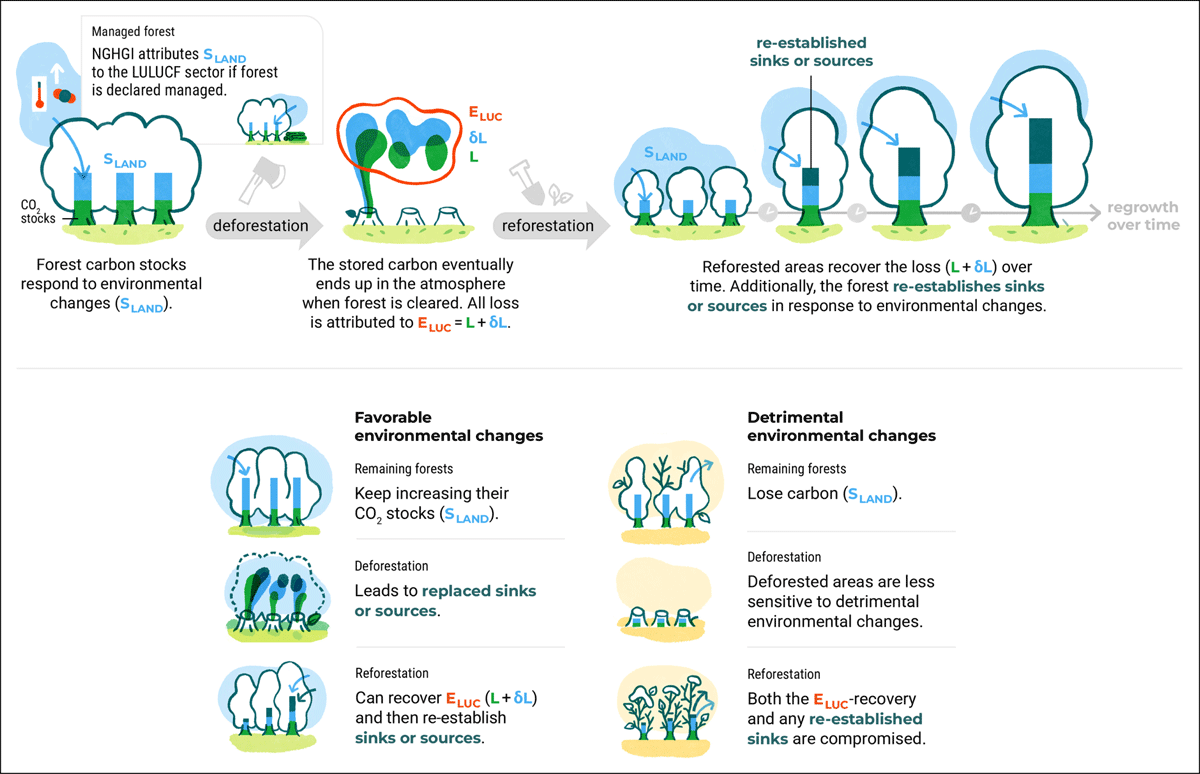
Figure 4
Graphical explanation of the interaction terms that arise when land-use changes—here exemplarily deforestation and reforestation—occur under changing environmental conditions. Two interaction terms can be distinguished: (i) Environmental changes create altered carbon stocks that land-use change acts upon—attributed to the net land-use change flux (ELUC = L + δL, i.e., the net land-use change flux including the environmental contribution) in the Global Carbon Budget; (ii) land-use change alters the vegetation distribution, which then responds differently to environmental changes and creates or destroys additional sinks or sources—attributed to the natural land sink (SLAND). Historically and on the global scale, environmental changes have increased the terrestrial carbon stocks. In the future, the beneficial effects on vegetation due to increasing atmospheric CO2 concentrations may be overcompensated for by detrimental climate change impacts (both regionally and globally), and areas that provided additional sinks in the past may turn into sources.
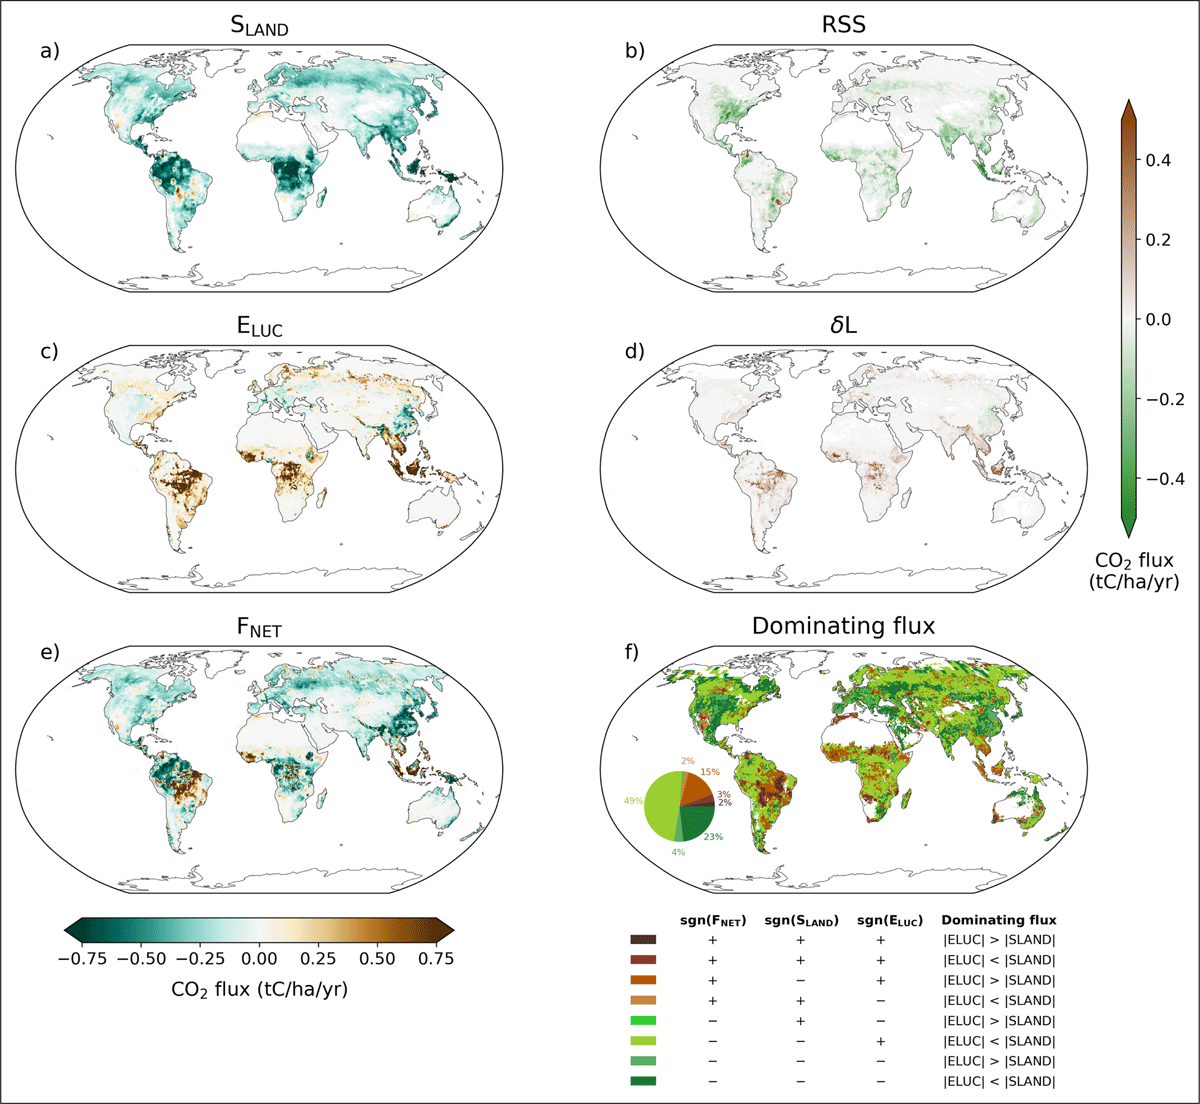
Figure 5
The (a) natural land sink (SLAND) and (c) net land-use change flux (ELUC) as defined by the Global Carbon Budget 2025 and interaction terms of land-use change and environmental changes: (b) replaced or re-established sinks/sources (RSS) and (d) the change in ELUC (δL) when calculated under transient as compared to fixed pre-industrial carbon densities (i.e., with vs without accounting for environmental changes). (e) The net land-atmosphere flux, FNET, is the sum of ELUC (corrected for δL) and SLAND (corrected for RSS). In all panels, negative fluxes indicate terrestrial sinks (flux from the atmosphere into land), and positive fluxes indicate sources. All fluxes are averages over 2015–2024. They amount to –2.4 PgC/yr for SLAND, –0.5 PgC/yr for RSS, 1.4 PgC/yr for ELUC, 0.3 PgC/yr for δL, and –1.0 PgC/yr for FNET. Panel (f) classifies regions based on whether FNET acts as a sink or a source (green vs. brown areas) and further distinguishes whether ELUC and SLAND is a sink or a source, respectively, and which of the two fluxes dominates in magnitude (plus signs in the legend denote sources, minus signs sinks). For example, the light green color covering half of the land surface indicates that the land, in net terms, takes up CO2, because the uptake by the natural land sink overcompensates the emissions from land-use change. The supplemental material shows the maps for the 1960s and for 2024 for comparison. All fluxes are based on the Global Carbon Budget 2025 (Friedlingstein et al., 2026) except for δL, which is calculated only with the bookkeeping model BLUE following Dorgeist et al. (2024).
3.3 Attribution of interaction terms of land-use and environmental changes
In summary, two types of interactions exist: (i) environmental changes alter carbon stocks that LUCs act upon and (ii) LUCs alter the vegetation distribution (Figure 4). Because different vegetation types respond differently to environmental changes, additional sinks or sources are created or lost. Replaced and (re-)established sinks/sources and δL together make up the “LASC”, which is the key difference between ELUC estimates based on DGVMs and estimates derived from bookkeeping estimates excluding environmental changes (Obermeier et al., 2021). The net LUC flux derived directly from DGVM simulations is based on the difference between a historical simulation and one with historical climate but pre-industrial land-use, by definition not accounting for replaced and (re-)established sinks/sources, which have to be corrected for (O’Sullivan et al., 2026).
The choice of which interaction term to attribute to the natural land sink vs the net LUC flux is a political rather than a scientific one (Houghton, 2013; Pongratz et al., 2014). The GCB chose one of many possible options: ELUC is calculated under environmental conditions prevailing at the time of the land-use event; any subsequent environmental changes are not considered part of ELUC. This also holds for the calculation of legacy fluxes of the land-use event (such as slow decay or regrowth). This reasoning means that neither reward nor penalty is given to land managers for unforeseeable, future changes in environmental conditions outside their control. However, they get full credit for the effects their land-use decision has or would have under the known current conditions.
The distinction between ELUC and SLAND fundamentally differs from the land-use flux accounting used for national greenhouse gas inventories (NGHGIs) submitted to the United Nations Framework Convention on Climate Change (UNFCCC) (Grassi et al., 2018). Instead of distinguishing by drivers, NGHGIs distinguish between natural and anthropogenic fluxes (the latter ones counted toward emissions and removals of the land use, land-use change and forestry—LULUCF—sector) by area (based on the “managed land proxy”) (IPCC, 2006). The NGHGIs thus attribute all fluxes (SLAND and ELUC) occurring on managed land to the LULUCF sector. Therefore, the global LULUCF flux based on the NGHGIs is a sink of 1.0 PgC/yr (2015–2024 average), whereas bookkeeping-based ELUC is a source of 1.4±0.7 PgC/yr (Friedlingstein et al., 2026). These differences in definition have been recognized, and a translation between estimates based on global models, as in GCB, and NGHGIs has been proposed and found generally valid on both global and national scales (Grassi et al., 2018, 2023; Melo et al., 2026; Schwingshackl et al., 2022)—the 2.4 PgC/yr gap could be largely resolved (Figure 3, right). While this reconciliation is crucial for enhancing confidence in land-use flux estimates (Grassi et al., 2025), it does not make either of the definitions obsolete. The NGHGI approach has pragmatic advantages as it is directly observation-based, and modeling is not necessarily required. On the other hand, global models and their definitions do more than resolve the drivers. They provide estimates of the remaining carbon budget and are used to determine the timing of net-zero emissions in country targets under the Paris Agreement (Gidden et al., 2023).
4 Past and Future of the Net Land Sink
The split into natural versus anthropogenic drivers is crucial to understand the drivers and thus project the future of CO2 fluxes. Figure 5 shows ELUC, SLAND and their interaction terms as well as the net land-atmosphere flux of CO2 (FNET = ELUC + SLAND) for the last decade. Figure A.1 shows the same for the 1960s, when the FNET transformed from a source into a sink (as global SLAND grew larger than ELUC), and Figure A.2 for 2024, a year with large climate impacts due to El Niño conditions as well as global warming. Regional net sources are increasingly caused not only by deforestation but also by biomass losses from climate impacts such as droughts and natural fires. In particular, in South America emissions due to climate impacts compensate about half of the sinks from CO2 fertilization (Sitch et al., 2024). In combination with deforestation, climate change has turned Southeast Asian and parts of South American tropical forests from CO2 sinks into sources (Friedlingstein et al., 2026). While on half of the land area (49%) net emissions from LUC were overcompensated by a natural land sink in 2015–2024, the extreme year 2024 reduced this to 40%. 25% of the land area exhibited a positive SLAND in 2024 in contrast to 9% in 2015–2024. While areas with a net negative ELUC—in particular the reforestation regions of China, Europe, and North America—meanwhile make up about one-third of the land area (29% in 2015–2024), the area where these land-use removals are reduced by losses from SLAND rose from 2% in the decadal average to 9% in 2024.
In short, progress has been made in recent decades in slowing the net loss of forest area (Figure 1). Although forest clearing and a large positive ELUC prevail in the tropical regions and keep global ELUC high, re- and afforestation efforts already remove 0.5 PgC from the atmosphere every year (Pongratz et al., 2024). The slowing of deforestation rates, as observed recently in Brazil (Assis et al., 2019), reduces emissions as well as threats to biodiversity. However, climate change impacts have reduced the natural land sink by 25% in the last decade, relative to what they would have been without the effects of climate change (Friedlingstein et al., 2026). While LUC remains the biggest threat to terrestrial carbon stocks, the effects of climate change seem to be catching up. Even if strong climate change is averted by ambitious climate policies, the growth of SLAND may weaken due to the reduced CO2-fertilization effect. Gidden et al. (2023) thus warn that the LULUCF sector in NGHGIs could become a source if land-based mitigation efforts are not strong enough to compensate for a weakening of the indirect anthropogenic sink. Still, the overwhelming number of future projections simulated with ESMs suggests that land will remain a net CO2 sink throughout the 21st century (Liddicoat et al., 2021). Nevertheless, both land-use and climate policies need to raise their ambitions to secure a strong future net land sink. As a possible incentive to foster both, a national accounting not just of net land-use change emissions but also of the natural land sink has been suggested (Houghton, 2018).
The future of the net land sink depends not only on the climate evolution, nor only on future land-use actions. It depends also on the interaction terms between both factors. The recent forest inventory for Germany, for example, revealed a substantial loss of CO2 sink capacity following the droughts and bark beetle outbreaks in 2018 and subsequent years. Historical management had made forests poorly adapted to climate change, causing overall LULUCF emissions to increase sharply (Bundesministerium für Ernährung und Landwirtschaft (BMEL), 2022; Umweltbundesamt (UBA), 2026). CO2 fluxes related to replaced and (re-)established sinks/sources are highly uncertain for the future as they are affected by both future climate and past and future land-use evolution (Strassmann et al., 2008). Paradoxically, deforestation tends to dampen the impacts on CO2 fluxes (as cleared forests cannot be affected by climate damages), while re/afforested areas, despite providing CO2 sinks while growing, are under larger risk of losing carbon due to disturbances (Figure 4). CDR methods like re-/afforestation, forest management, agroforestry, or soil carbon sequestration are all sensitive to climate change, which threatens both the success of these measures and the permanence of the carbon sequestered (Bustamante et al., 2023). Given the increasing focus on CDR on the land-use side and given the increased likelihood of a temperature overshoot with notable climate impacts, followed by a decrease in atmospheric CO2, a re-assessment of future interaction terms between environmental and LUCs seems warranted—and would accommodate the vastly improved modeling capabilities over the last decades.
5 Conclusion and Outlook
Recent decades mark a shift in the role of global land use—from an activity focused on providing food and fiber, with climatic impacts occurring mostly as side-effects, to a central component of climate mitigation strategies. In parallel, scientific understanding has progressed from early qualitative insights to quantitative estimates of land-use CO2 fluxes and, more recently, to an appreciation of the complex interactions between LUC and environmental change. Land-use impacts on the carbon cycle cannot be understood solely in terms of direct emissions and removals, but are fundamentally shaped by interaction processes that link past land-use decisions with ongoing and future environmental change. While the attribution of these interactions to anthropogenic or natural drivers ultimately is a political choice, a possible, consistent accounting framework has now been integrated in the Global Carbon Budget (Friedlingstein et al., 2025, 2026).
As land-based mitigation expands and climate dynamics evolve, future research should reassess land-use–environment interactions, as they will play a decisive role in shaping the future land carbon cycle. Relevant considerations include, in particular, the following:
Given the need to employ models and the inherent model uncertainty, robust quantification of land-use–environment interactions requires a model ensemble. A simulation protocol to isolate the land-use–environment interactions across DGVMs already exists (Obermeier et al., 2021). However, a further disaggregation into δL and SLAND is currently possible only with BMs (Dorgeist et al., 2024) and should also be developed for other model types.
Climate and ecosystem dynamics under temperature overshoot scenarios are expected to produce substantially different outcomes for land- use–environment interactions than no-overshoot high- or low-mitigation pathways. The legacy effects of overshoot (such as forest dieback) meeting initially still high levels of climate change combined with declining CO2 concentrations (leading to land (and ocean) outgassing (Jones et al., 2016)) create an unprecedented combination of conditions.
Natural and anthropogenic disturbances that lead to forest degradation (in particular selective logging, edge effects, droughts, fire (Anderegg et al., 2015; Jäger et al., 2024; Lapola et al., 2023)) are not well represented in current DGVMs and BMs (Friedlingstein et al., 2026), although they cause substantial losses of forest area and carbon stocks. In tropical regions, these losses may even exceed those from deforestation (e.g., Baccini et al., 2017; Matricardi et al., 2020). Resolving forest demography in DGVMs (Fisher et al., 2018) and integrating the growing database on forest regrowth dynamics (e.g., Heinrich et al., 2023) into BMs would lay the foundation for better incorporating these processes into the quantification of ELUC, SLAND, and their interaction terms.
The fundamental changes in ecosystem dynamics expected under overshoot scenarios and altered disturbance regimes should also be accounted for in ESMs and Integrated Assessment Models (IAMs). ESMs naturally incorporate such advances because they often include DGVMs as their land-surface component, and are therefore able to estimate Earth system feedback associated with these altered ecosystem dynamics. By contrast, their integration into IAMs is less mature and may rely on parameterizations informed by global carbon-cycle models rather than on full process representation.
While comparisons between global models and NGHGIs have been largely successful (Grassi et al., 2023; Schwingshackl et al., 2022), comparisons between models and Earth observations still suffer from the inability to cleanly separate natural and anthropogenic drivers in observations (Obermeier et al., 2025; Pongratz et al., 2021). Developing suitable and directly comparable component fluxes (Friedlingstein et al., 2026; Melo et al., 2026), separating drivers in Earth observations using appropriate proxies (Souza Jr et al., 2020), and fostering close interaction between the research communities (Grassi et al., 2025; Pongratz et al., 2021) are important and promising avenues for future research.
Appendices
Appendix A: Terrestrial Carbon Fluxes for Other Time Periods
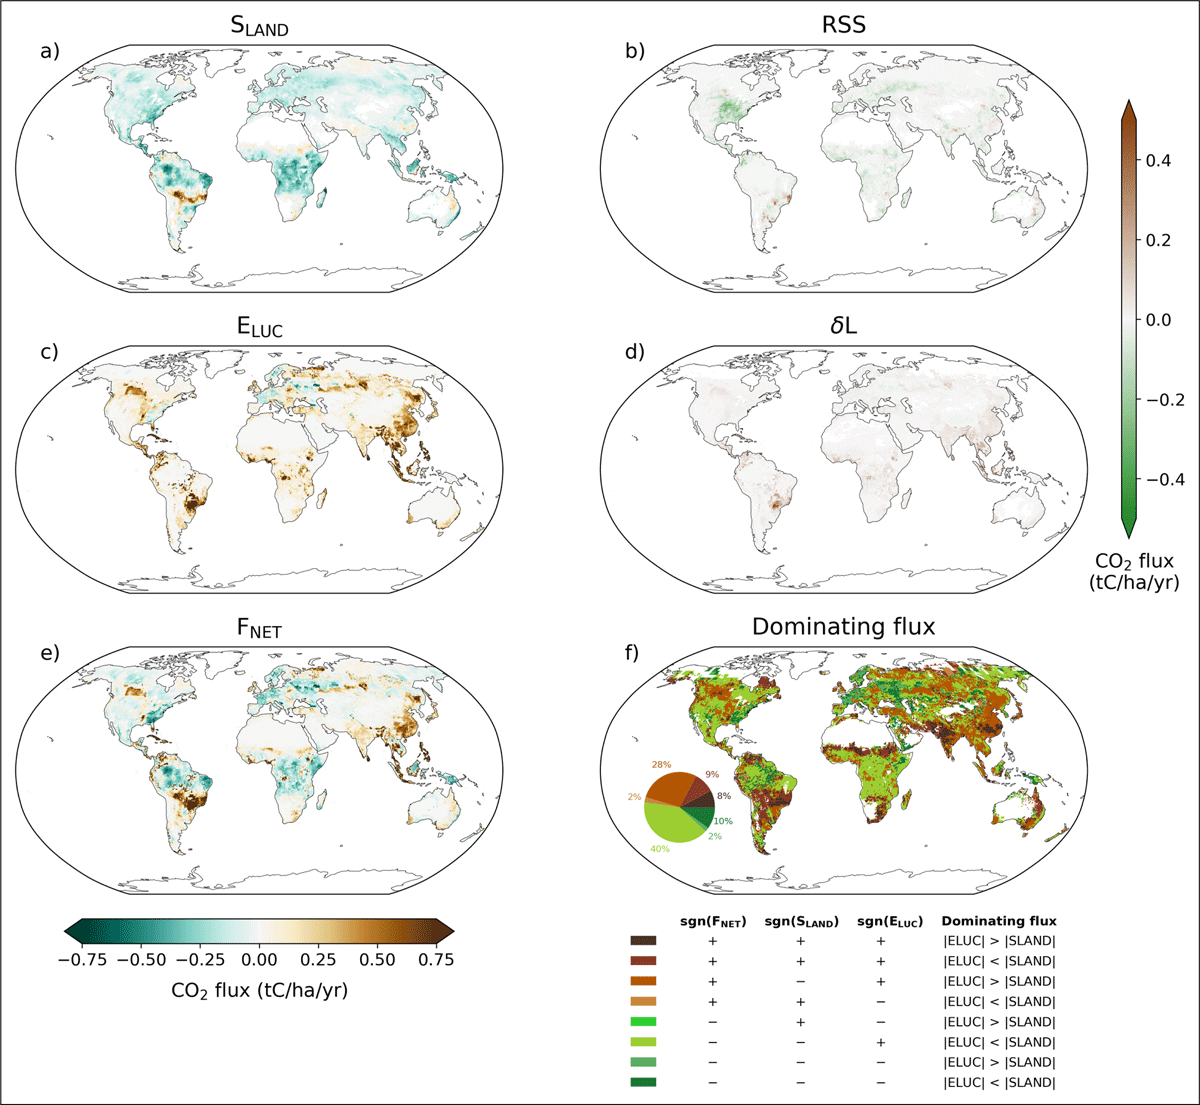
Figure A.1
Same as Figure 5, but averaged over the years 1960–1969, the decade in which the global natural land sink, SLAND, had grown large enough to overcompensate the net land-use change flux, ELUC, which is globally a strong emission term. The fluxes amount to –0.9 PgC/yr for SLAND, –0.1 PgC/yr for RSS, 1.4 PgC/yr for ELUC, 0.2 PgC/yr for δL, and 0.4 PgC/yr for FNET.
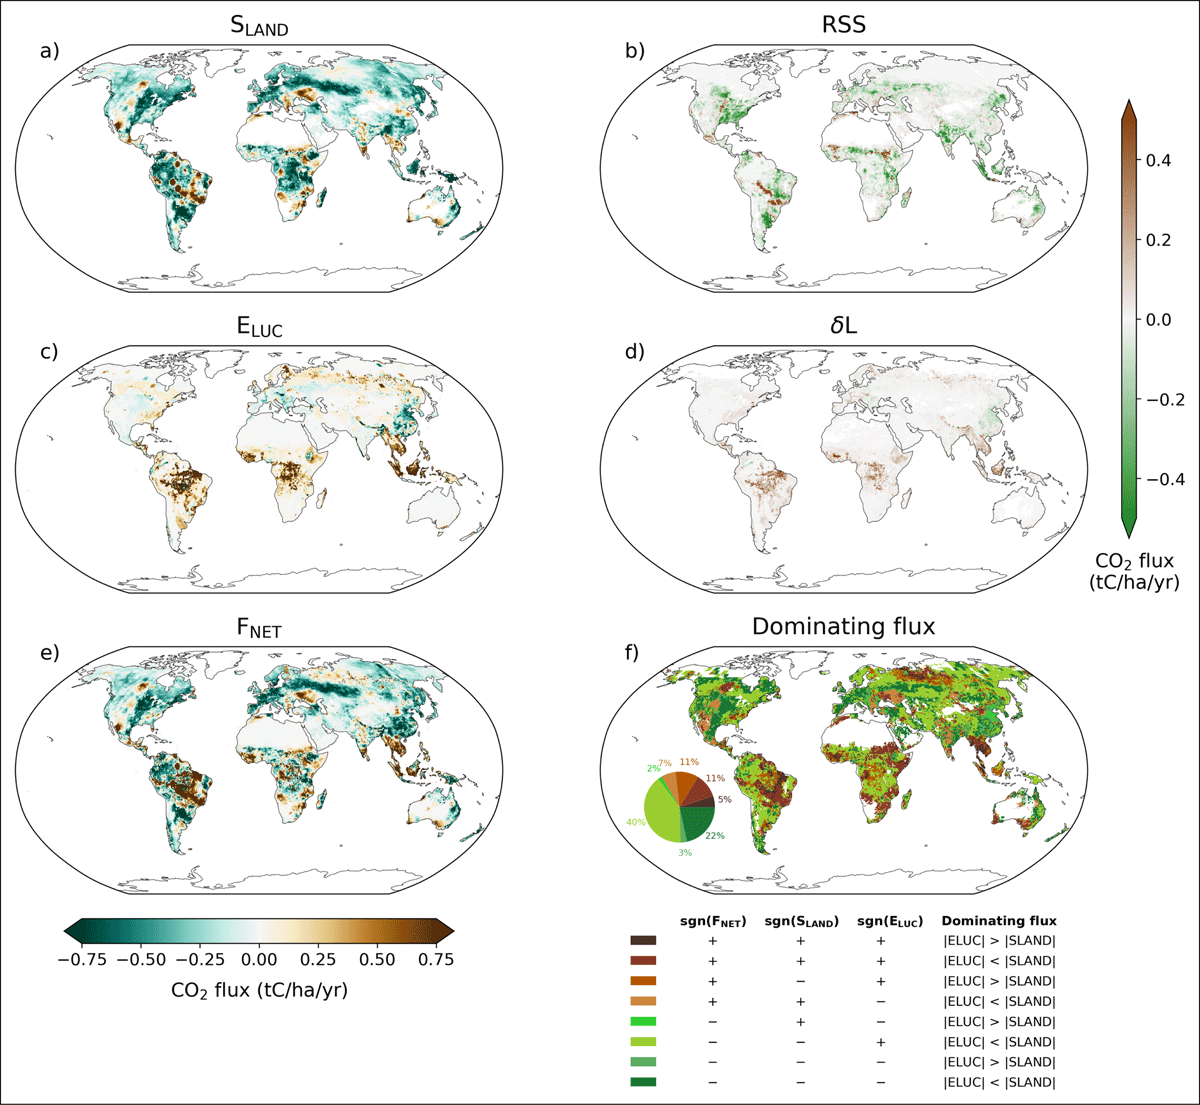
Figure A.2
Same as Figure 5, but for the year 2024. Note that the land-use forcing for 2024, on which the net land-use change flux (ELUC) is based, is extrapolated from recent trends (Friedlingstein et al., 2025). Compared to Fig. 4, the detrimental impacts of hot-dry El Niño conditions on top of global warming in particular in the Amazon become apparent for the natural land sink and the replaced or re-established sinks/sources term (RSS). The fluxes amount to –1.9 PgC/yr for SLAND, –0.4 PgC/yr for RSS, 1.2 PgC/yr for ELUC, 0.3 PgC/yr for δL, and –0.6 PgC/yr for FNET.
Notes
[1] Note that we use the term “natural land sink” in its scientific definition, as the response of terrestrial carbon stocks in vegetation and soils to environmental changes. This stands in contrast to the political use of “natural sinks” referring to CO2 removal through LUC, such as reforestation, deemed “natural” in contrast to more technological sinks, like direct air carbon capture and storage.
Abbreviations
BLUE The “Bookkeeping of Land-Use Emissions” model
CDR Carbon Dioxide Removal
CMIP5 Coupled Model Intercomparison Project\break Phase~5
DGVM Dynamic Global Vegetation Model
ELUC Net land-use change flux (including emissions and removals)
ESM Earth System Model
EFOS Fossil CO2 emissions
FNET Net land–atmosphere CO2 flux (sum of ELUC and SLAND)
GCB The Global Carbon Project’s “Global Carbon Budget”
GCM General Circulation Model
HYDE History Database of the Global Environment
IAM Integrated Assessment Model
IPCC Intergovernmental Panel on Climate Change
L Land-use change flux under constant (pre-industrial) environmental conditions
δL Environmental contribution to the land-use change flux
LASC Loss of Additional Sink Capacity
LUCE Land-Use Change Emissions model
LUC Land-use change
LULUCF Land Use, Land-Use Change and Forestry
NGHGI National Greenhouse Gas Inventory
OSCAR A reduced-form Earth system model
RSS Replaced or re-established sinks/sources
SLAND Natural land sink
TRENDY The model intercomparison project “Trends and drivers of the regional scale terrestrial sources and sinks of carbon dioxide”
UNFCCC United Nations Framework Convention on Climate Change
Data Accessibility Statement
All data discussed in this perspective are available from the original cited publications.
Acknowledgements
We thank Ève Barlier for support on Figure 4.
Author Contributions
JP conceived the study. CS provided quantitative figures. CS and MOS provided data. JP led the manuscript writing with input from all authors.