
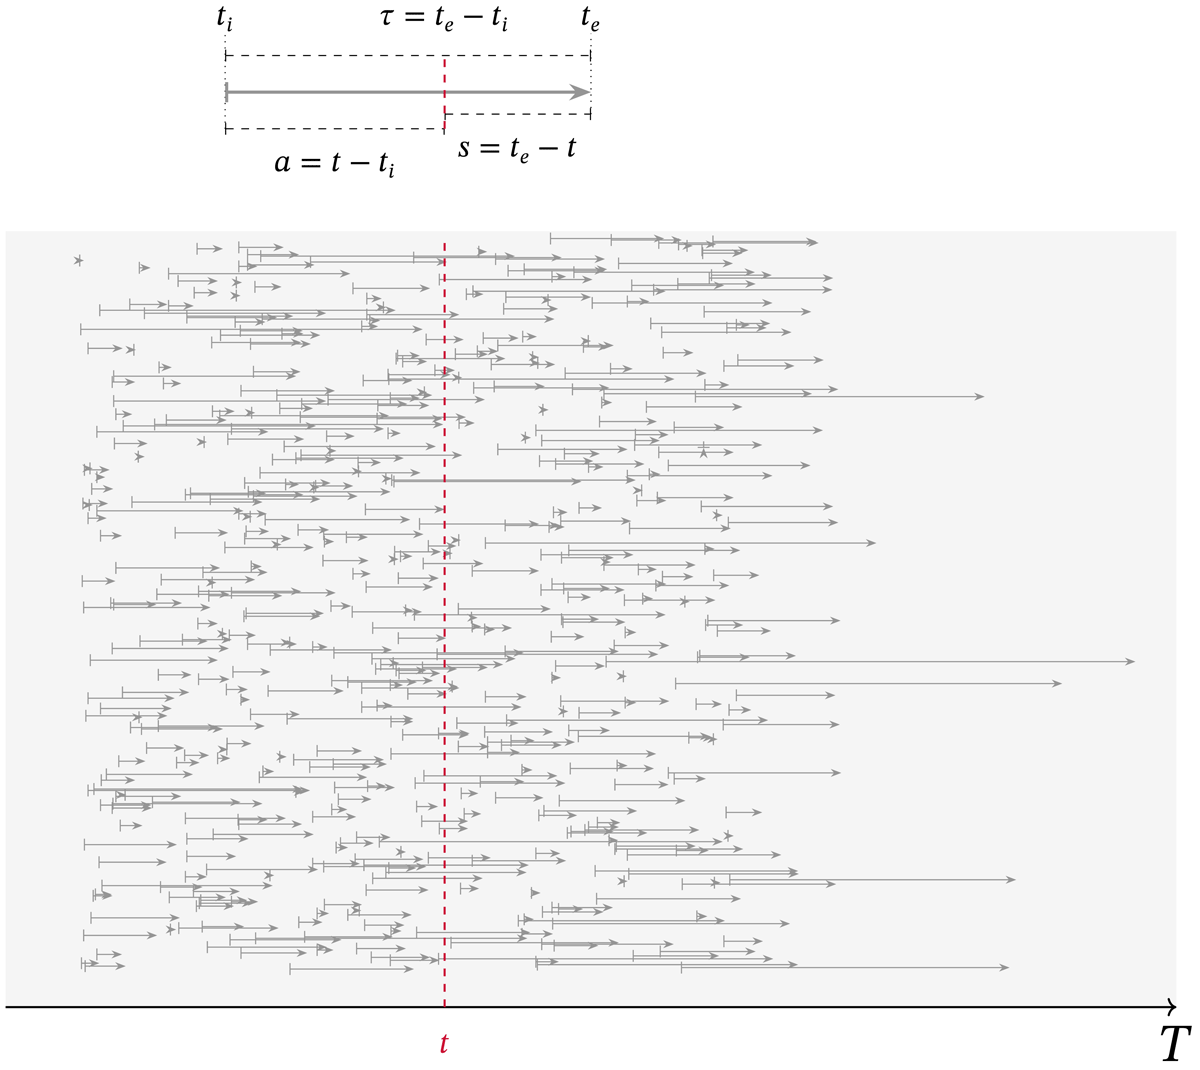
Figure 1
Timescale metrics such as age, transit time, and survival time represented as time intervals at which a stream of particles passes through an open system. T represents the reference time frame over which time events are recorded for each particle. These time events are the time of entry to the system ti, and the time of exit te. For each time of observation t, it is possible to obtain the age of particles inside the system as the interval , and their survival time as (making a prediction about their future behavior). Also, at each t it is possible to quantify the transit time for those particles leaving the system at . As t changes (e.g., sliding the red dashed line forward), the values of a, , and s change with time. At the macro scale, we are interested in the statistical behavior of the ensemble of particles (probability distributions and their moments) of the intervals a, , and s as they change with t.
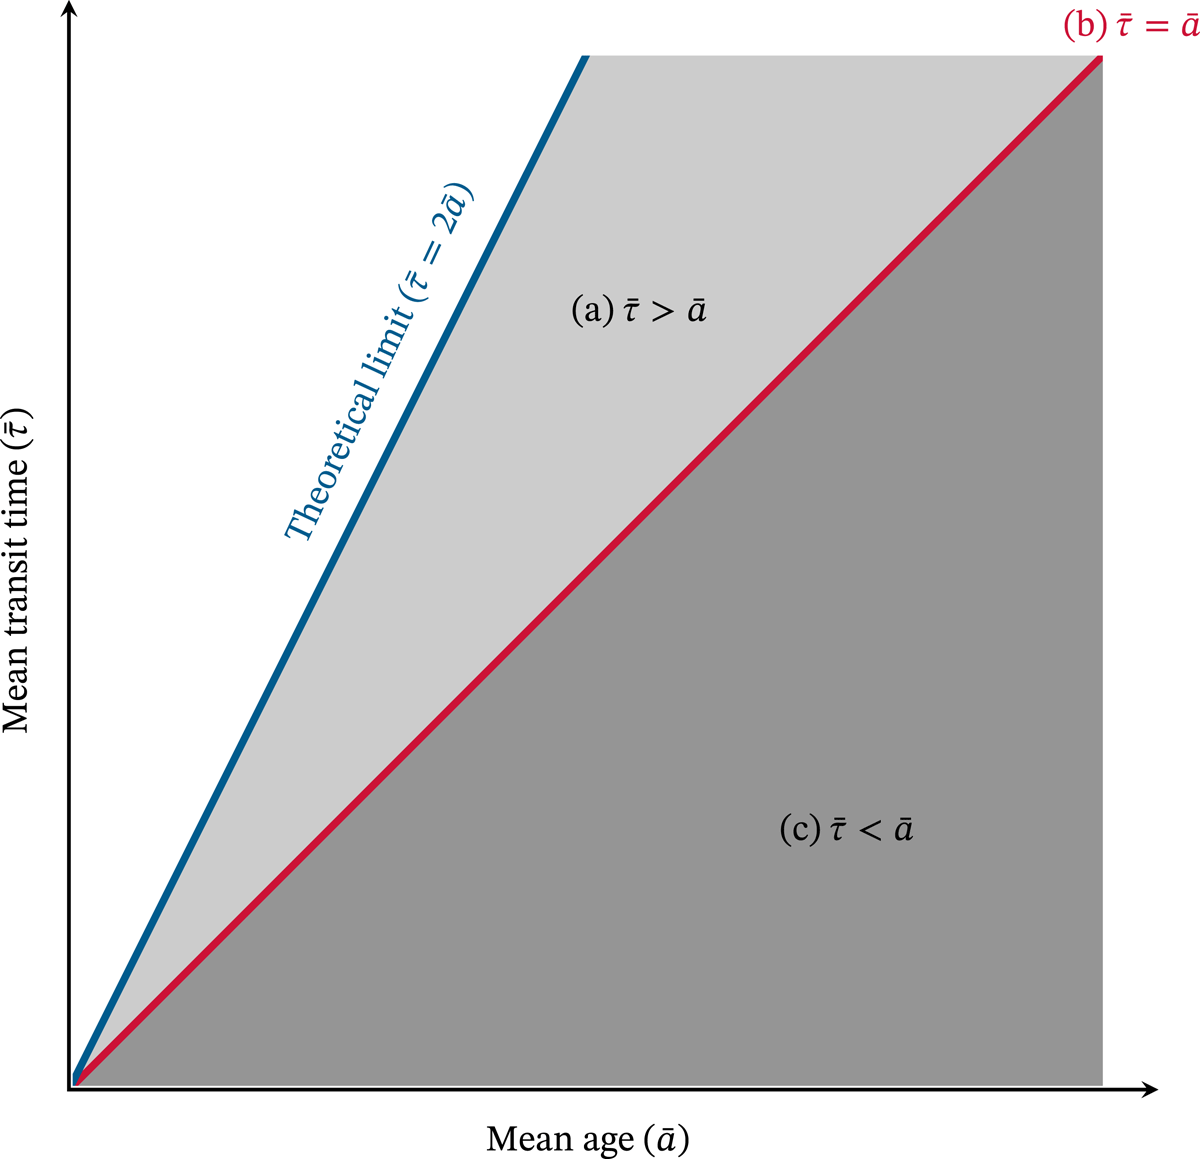
Figure 2
Space of potential relationships between mean age () and mean transit time () for systems in equilibrium (after Bolin and Rodhe, 1973; Björkström, 1978). (a) Mean transit time > mean age (light gray region), indicating that particles entering the system have a low probability of appearing early in the output flux. (b) Mean transit time = mean age (1:1 line), indicating that the system is well mixed and all particles stored have the same probability to appear in the output flux. (c) Mean transit time < mean age (dark gray region), indicating that particles entering the system have a high probability of leaving early. Region (a) has an upper theoretical limit defined by the 1:2 line, which corresponds to the case of an idealized piston-flow system in which all particles leave after completely traversing the system, thus (c.f. Björkström, 1978; Calabrese and Porporato, 2015).
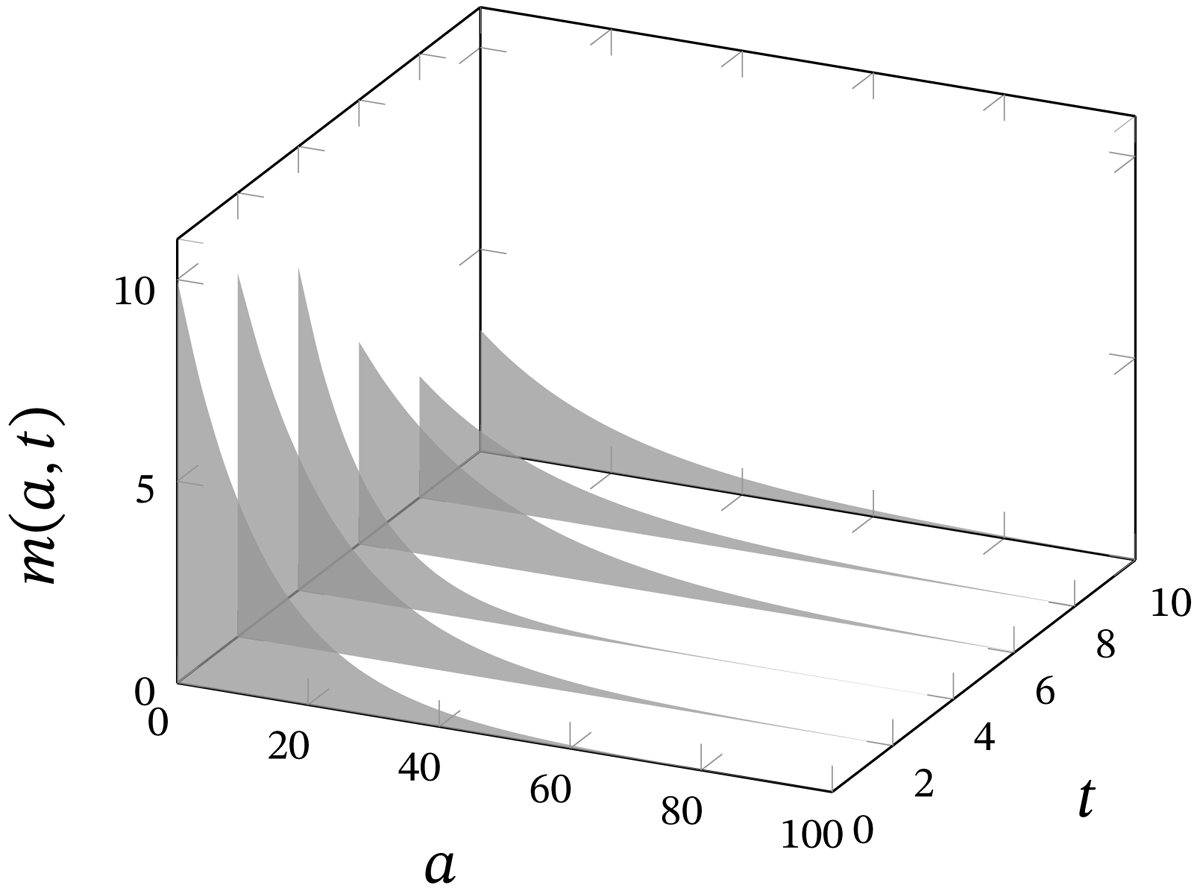
Figure 3
Probability distribution of mass stored in a system as a function of age a and time t. For simplicity of presentation, this plot shows slices of the three-dimensional distribution for discrete values of t, but in reality, the distribution is continuous in time. In this example, the distribution changes from an initial state (front) with large storage of mass of young ages, toward less total mass and of older ages. For each value of t, , i.e., the gray area under the curve is the total mass stored in the system at each t.
Table 1
Summary of symbols and definitions.
| SYMBOL | DESCRIPTION | EXPRESSION |
|---|---|---|
| Events | ||
| t | Time of observation on a timeframe T | |
| ti | Time of entry or injection of single particles | |
| te | Time of exit or ejection of individual particles | |
| Intervals | ||
| a | Age of individual particles | |
| Transit time of individual particles | ||
| s | Survival time of individual particles | |
| Distributions | ||
| pdf of age a at time t | ||
| pdf of transit time at time t | ||
| Distribution of mass of age a at time t | ||
| Distribution of mass in flux with transit time at time t | ||
| Cumulative distribution of mass with age at t | ||
| Cumulative distribution of flux with transit time at t | ||
| Aggregated quantities | ||
| M(t) | Total mass in the system at time t | |
| F(t) | Total flux (in or out) of the system at time t | |
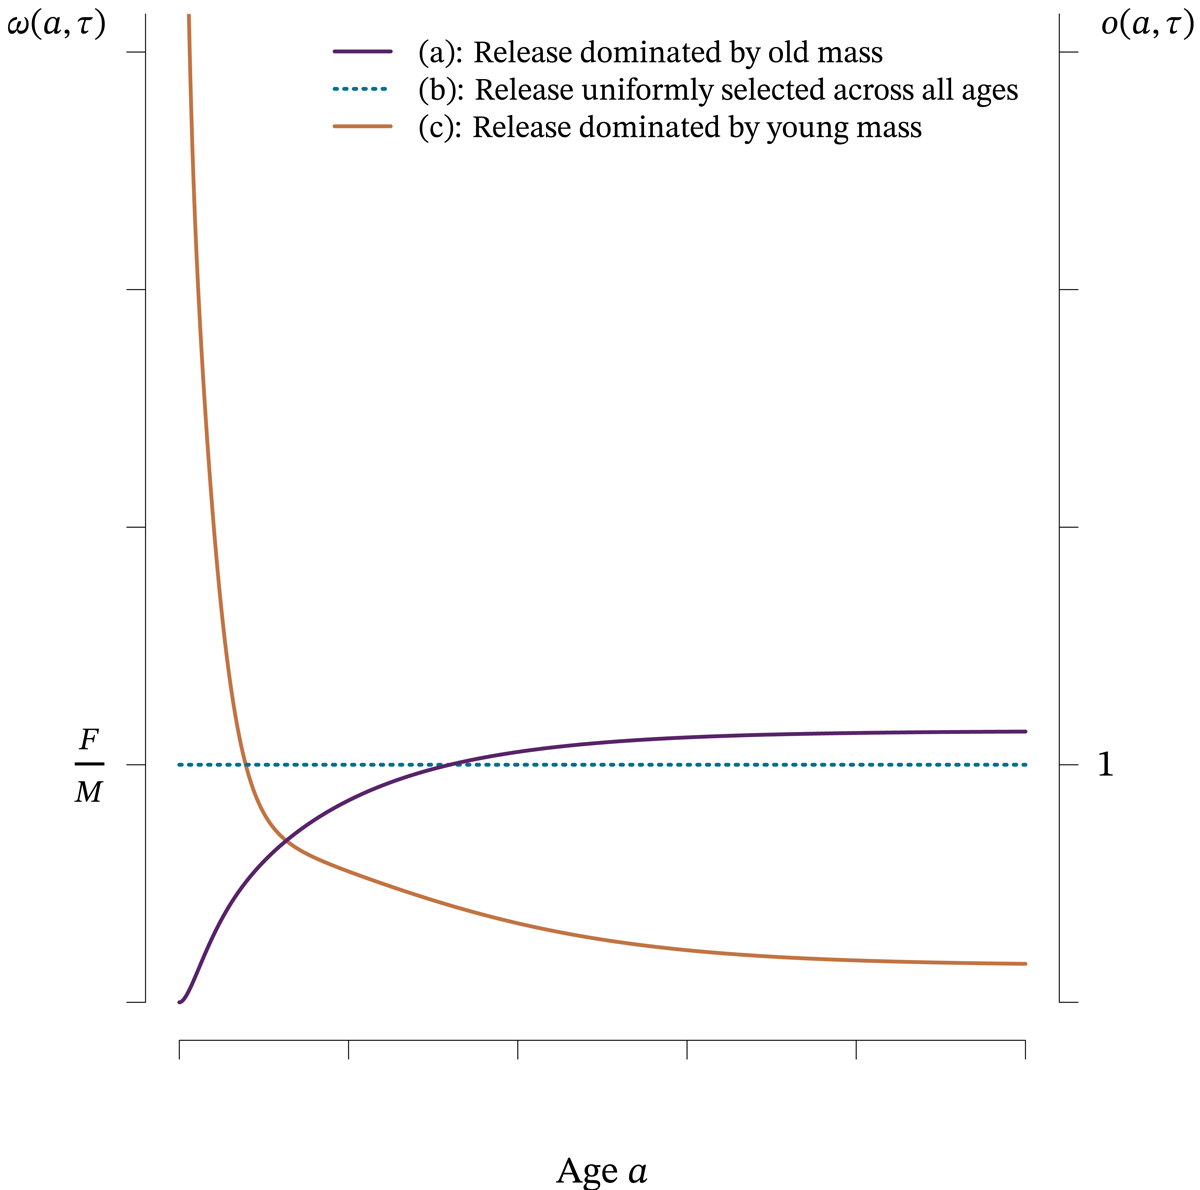
Figure 4
Possible shapes of the functions and for fixed values of t. The shape of these functions represents three potential cases: (a) the release flux is dominated by old mass, (b) the release flux has similar ages as the mass stored, and (c) the release flux is dominated by young mass. These three cases generalize the simple cases for mean values at equilibrium defined by Bolin and Rodhe (1973) (Figure 2). Notice that is a scaled version of (equations 7 and 8); therefore, in case (b) the values of converge to the ratio F/M.