
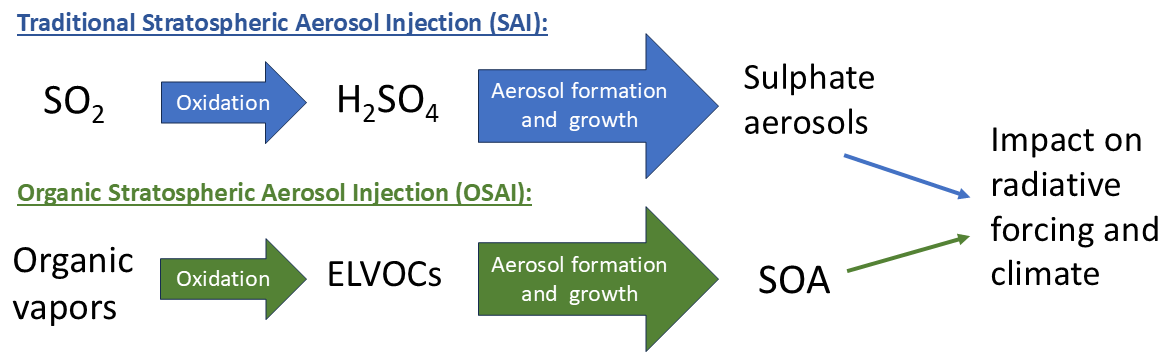
Figure 1
Schematic figure on traditional (sulphur-based) and organic SAI.
Table 1
Comparison of organic aerosols vs sulfate aerosols. Calculated per 1 Tg SO2. The detailed calculations are given in SI material.
| PARAMETER | SULFATE SAI CASE | ORGANIC SAI CASE |
|---|---|---|
| Precursor vapor | SO2 | VOC (e.g., isoprene or some monoterpene or sesquiterpene) |
| Oxidants | OH. Slow oxidation (weeks to months) to H2SO4 | OH and O3. Fast oxidation (hours to days) to ELVOCs |
| Nucleation | Sulfuric acid + water | Pure biogenic mechanism |
| Mass yield from injected precursor | ~150% | Depends on precursor, but likely around 20–200% |
| Growth | Slow (0.1–1 nm/h) but relatively constant over weeks or months. | High GR (>10 nm/h) initially, slower later as vapors deplete |
| Resulting particle size | Larger particles (>700 nm) | Smaller particles (~400–600 nm) |
| Lifetime | Long lifetime (years) | Shorter lifetime (months) |
| Evaporation | None | Evaporation within 500–10000 h |
| Acidity | Highly acidic | Less acidic |
| Needed amount | ca 10 Tg/year | ca 15 Tg/year |
| Radiative forcing | ‒3.5 W/m2 | ‒3.5 W/m2 |
| Environmental impacts | Acidification, effects to ozone layer due to acidic aerosols | Minor: SOA will evaporate within a year |
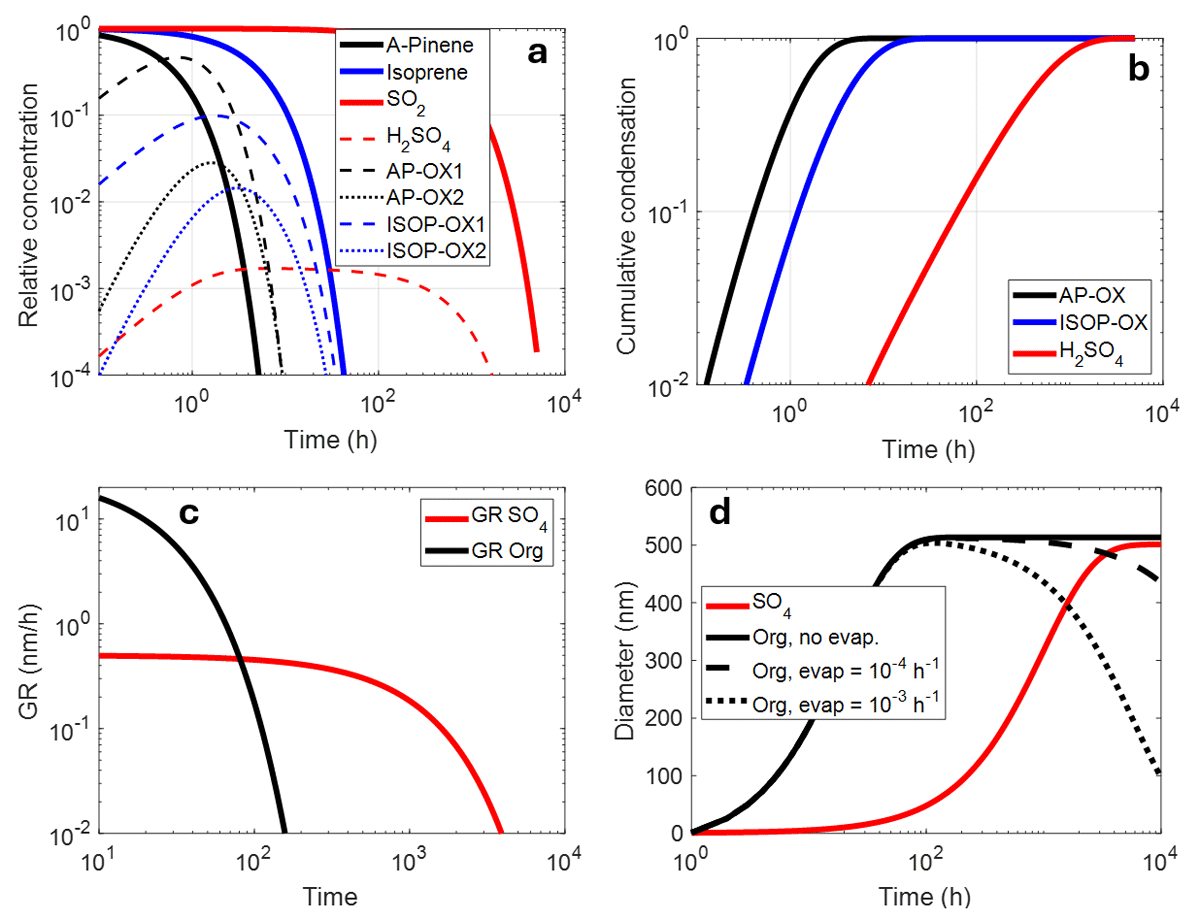
Figure 2
Conceptual box model calculations of oxidation (a, b) and particle growth (c, d) in the stratosphere following a single injection of aerosol precursors. (a) Aerosol precursor removal due to oxidation and formation of oxidation products that may condense to form aerosol. SO2 has the longest lifetime, converting slowly into H2SO4, while different organics (here exemplified by α-pinene and isoprene) react away at different rates, forming first (OX1) and second (OX2) generation oxidation products. (b) Cumulative condensation of vapors in the same model case as in a. (c) Particle growth rates (GR) used to model sulfate and organic particle dynamics following a stratospheric injection. Note that the particle growth model was not coupled to the oxidation model, and growth rates were merely defined as shown here to mimic slower initial, yet more persistent, growth for sulfate aerosol while organic growth was initially fast but decays over time to reflect faster depletion of condensing vapors. (d) Particle diameters as a function of time. The organic particles are modeled without evaporation and with two different evaporation rates, corresponding to lifetimes of 1,000 and 10,000 hours.
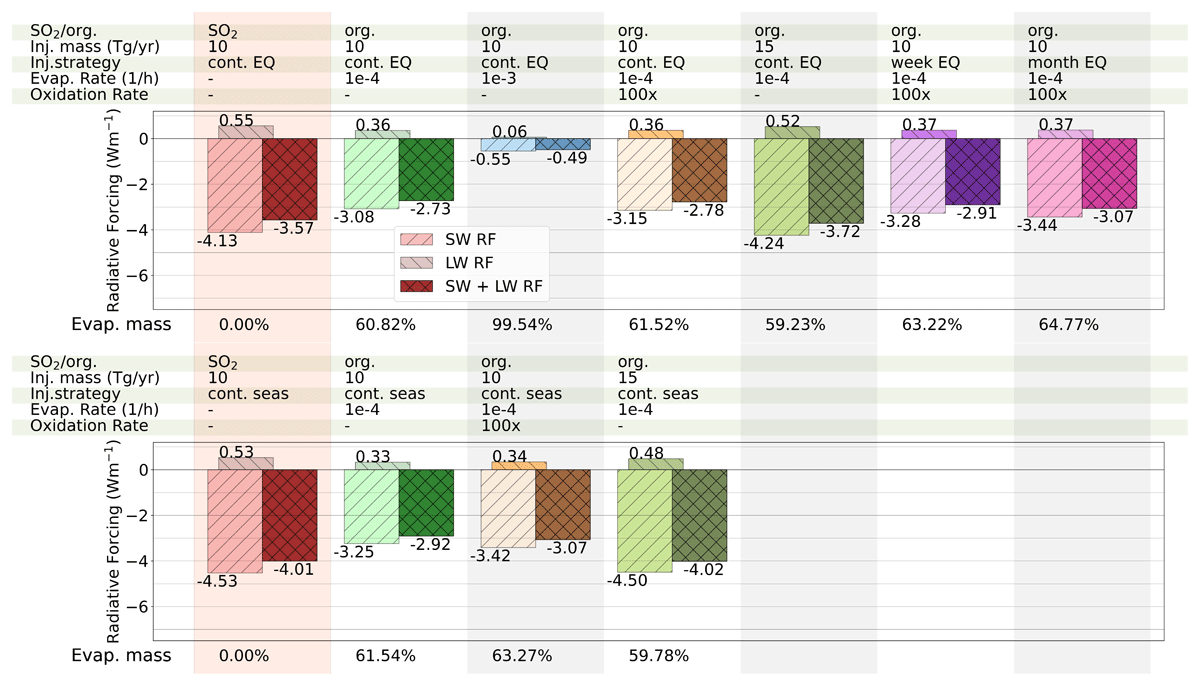
Figure 3
All-sky shortwave (SW), longwave (LW), and net (SW+LW) radiative forcings, along with the fractions of evaporated masses ((emitted mass – deposited mass)/emitted mass), in various simulated scenarios. The simulations were conducted with either SO2 injection or SO2 injection accompanied by evaporation (pseudo-organic). For the pseudo-organic injections, sensitivity simulations were performed with two different injected masses: 10 Tg/yr and 15 Tg/yr. Additionally, two evaporation rates were tested: 10–4 h–1 and 10–3 h–1, as well as two oxidation rates with OH: the original rate and a rate increased by 100 times. Three injection timings were considered: continuous, once a week, and once a month. For continuous injections, two strategies were simulated: equatorial injections and changing the injection area with the seasons.
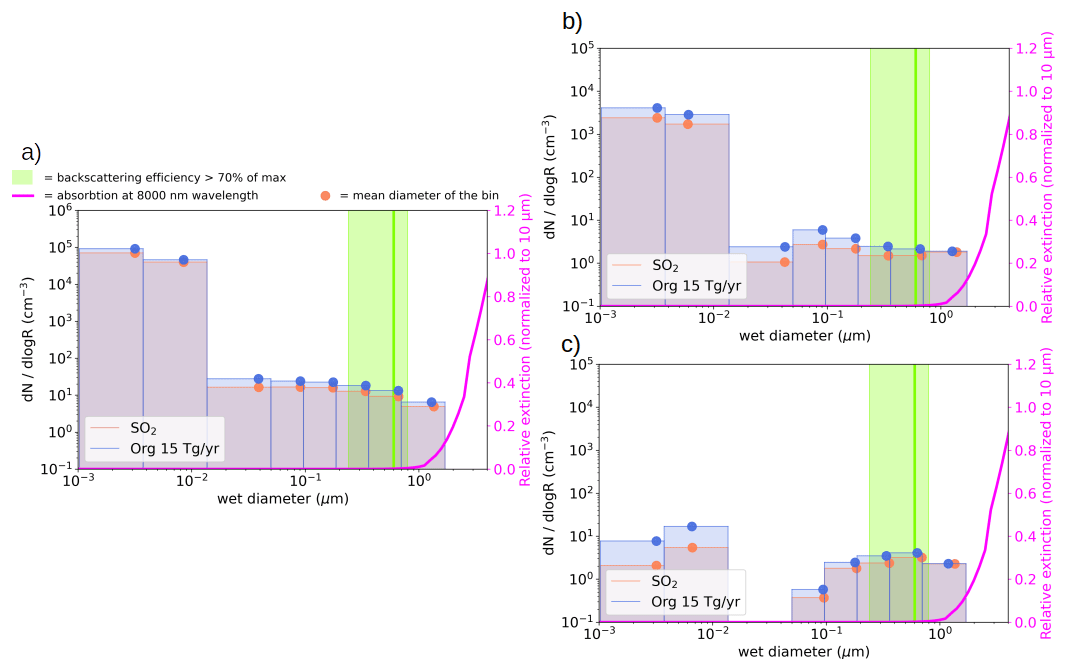
Figure 4
Aerosol number size distribution is shown for three locations: a) at the Equator and an altitude of 20–22 km, b) at 20° N and an altitude of 18–20 km, and c) at 50° N and an altitude of 12–15 km. Figure shows scenarios of SO2 injection at a rate of 10 Tg/yr and pseudo-organic aerosols at a rate of 15 Tg/yr. The dots at the top of the size bins represent the mean diameter of each bin. The green line, reproduced from Figure 5 of Vattioni et al. (2019), indicates the size at which backscattering is maximized. The green shaded area represents the radius where aerosol backscattering is 70% of the maximum, according to Dykema et al. (2016). The magenta line (unitless) shows the relative dependence of absorption at an 8000 nm wavelength on the (dry) diameter of the sulfate aerosols, based on the radiation calculation module of SALSA, using a linear, not logarithmic, scale.
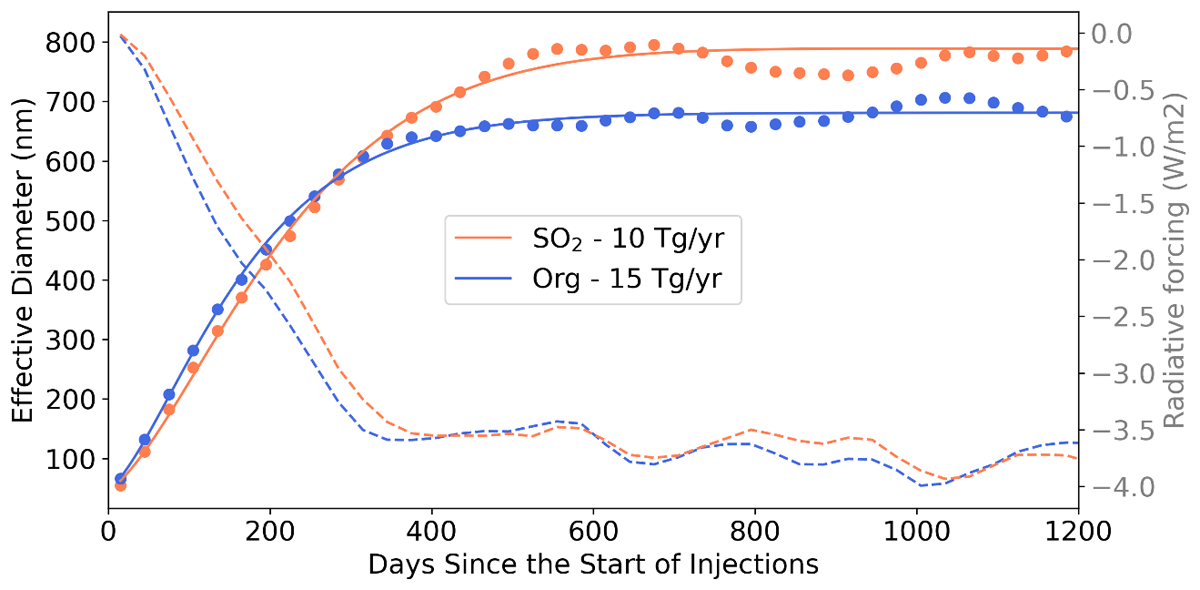
Figure 5
Effective diameter and all-sky radiative forcing as a function of days since injection started for two scenarios: SO2 injection at a rate of 10 Tg/yr and pseudo-organic aerosols at a rate of 15 Tg/yr with an evaporation rate of 1e-4 h.
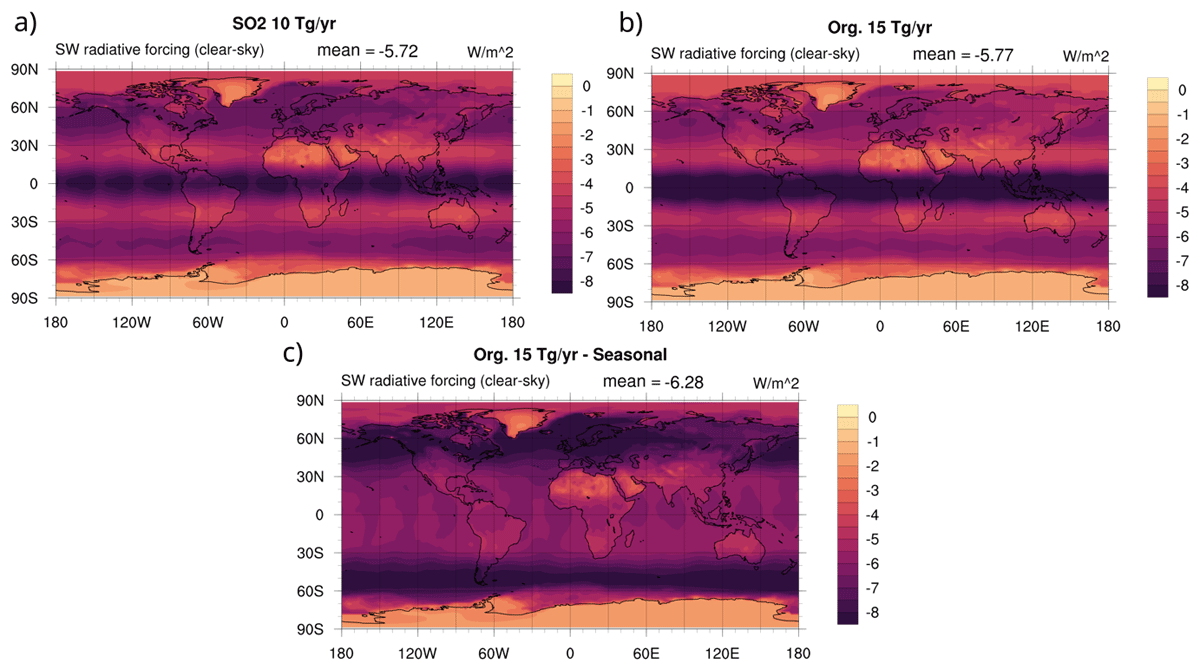
Figure 6
Clear-sky radiative forcings in different scenarios: a) SO2 injection at a rate of 10 Tg SO2/yr, b) pseudo-organic aerosols at a rate of 15 Tg/yr, and c) pseudo-organic aerosols at a rate of 15 Tg/yr with the injection area changing seasonally instead of continuous equatorial injection. In these pseudo-organic simulations, the evaporation rate was 10‒4 h.