
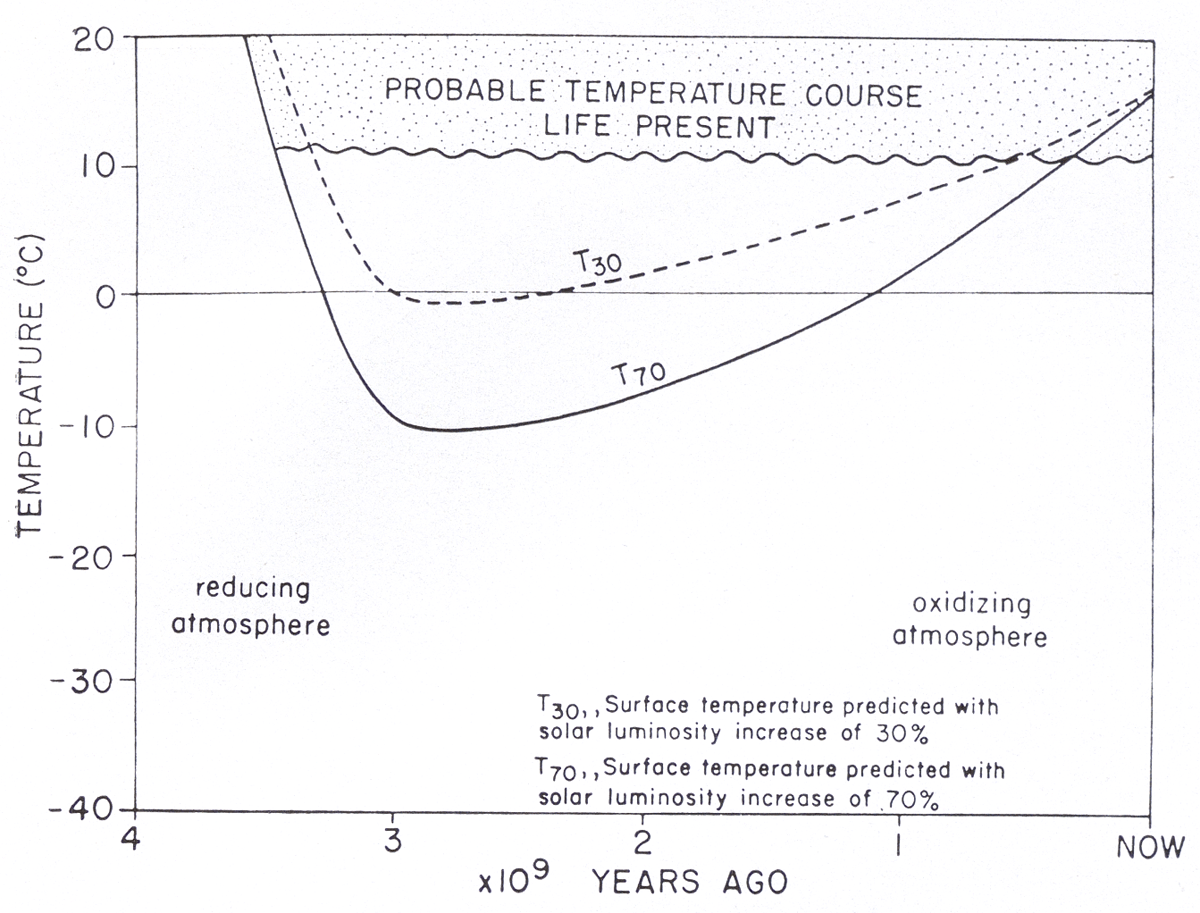
Figure 1
The mean surface temperature of the Earth as portrayed by Lovelock & Margulis (1974), highlighting the faint young Sun puzzle – that with current atmospheric composition the early Earth would have been frozen. The shaded area is described as the ‘temperature range deduced from the geological record and the persistence of life’. Nowadays a 30% increase in solar output since the formation of the Earth (4.56 × 10⁹ years) is considered realistic, and an interval of considerable early stellar mass loss producing cooling from high temperatures is considered unrealistic (Basinger et al., 2024) – thus exacerbating the faint young Sun puzzle. Reproduced from Lovelock & Margulis (1974) under CC BY (DOI: https://doi.org/10.3402/tellusa.v26i1-2.9731).
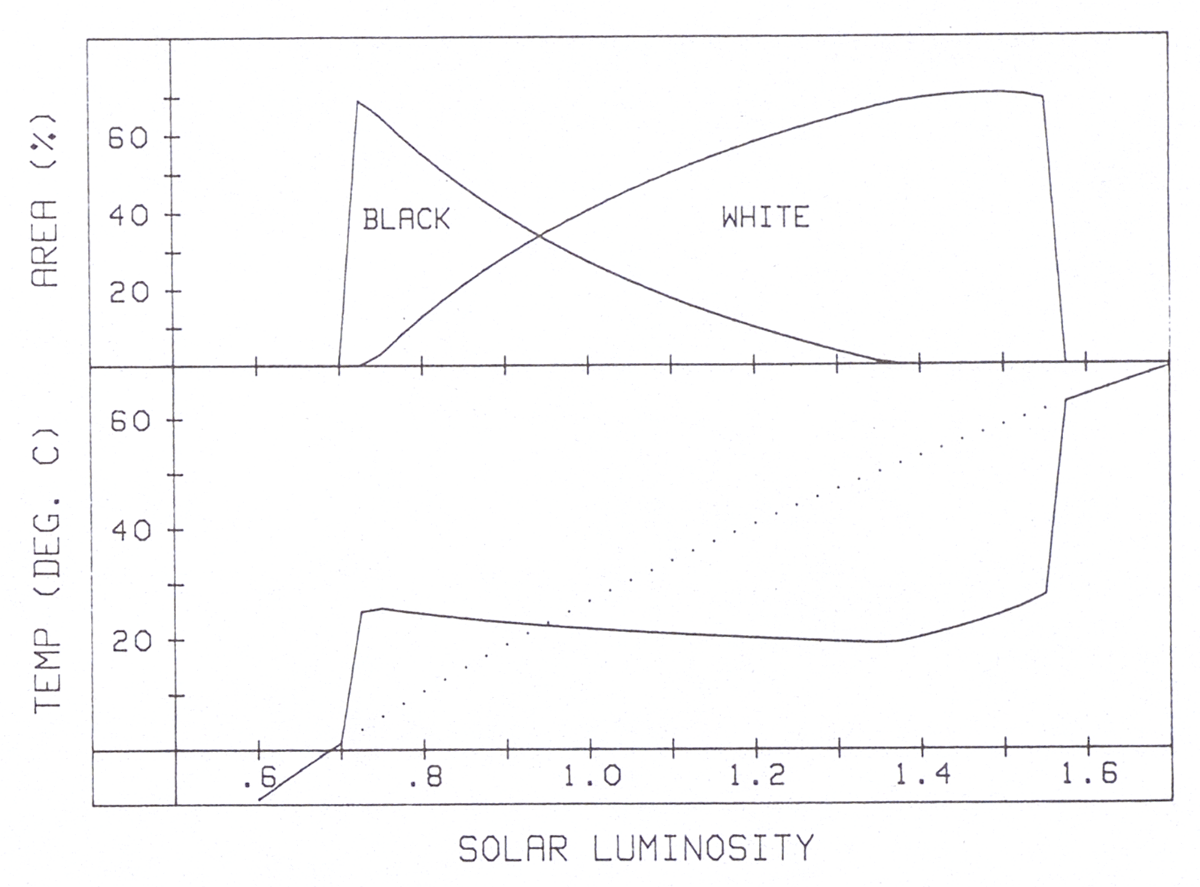
Figure 2
The Daisyworld model as introduced in Tellus (Watson & Lovelock, 1983). The top panel shows the areal coverage of black and white daisies (albedos 0.25 and 0.75, respectively). The bottom panel shows global temperature, as solar luminosity is increased (the dotted line indicates the temperature of the planet without life). Reproduced from Watson & Lovelock (1983) under CC BY (DOI: https://doi.org/10.3402/tellusb.v35i4.14616).
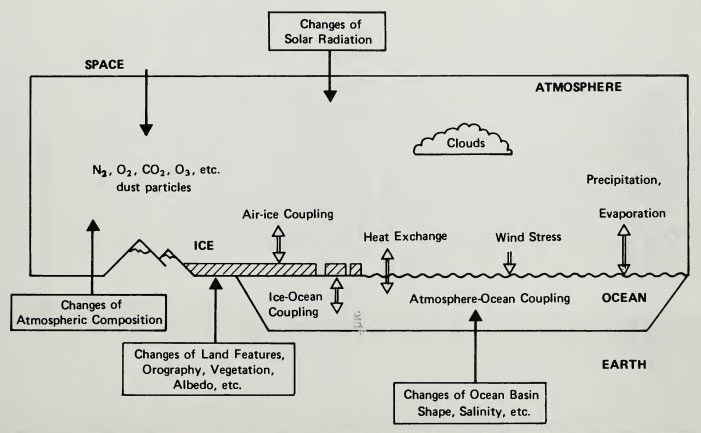
Figure 3
A 1970s rendering of the physical climate system, where ‘The full arrows are examples of external processes, and the open arrows are examples of internal processes in climatic change’ (National Research Council, 1975, p. 14). Life (‘vegetation’) is viewed as external to the climate system. Credit: National Research Council, 1975. Understanding Climatic Change: A Program for Action (DOI: https://doi.org/10.17226/27501). Reproduced with permission from the National Academy of Sciences, courtesy of National Academies Press, Washington, DC.
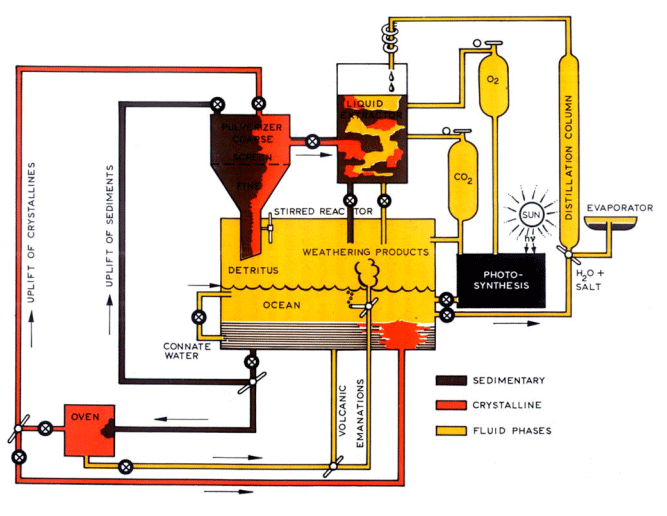
Figure 4
A late1960s rendering of geochemical cycling described as ‘A chemical engineering analogy to the surface geochemical cycle’ (Siever, 1968). Life (‘photosynthesis’) is one part of the chemical factory. Reproduced from Siever (1968) (DOI: https://doi.org/10.1111/j.1365-3091.1968.tb00837.x) with permission from John Wiley and Sons.
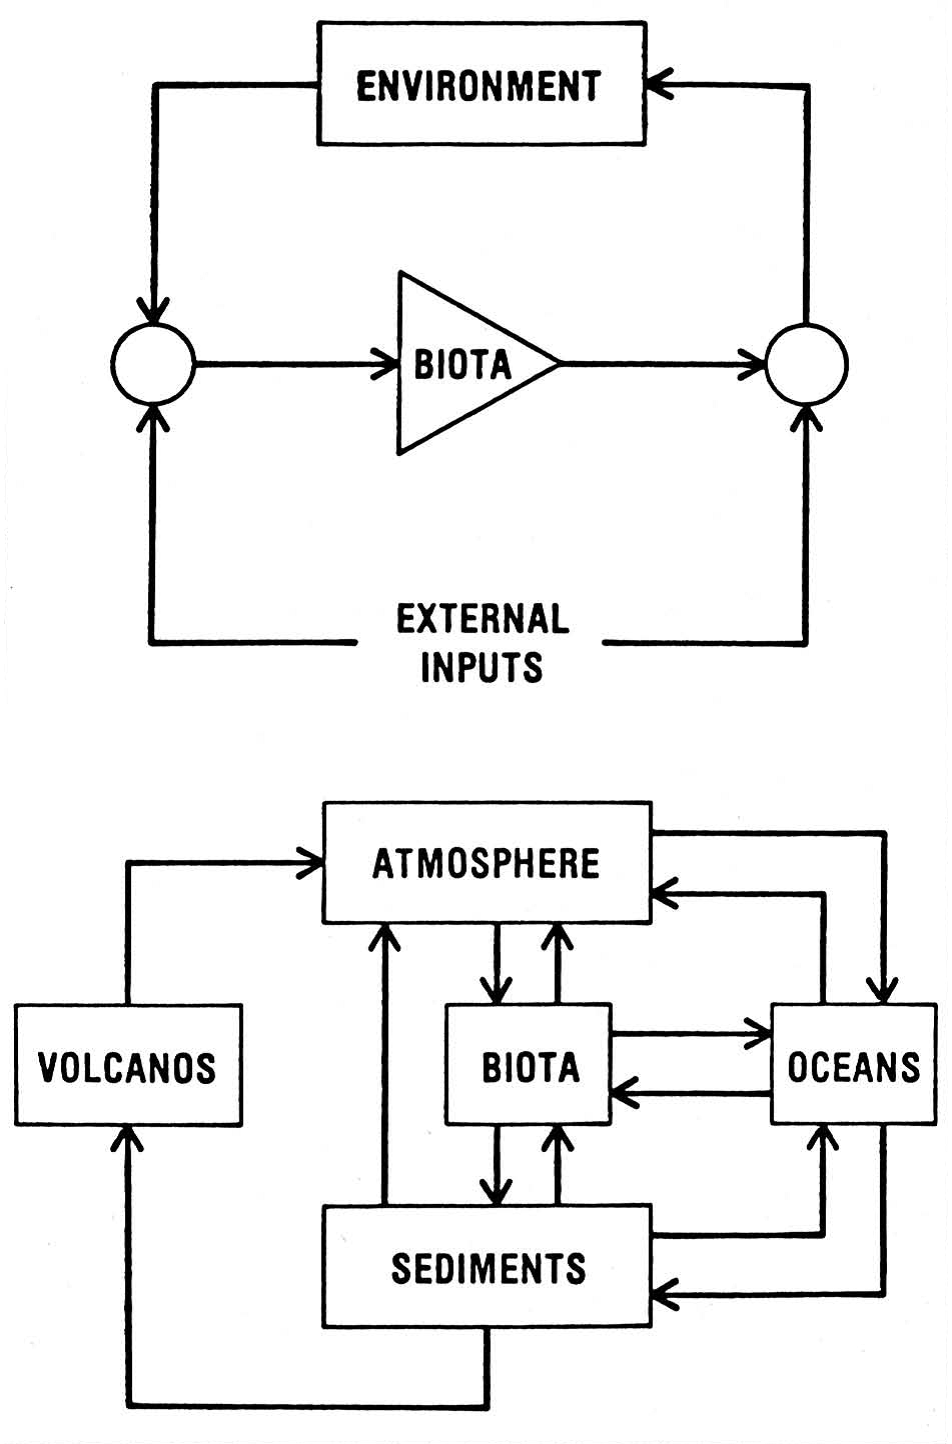
Figure 5
Lovelock’s (1986) contrasting of (top) a geophysiological (Gaian) model, and (bottom) a biogeochemical model. Reproduced from (Lovelock, 1986) (DOI: https://doi.org/10.1175/1520-0477-67.4.390) with permission from the American Meteorological Society.
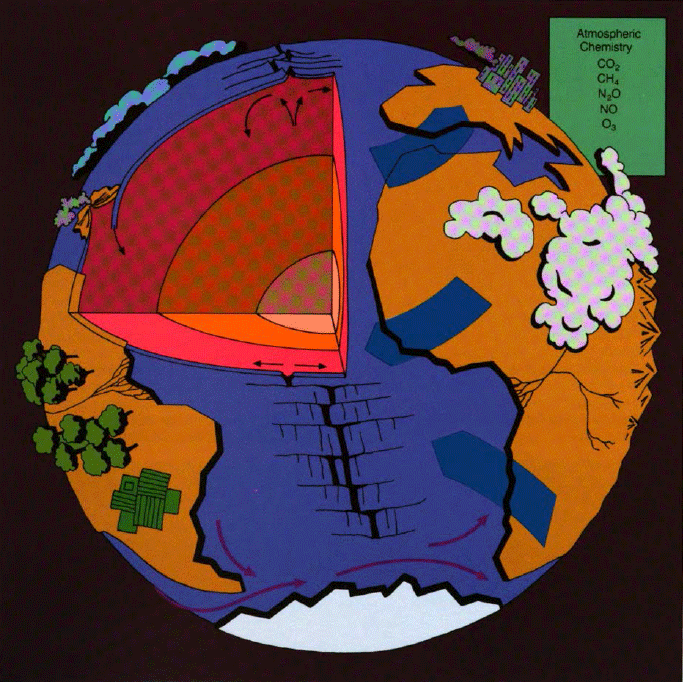
Figure 6
NASA’s schematic view of the Earth system including the whole inner planet, from NASA (1986). Credit: National Research Council. 1986. Earth System Science: Overview: A Program for Global Change (DOI: https://doi.org/10.17226/19210). Reproduced with permission from the National Academy of Sciences, courtesy of National Academies Press, Washington, DC.