
Figure 1
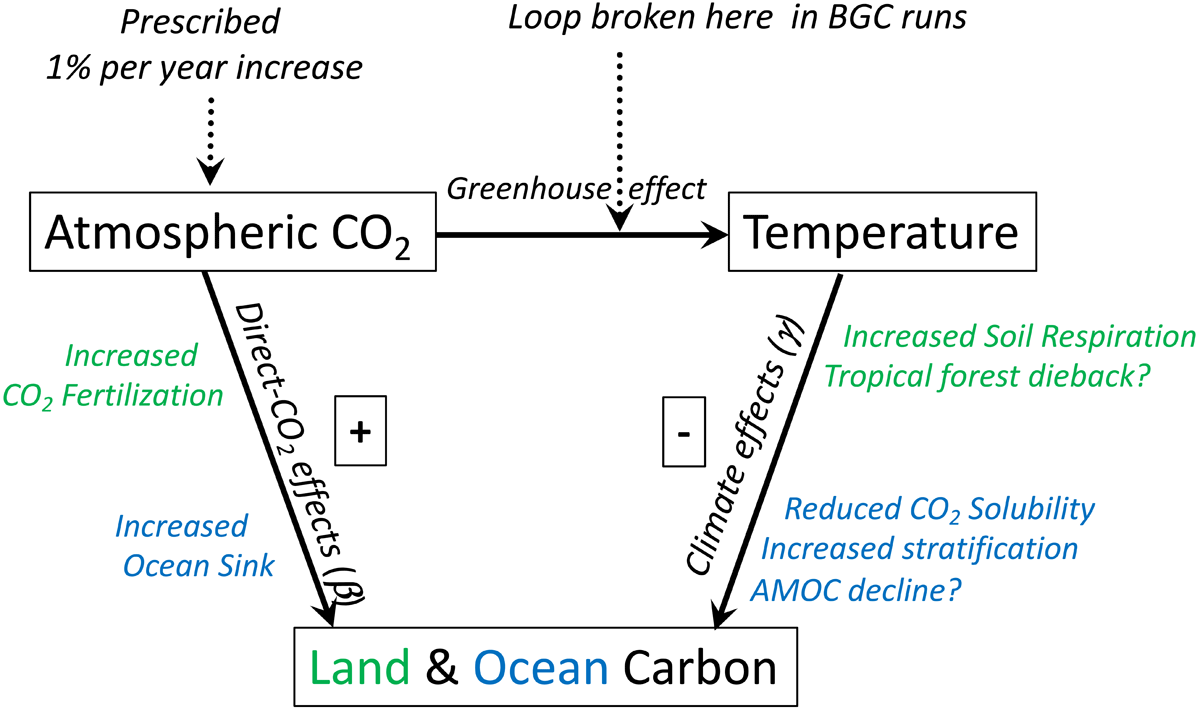
Schematic diagram showing the key interactions quantified in C4MIP climate-carbon cycle runs. In the latest versions of C4MIP, CO2 is not an internal model variable but is instead prescribed to increase by 1% per year. In the coupled runs, CO2 affects land and ocean carbon storage both directly (‘-effects’), and indirectly, as a result of the climate change caused by the CO2 increase (‘-effects’). In the BGC runs, the climate change effects are disabled by breaking the link between CO2 and climate. In this study, climate effects are defined as the difference between the BGC and coupled runs.
Table 1
Parameters for the old formulation: land and ocean carbon-concentration ( PgC ppm-1) and carbon-climate (, PgC ) sensitivity parameters, shown for 2×CO2 and 4×CO2 in CMIP6 ESMs. As presented in Arora et al. (2020), but with values shown to just one decimal place. ∗The parameters for CNRM-ESM2-1 were recalibrated for this study.
| EARTH SYSTEM MODEL | 2×CO2 | 4×CO2 | ||||||
|---|---|---|---|---|---|---|---|---|
| ACCESS-ESM1.5 | 0.75 | –12.0 | 1.06 | –11.7 | 0.37 | –21.1 | 0.90 | –23.8 |
| BCC-CSM2-MR | 2.22 | –132.8 | 1.09 | –12.4 | 1.81 | –163.1 | 0.92 | –19.9 |
| CESM2 | 0.98 | –12.8 | 0.84 | –4.24 | 0.90 | –21.6 | 0.71 | –10.9 |
| CNRM-ESM2-1∗ | 1.36 | –48.4 | 0.62 | –4.0 | 1.36 | –83.7 | 0.57 | –9.5 |
| CanESM5 | 1.42 | –6.22 | 0.90 | –7.71 | 1.28 | 16.0 | 0.77 | –14.7 |
| GFDL-ESM4 | 1.08 | –50.7 | 0.97 | –8.97 | 0.93 | –80.1 | 0.84 | –21.7 |
| IPSL-CM6A-LR | 1.11 | –12.2 | 0.87 | –7.37 | 0.62 | –8.7 | 0.76 | –13.0 |
| MIROC-ES2L | 1.45 | –63.4 | 0.85 | –10.4 | 1.12 | –69.6 | 0.73 | –22.3 |
| MPI-ESM1.2-LR | 1.08 | –0.81 | 0.88 | –11.4 | 0.71 | –5.17 | 0.77 | –20.1 |
| NorESM2-LM | 0.94 | –15.6 | 0.88 | –9.34 | 0.85 | –21.0 | 0.78 | –19.6 |
| UKESM1-0-LL | 1.00 | –24.0 | 0.88 | –7.35 | 0.75 | –38.4 | 0.75 | –14.1 |
| Ensemble mean | 1.22 | –34.1 | 0.91 | –8.59 | 0.97 | –45.1 | 0.78 | –17.2 |
| Ensemble SD | 0.40 | 38.4 | 0.09 | 2.90 | 0.40 | 50.6 | 0.07 | 5.0 |
Table 2
Best-fit values for the new formulation: initial carbon-concentration sensitivity, (PgC ppmv-1), carbon-climate sensitivity, (PgC K-1), and half saturation constant, (ppmv), for land and ocean carbon uptake in each of the C4MIP models. Also shown are the characteristic timescales, (years), for land and ocean, although these are not fitting parameters. We fix years for all the models, and diagnose for each model from the initial land carbon and NPP—see Section 3.1.
| MODEL | LAND | OCEAN | ||||||
|---|---|---|---|---|---|---|---|---|
| ACCESS-ESM1.5 | 6.8 | –26 | 46 | 36.5 | 6.0 | –50 | 307 | 100 |
| BCC-CSM2-MR | 5.3 | –234 | 532 | 44.2 | 6.0 | –45 | 323 | 100 |
| CESM2 | 3.0 | –33 | 659 | 53.0 | 5.0 | –24 | 291 | 100 |
| CNRM-ESM2-1 | 4.1 | –153 | 904 | 55.5 | 3.3 | –25 | 418 | 100 |
| CanESM5 | 3.4 | 17 | 828 | 33.5 | 5.4 | –36 | 297 | 100 |
| GFDL-ESM4 | 2.0 | –82 | 1022 | 18.7 | 6.1 | –46 | 290 | 100 |
| IPSL-CM6A-LR | 3.4 | –12 | 218 | 25.2 | 5.6 | –30 | 310 | 100 |
| MIROC-ES2L | 3.9 | –94 | 476 | 35.3 | 5.2 | –51 | 317 | 100 |
| MPI-ESM1-2-LR | 2.6 | –7 | 383 | 22.7 | 5.0 | –45 | 351 | 100 |
| NorESM2-LM | 4.7 | –50 | 397 | 86.2 | 5.3 | –51 | 337 | 100 |
| UKESM1-0-LL | 3.1 | –55 | 366 | 39.6 | 5.4 | –33 | 285 | 100 |
| Ensemble mean | 3.8 | –66 | 530 | 40.9 | 5.3 | –40 | 321 | 100.0 |
| Ensemble SD | 1.4 | 73 | 298 | 19.0 | 0.8 | 10 | 38 | 0.0 |
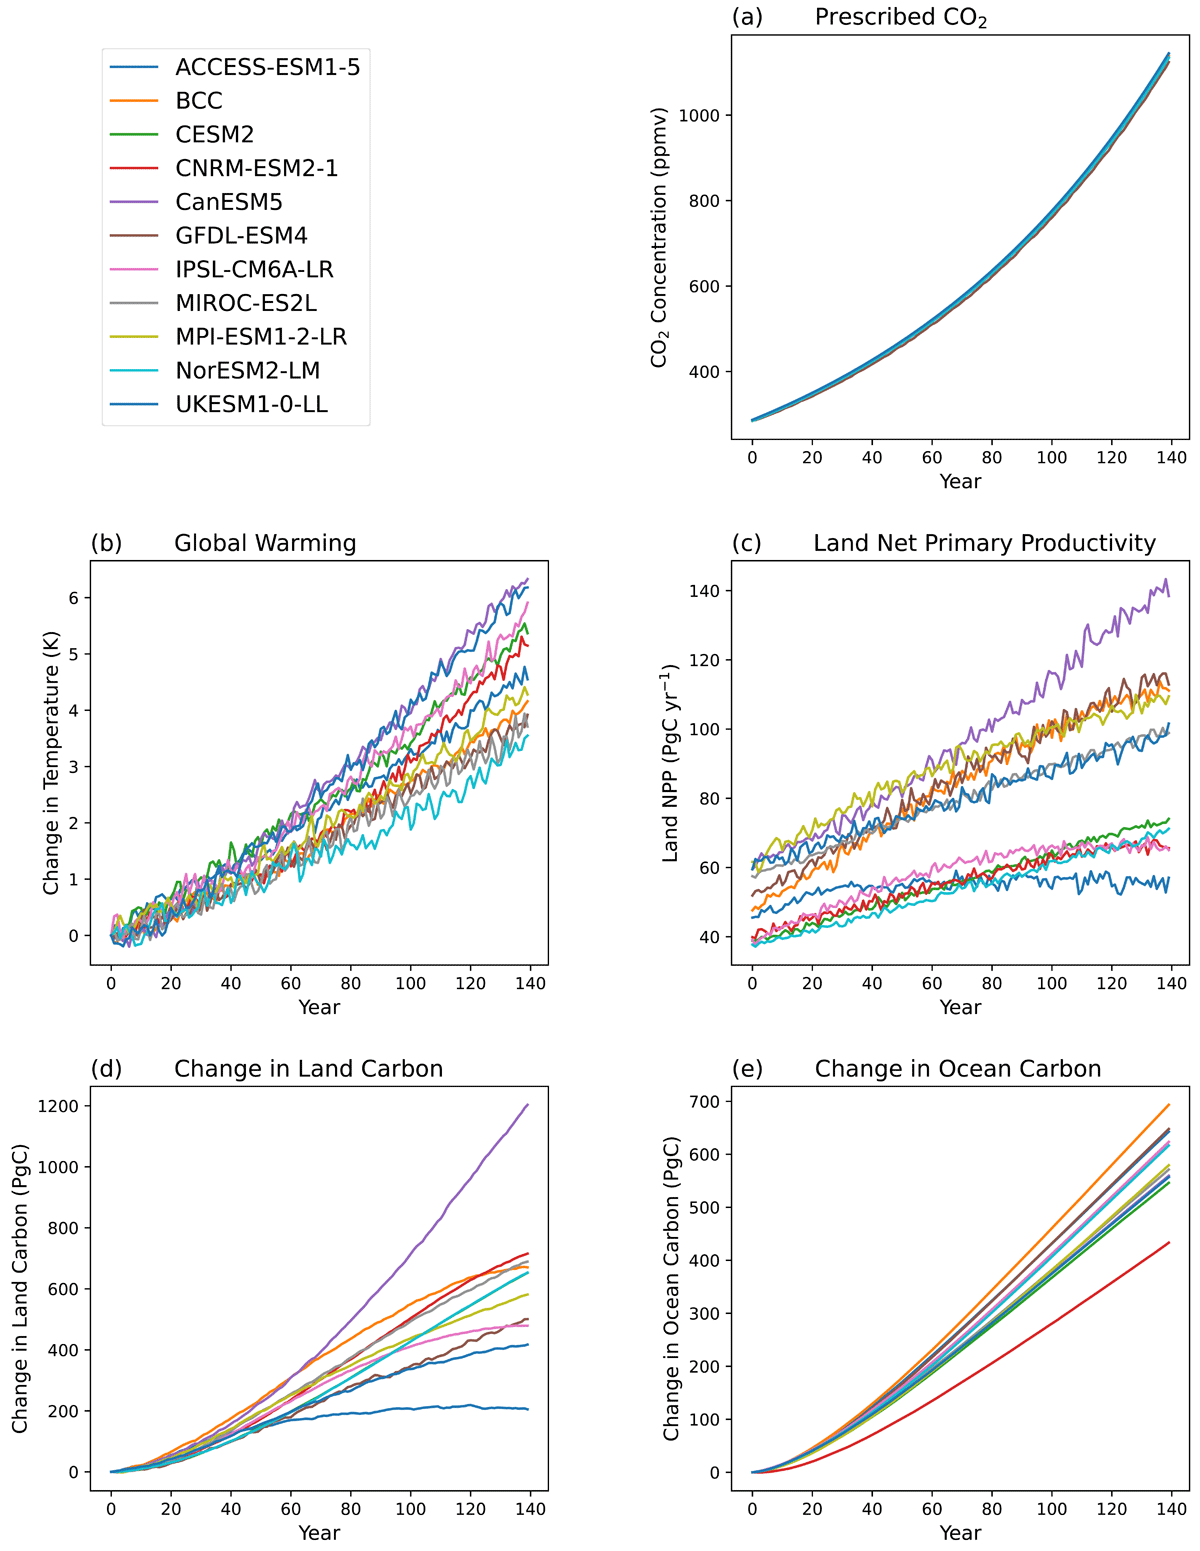
Figure 2
Global variables from the C4MIP coupled runs: (a) prescribed 1% per year increase in atmospheric CO2 concentration; (b) increase in global mean temperature; (c) global mean land net primary productivity; (d) change in land carbon storage; and (e) change in ocean carbon storage.
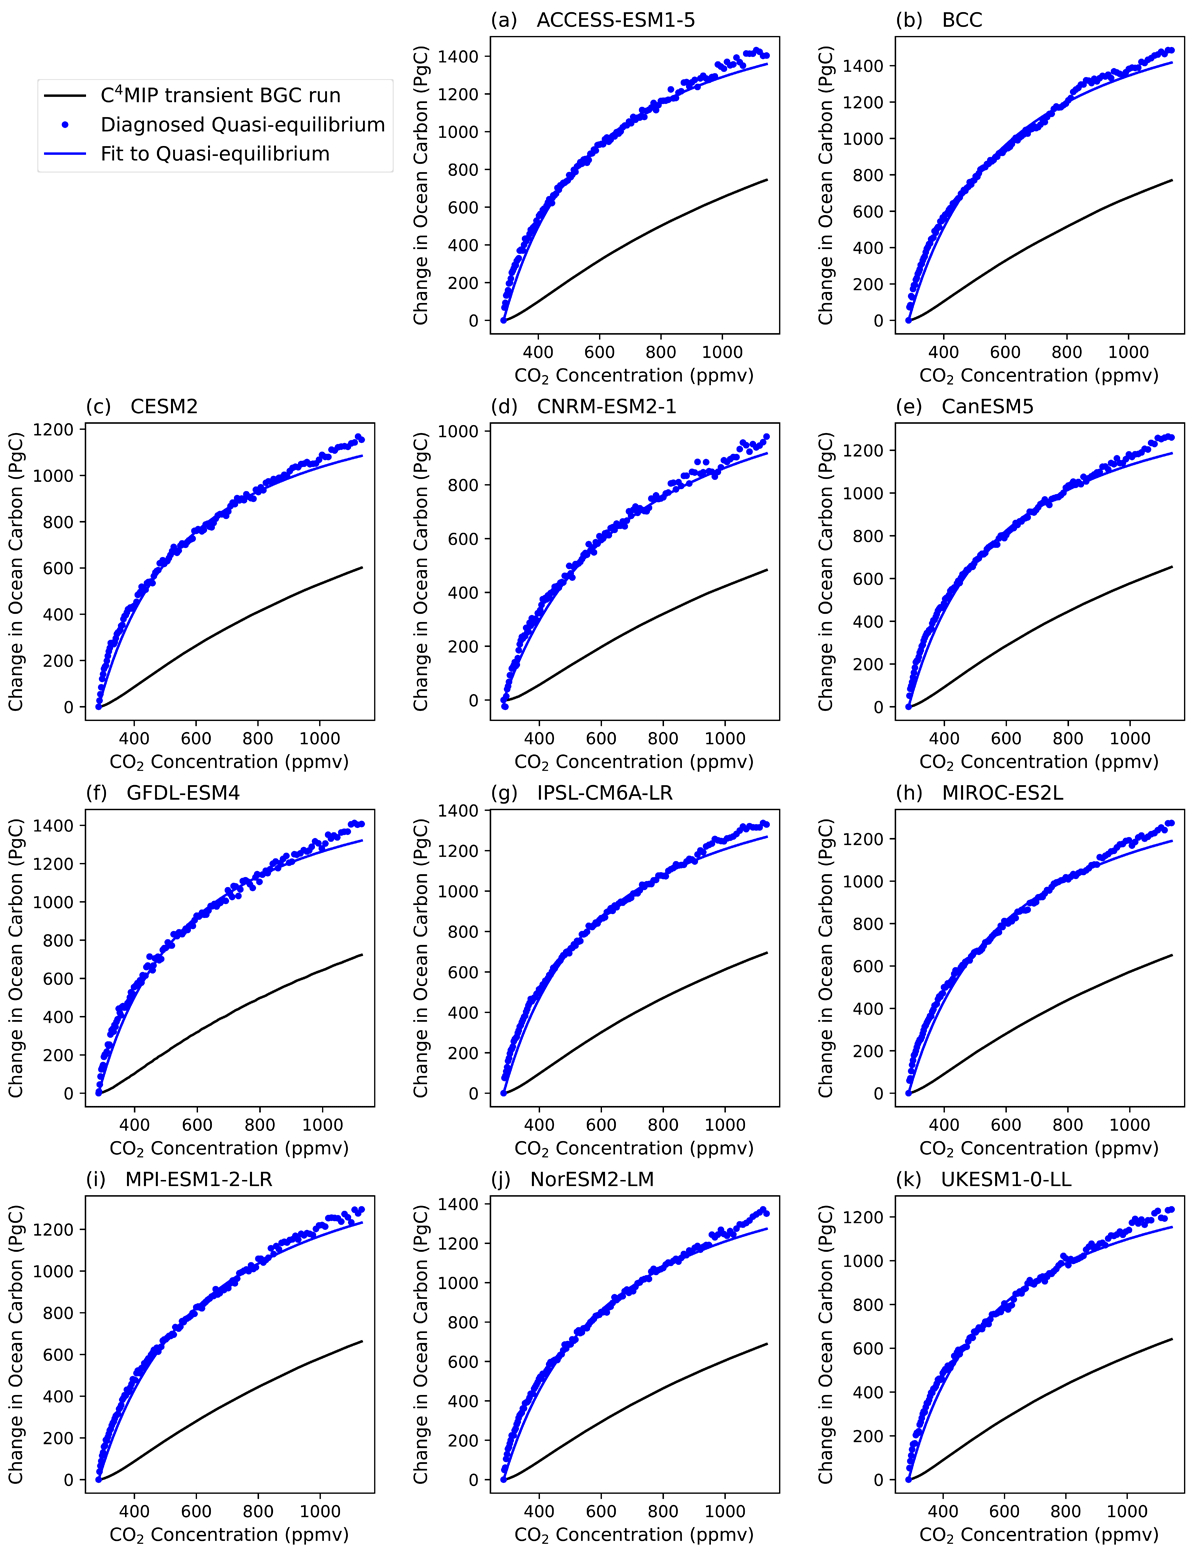
Figure 3
Fitting procedure for the CO2 response of the change in global ocean carbon storage, with a panel for each of the C4MIP models. Each panel shows the change in global mean ocean carbon from the C4MIP BGC run (black line); the quasi-equilibrium state inferred assuming a characteristic lifetime of 100 years in each model (blue dots); and our two-parameter fit to this quasi-equilibrium response (blue line).
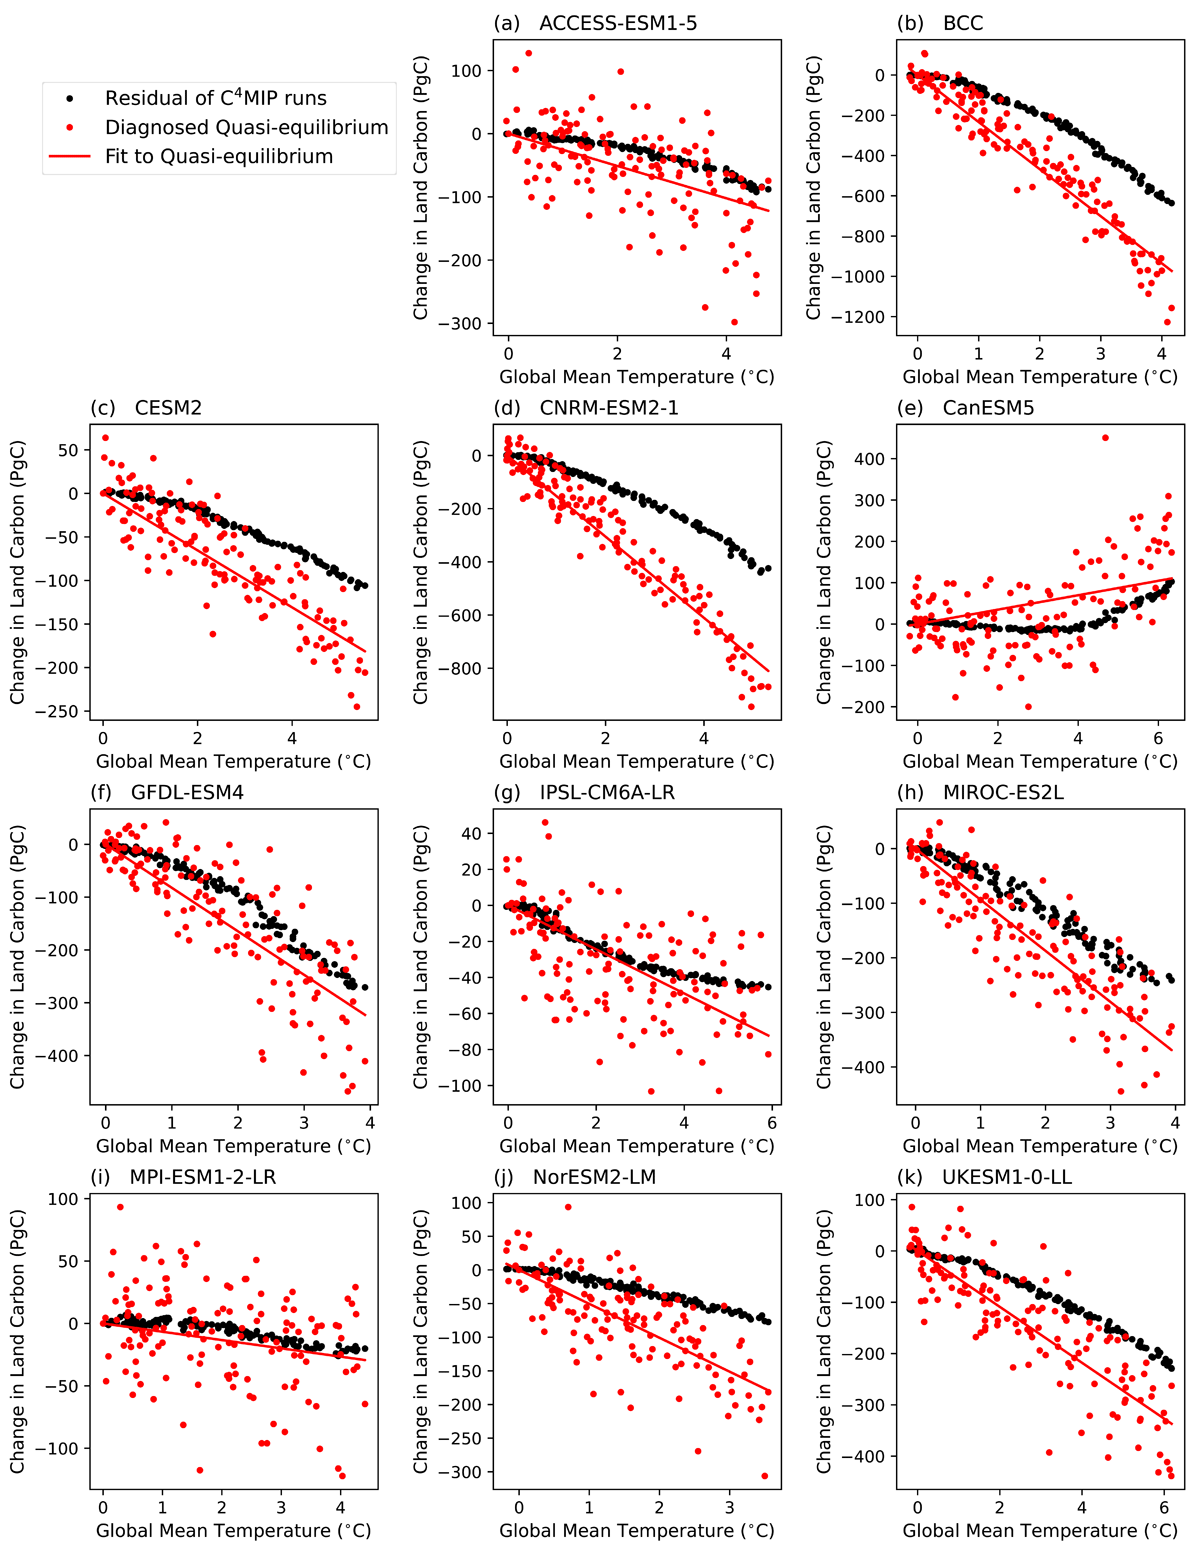
Figure 4
Fitting procedure for the climate response of global land carbon storage, with a panel for each of the C4MIP models. Each panel shows the change in global mean land carbon against global warming, calculated as the difference between the C4MIP BGC and coupled runs (black line); the quasi-equilibrium state inferred assuming a characteristic lifetime for land carbon in each model (red dots); and a linear fit to this quasi-equilibrium response (red line).
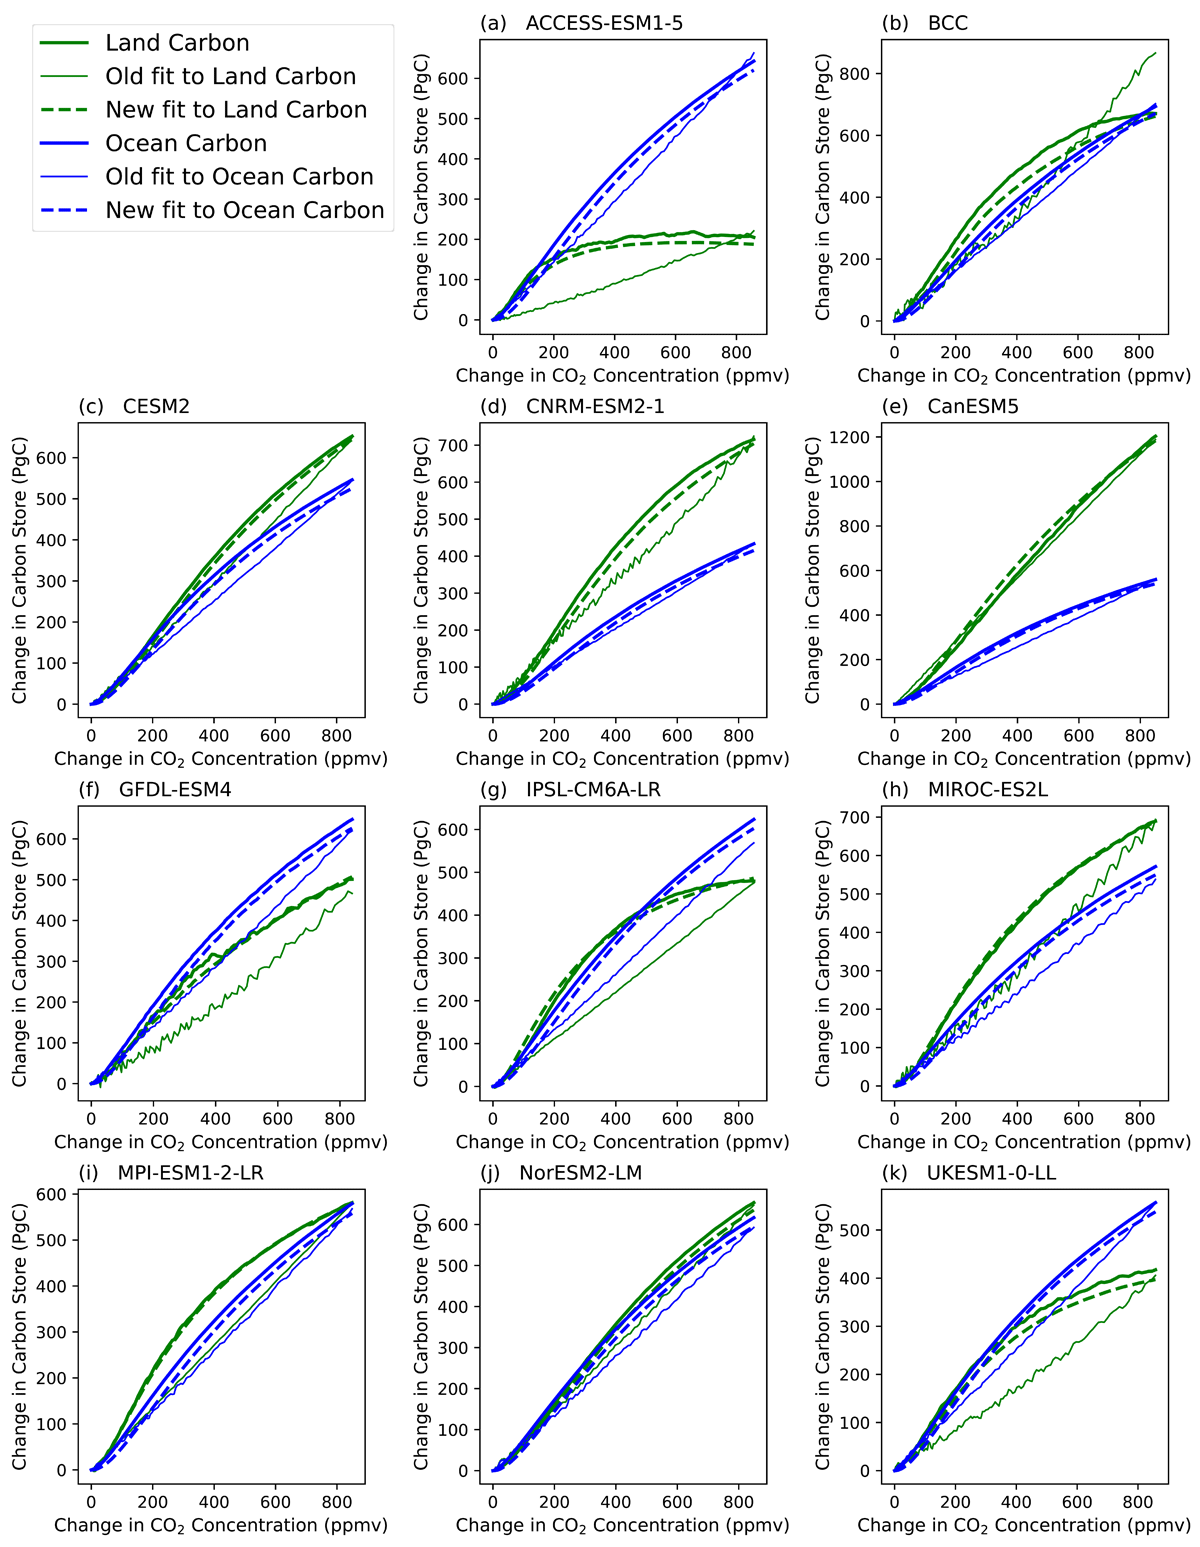
Figure 5
Comparison of fits to the change in land carbon storage (green lines) and ocean carbon storage (blue lines) for the coupled runs (thick continuous lines). Fits are shown for both the old model (thin continuous lines) and our new model (thick dashed lines).
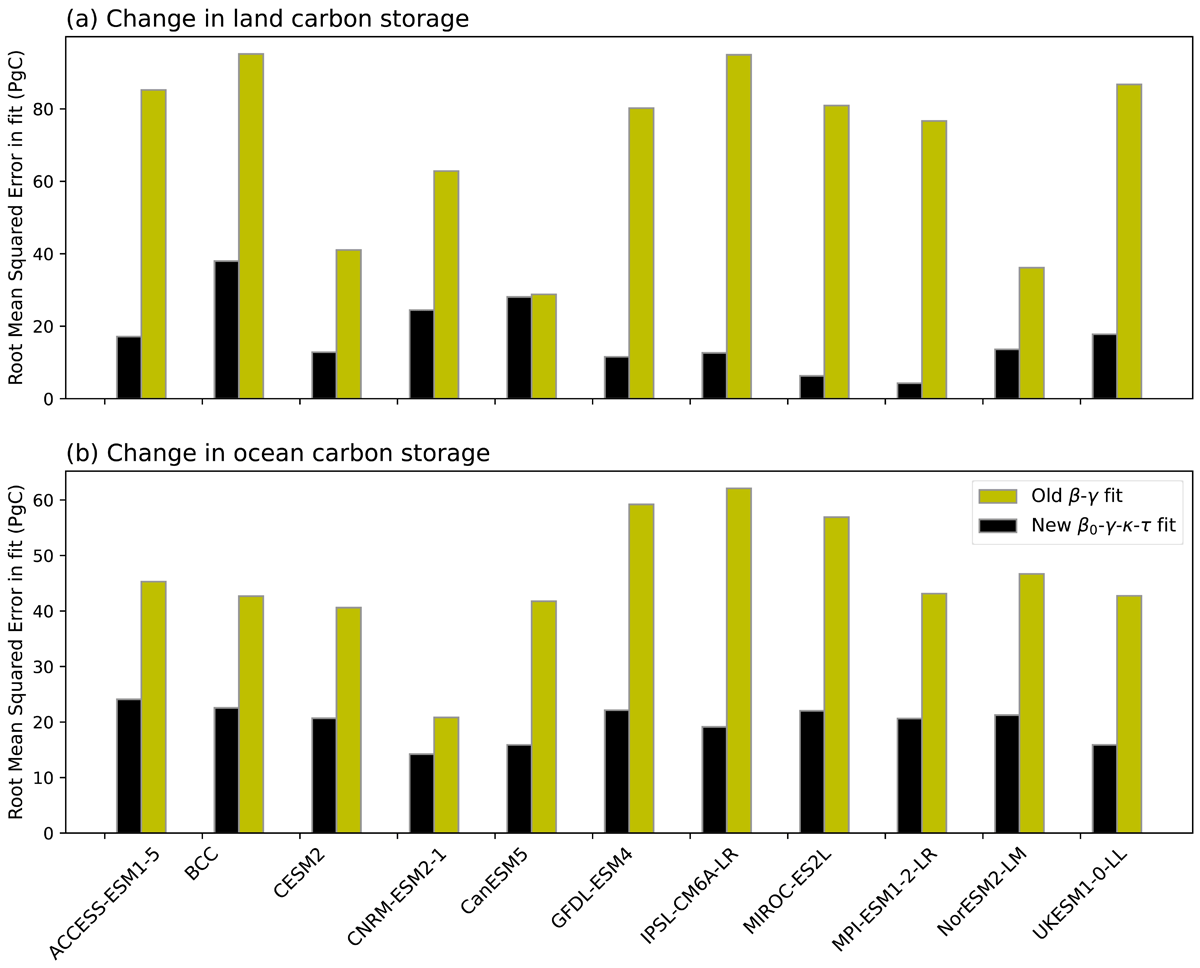
Figure 6
Root mean square errors in the fits of the old model (yellow bars), and the new model (black bars), for each of the C4MIP models: (a) change in land carbon; (b) change in ocean carbon.