
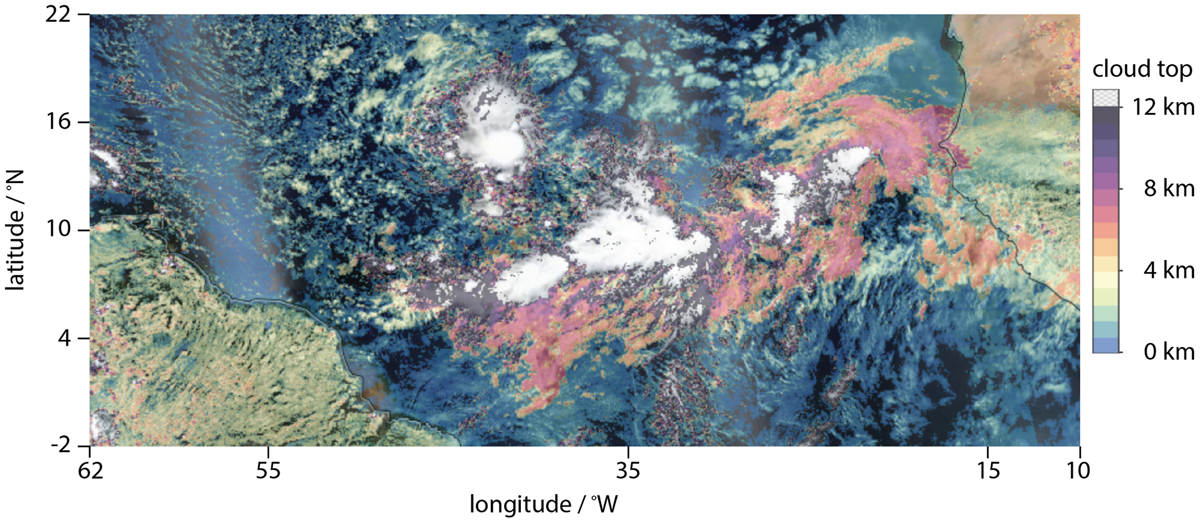
Figure 1
False color VIIRS image from the Suomi satellite showing the tropical Atlantic (62 to 10°W, –2 to 22°N) on 3 September 2024. Cloud-top height with the ainbow4 color-scale (blue-green-yellow-orange-pink-purple-gray) overlain with transparency on visible image, resulting in high clouds-tops (above about 12 km) appearing white.
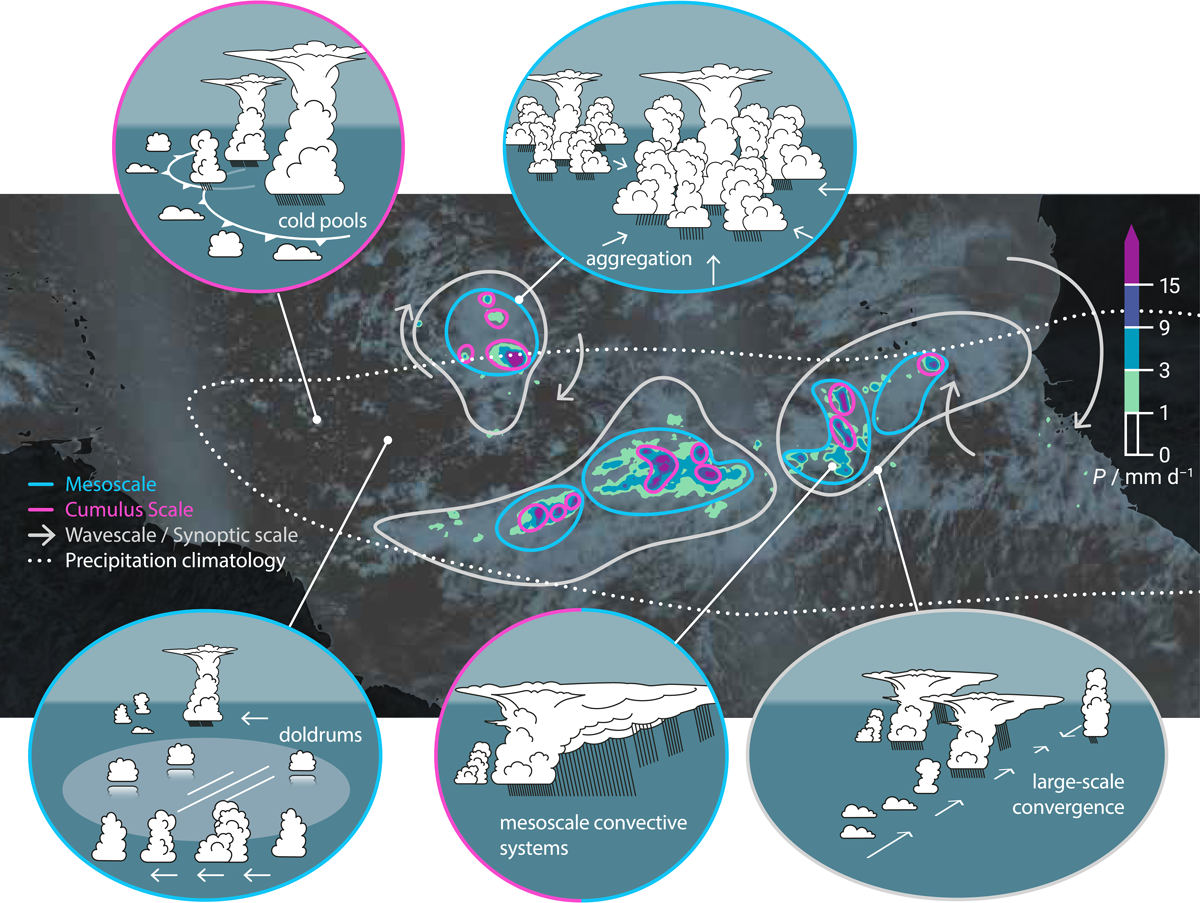
Figure 2
Conceptualizing the multi-scale interactions of clouds and precipitation. Features highlighted, clockwise from upper-left, are interacting cold pools initiating new convection, convective aggregation, edge intensified precipitation associated with the convergence and confluence of boundary layer winds, squall lines in regions of deep convective clusters, and doldrums within the inner ITCZ.
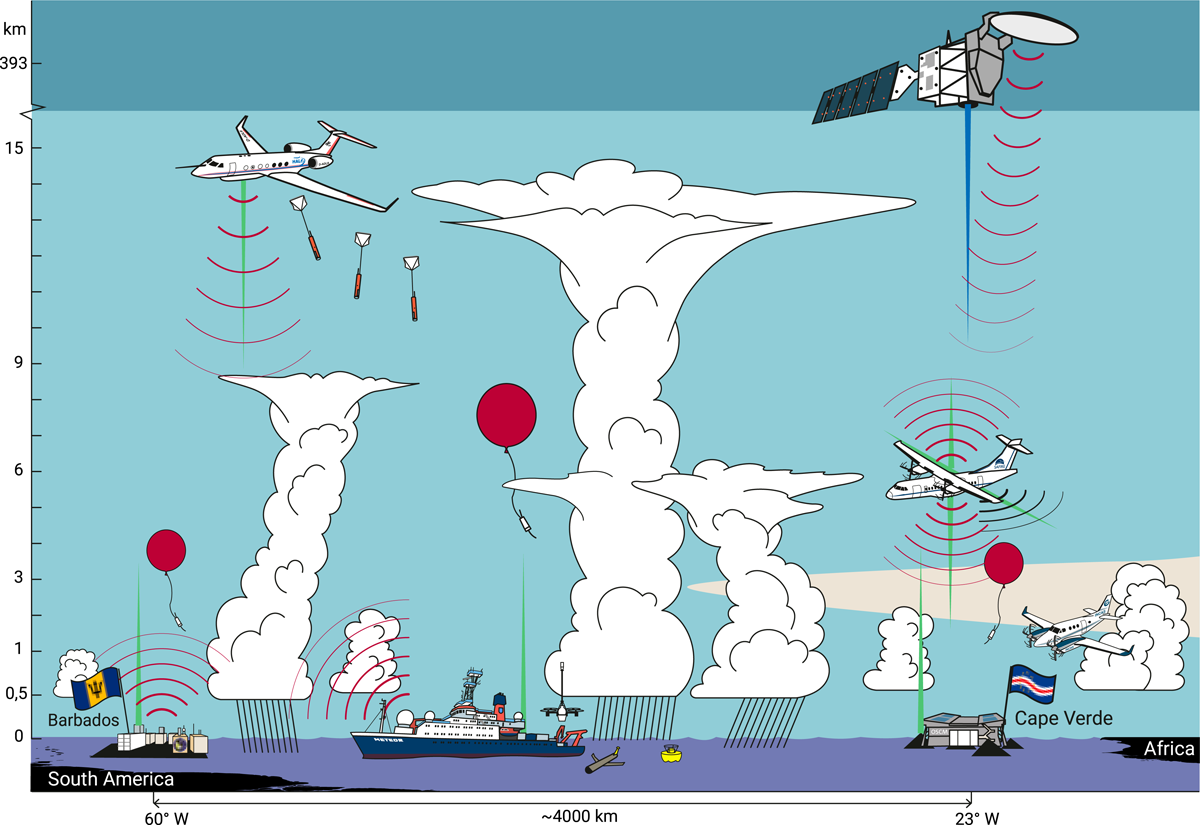
Figure 3
Different components and platforms: Research aircraft (HALO, ATR, King Air), R/V Meteor, gliders, highlighting the use of active remote sensing by radar and lidar and deployment of sondes. Measurements stretch across the Atlantic through the ITCZ, covering dust and its interaction with more organized convection in the East and Central Atlantic to regions of low winds and isolated convective towers in the West Atlantic.

Figure 4
ORCESTRA and sub-campaign logos.
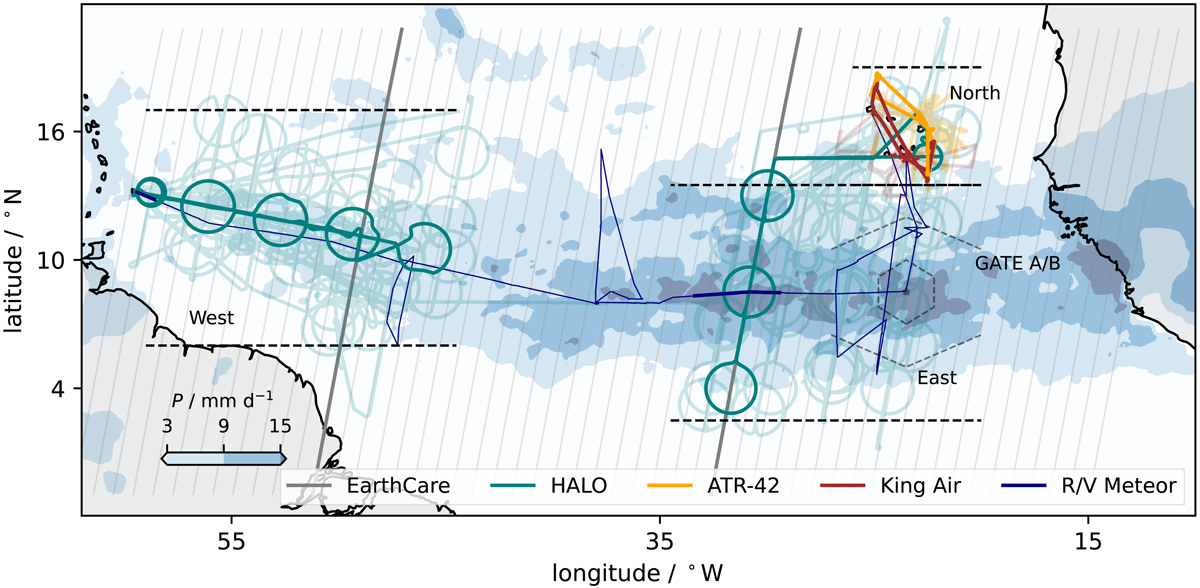
Figure 5
Data coverage following platform tracks. The tracks for the respective platforms differentiated by color, with transparency. For each platform, two days are plotted without transparency to help illustrate inter-platform coordination. The tracks for all platforms are shown for 09-03, coordination between the ATR-42, the KingAir and the Mindelo Ocean Science Center is highlighted for 08-20, while coordination between the R/V Meteor, HALO, and the BCO is highlighted for 09-23. Three sub-domains—ORCESTRA East, West, and North—are further delineated. The area of GATE Phase II and III measurements is shown for historical reference (dashed lines and hexagons). Precipitation on 09-03 from IMERG is shown in the shading.
Table 1
Summary of operation period of varied platforms. Due to ascent and descent measurements, many radiosondes measured two profiles. EarthCARE start is referring to the date when all four instruments were set to Nominal mode.
| PLATFORM | START | END | COMMENT |
|---|---|---|---|
| BCO Radiosondes | 2024-09-07 | 2024-09-29 | 276 radiosonde profiles |
| INMG Radiosondes | 2024-08-09 | 2024-09-11 | 277 radiosonde profiles |
| EarthCARE | 2024-08-10 | Standby CPR (not operative) status on Aug 28, 30, and Sept 2, 3, 21, and 23 | |
| R/V Meteor | 2024-08-16 | 2024-09-24 | 635 radiosonde profiles |
| DLR HALO | 2024-08-11 | 2024-09-28 | 23 flights, 1115 dropsondes |
| INCAS King Air | 2024-08-15 | 2024-09-07 | 9 flights |
| SAFIRE ATR-42 | 2024-08-10 | 2024-09-10 | 24 flights |
Table 2
Summary of coordinated activities among platforms. The period where coordination is possible is evident by the range of marked columns, and when platforms were co-located the cell is indicated by an ✗. Note that HALO coordinated with two separate ATR flights on 08-22.
| Cabo Verde | Barbados | |||||||||||||||||||||||||||||||||||||||||||||||||||
|---|---|---|---|---|---|---|---|---|---|---|---|---|---|---|---|---|---|---|---|---|---|---|---|---|---|---|---|---|---|---|---|---|---|---|---|---|---|---|---|---|---|---|---|---|---|---|---|---|---|---|---|---|
| August | September | |||||||||||||||||||||||||||||||||||||||||||||||||||
| # | Co-location | 10 | 15 | 20 | 25 | 30 | 5 | 11 | 15 | 20 | 25 | 29 | ||||||||||||||||||||||||||||||||||||||||
| Airborne | ||||||||||||||||||||||||||||||||||||||||||||||||||||
| 10 | HALO + ATR-42 | ✗ | ✗ | ✗ | ✗ | ✗ | ✗ | ✗ | ✗ | ✗ | ✗ | ✗ | ||||||||||||||||||||||||||||||||||||||||
| 4 | HALO + King Air | ✗ | ✗ | ✗ | ✗ | |||||||||||||||||||||||||||||||||||||||||||||||
| 4 | ATR-42 + King Air | ✗ | ✗ | ✗ | ✗ | |||||||||||||||||||||||||||||||||||||||||||||||
| R/V Meteor | ||||||||||||||||||||||||||||||||||||||||||||||||||||
| 10 | HALO | ✗ | ✗ | ✗ | ✗ | ✗ | ✗ | ✗ | ✗ | ✗ | ✗ | |||||||||||||||||||||||||||||||||||||||||
| 1 | ATR-42 | ✗ | ||||||||||||||||||||||||||||||||||||||||||||||||||
| 1 | King Air | ✗ | ||||||||||||||||||||||||||||||||||||||||||||||||||
| Mindelo | ||||||||||||||||||||||||||||||||||||||||||||||||||||
| 4 | HALO | ✗ | ✗ | ✗ | ✗ | ✗ | ||||||||||||||||||||||||||||||||||||||||||||||
| 1 | ATR-42 | ✗ | ||||||||||||||||||||||||||||||||||||||||||||||||||
| 3 | King Air | ✗ | ✗ | ✗ | ||||||||||||||||||||||||||||||||||||||||||||||||
| BCO | ||||||||||||||||||||||||||||||||||||||||||||||||||||
| 1 | HALO | ✗ | ||||||||||||||||||||||||||||||||||||||||||||||||||
| 1 | R/V Meteor | ✗ | ✗ | ✗ | ||||||||||||||||||||||||||||||||||||||||||||||||
| EarthCARE | ||||||||||||||||||||||||||||||||||||||||||||||||||||
| 21 | HALO | ✗ | ✗ | ✗ | ✗ | ✗ | ✗ | ✗ | ✗ | ✗ | ✗ | ✗ | ✗ | ✗ | ✗ | ✗ | ✗ | ✗ | ✗ | ✗ | ✗ | ✗ | ||||||||||||||||||||||||||||||
| 6 | ATR-42 | ✗ | ✗ | ✗ | ✗ | ✗ | ✗ | |||||||||||||||||||||||||||||||||||||||||||||
| 6 | King Air | ✗ | ✗ | ✗ | ✗ | ✗ | ✗ | |||||||||||||||||||||||||||||||||||||||||||||
| 6 | R/V Meteor | ✗ | ✗ | ✗ | ✗ | ✗ | ||||||||||||||||||||||||||||||||||||||||||||||
| - | Mindelo | |||||||||||||||||||||||||||||||||||||||||||||||||||
| SAR | ||||||||||||||||||||||||||||||||||||||||||||||||||||
| 2 | ATR-42 + Sentinel 1 | ✗ | ✗ | |||||||||||||||||||||||||||||||||||||||||||||||||
| 6 | ATR-42 + RCM | ✗ | ✗ | ✗ | ✗ | ✗ | ✗ | |||||||||||||||||||||||||||||||||||||||||||||
| PACE | ||||||||||||||||||||||||||||||||||||||||||||||||||||
| 3 | HALO | ✗ | ✗ | ✗ | ||||||||||||||||||||||||||||||||||||||||||||||||
Table 3
Mean precipitation from IMERG for different ORCESTRA sub-domains during period of intensive measurement and August–September SST anomalies from the 1992–2011 mean from the Optimum Interpolation of Sea Surface Temperature (Banzon et al., 2020).
| COORDINATES | PERIOD | PRECIP / mm d–1 | Δ SST / K | ||||
|---|---|---|---|---|---|---|---|
| REGION | SW | NE | BEGIN | END | 2024 | CLIM. | |
| North | 26.0°W, 13.5°N | 20.0°W, 19.0°N | 10 Aug | 10 Sep | 0.6 | 1.6 | 0.69 |
| East | 34.5°W, 2.5°N | 20.0°W, 13.5°N | 10 Aug | 5 Sep | 9.1 | 8.7 | 0.05 |
| West | 59.0°W, 6.0°N | 44.5°W, 17.0°N | 5 Sep | 30 Sep | 2.9 | 3.6 | 0.17 |
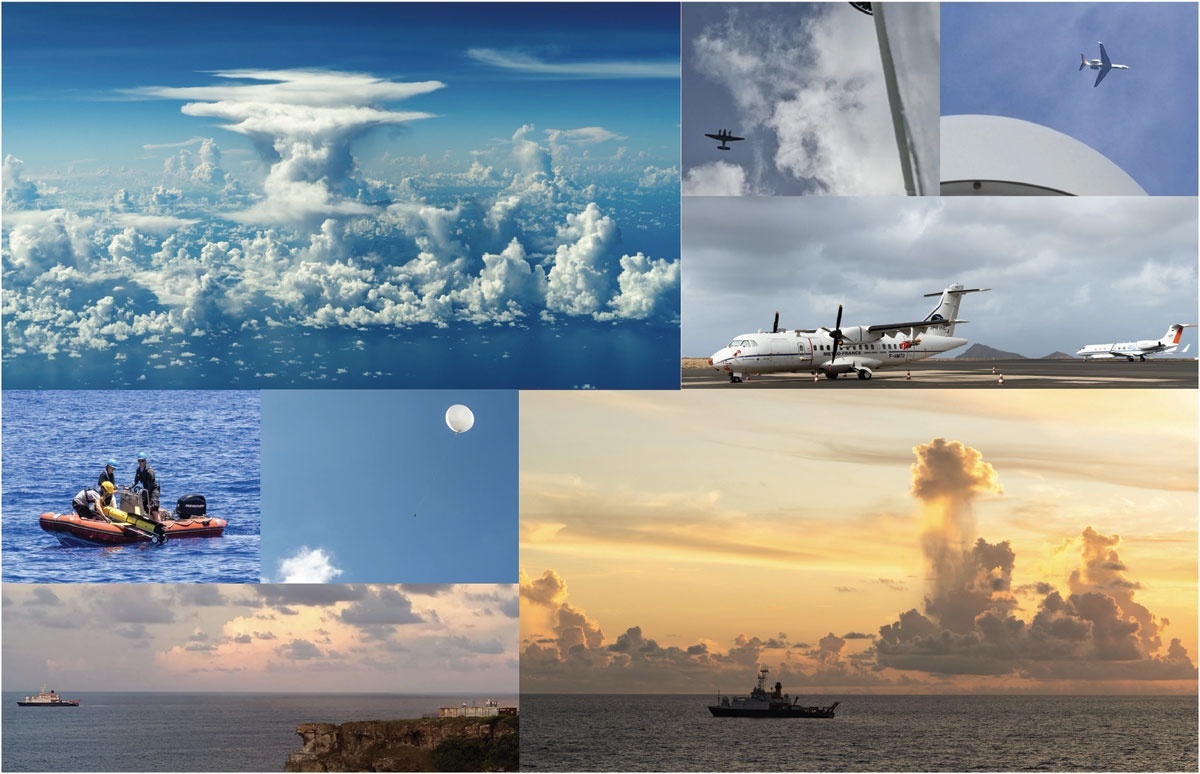
Figure 6
Coordination of instrument platforms during ORCESTRA. From upper left, a view of upright and isolated convection in a weak wind regime (note cloud reflection on surface) of the Western Atlantic taken from the flight deck of HALO. King Air and HALO overpasses of the R/V Meteor. The ATR-42 and HALO preparing for measurements on Sal. Retrieval of a glider from a Zodiac deployed from the R/V Meteor, one of many sounding ascents from the BCO, INMG, or the Meteor, coordinated measurements between the R/V Meteor and the BCO, and convection in the vicinity of the R/V Meteor as seen from the BCO. The contrasting fate of condensate is highlighted by the first and last images.
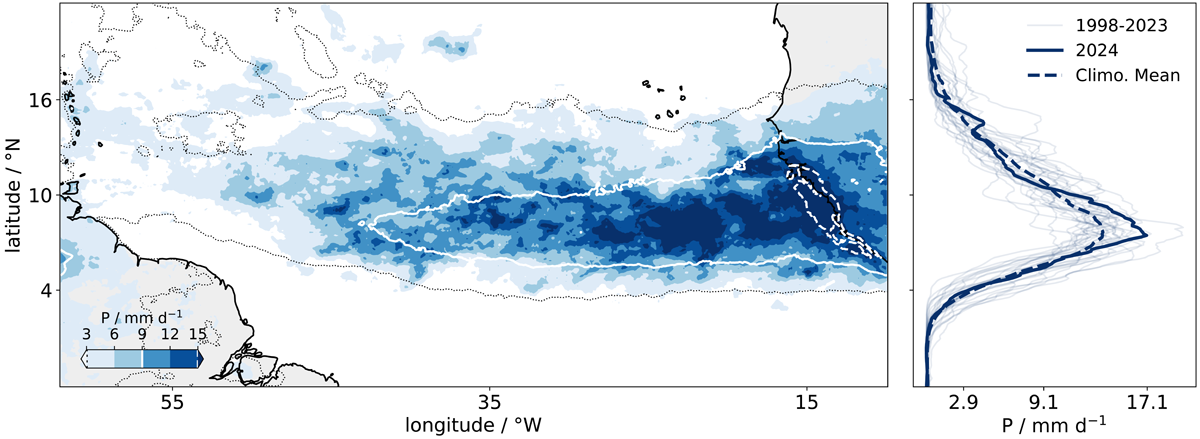
Figure 7
Mean precipitation for ORCESTRA period compared to climatology (white dashed line: 15 mm d-1, white solid line: 9 mm d-1, black dotted line: 3 mm d-1) averaged over the entire IMERG record. The right panel shows the zonal mean between 20 and 30° W. Tick mark labels on the ordinate axis denote the mean precipitation in the ORCESTRA West and East domains, and the latitudinal max, respectively.
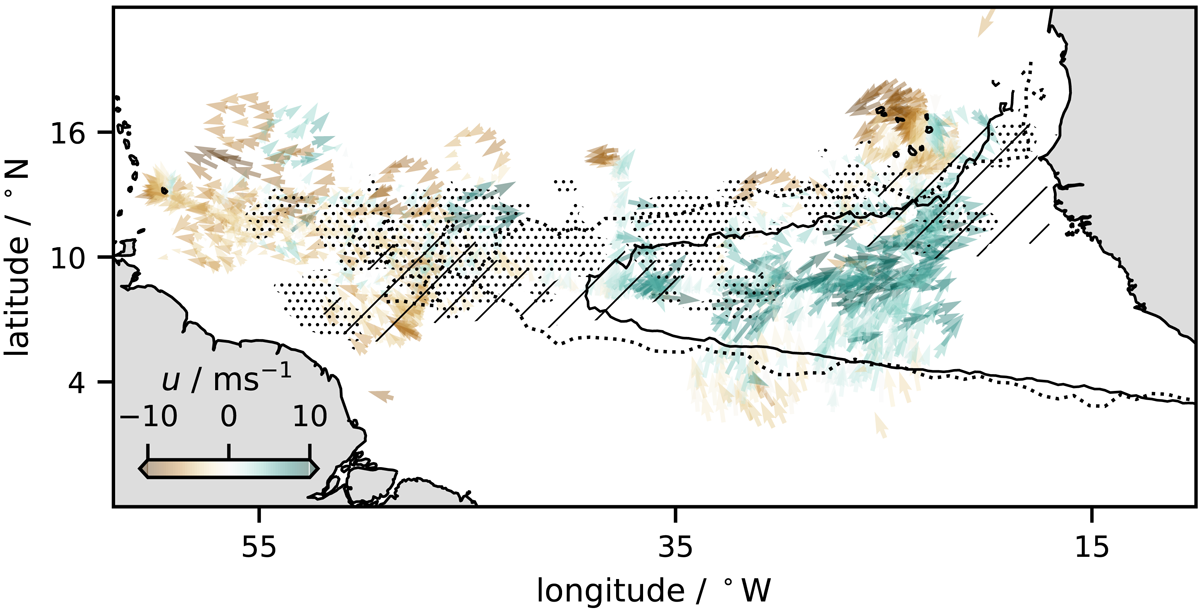
Figure 8
Near surface winds from ORCESTRA sondes, plotted as arrows colored by zonal wind (green denotes westerlies, brown easterlies). Contour delineates region of 2008–2024 westerlies (solid, black) and 2024 westerlies (dotted, black) by 0 ms-1 zonal wind contour. Doldrums shown as stippled (2024) and hatched as taken. Winds contours and stippling taken from ASCAT August–September 2008–2024 mean.
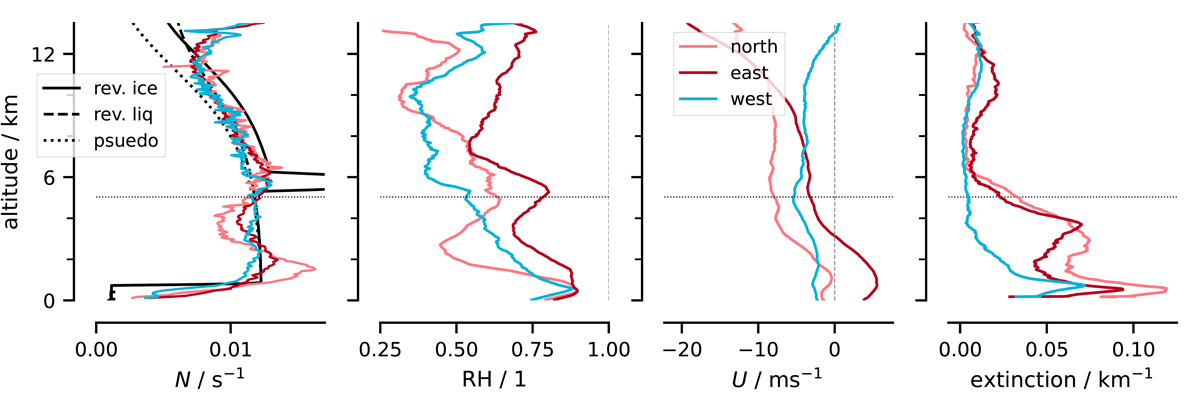
Figure 9
Profiles of static stability, relative humidity and zonal wind for the ORCESTRA domains from all soundings, and extinction from cloud-free scenes sampled by WALES. Shown with the static stability are the indicated adiabats. Estimates of standard error are not shown, but differences among profiles are robust to sampling.
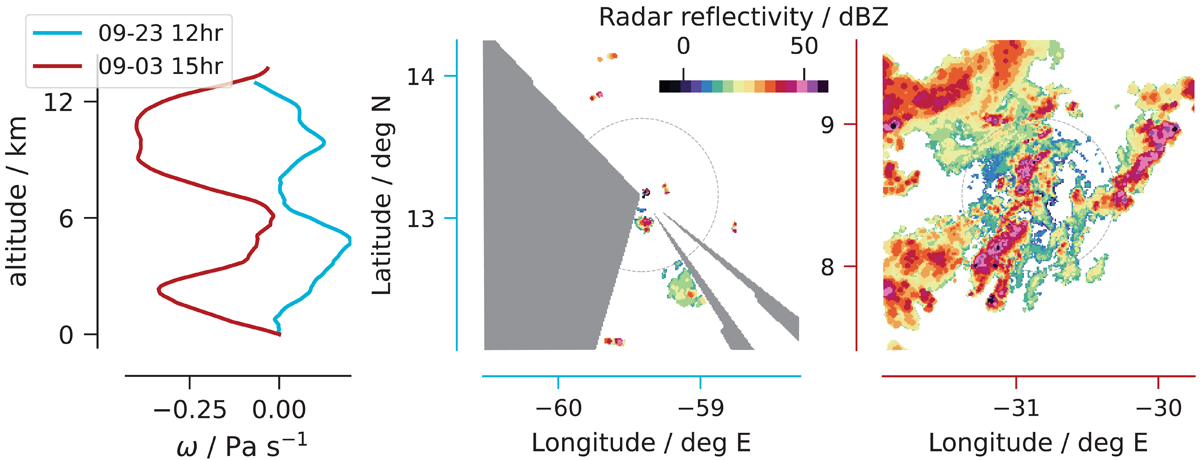
Figure 10
Maximum reflectivities from SEA-POL volume scans in the West, on 09-23 (middle panel) and in the East on 09-03 (right panel), with accompanying vertical motion from HALO dropsondes. For scale 60 km diameter circle is indicated by the dashed line. Blank regions for the radar in the West are due to obstructions from the ship and its masts; this was avoided for the image on the right through the circling of the ship.
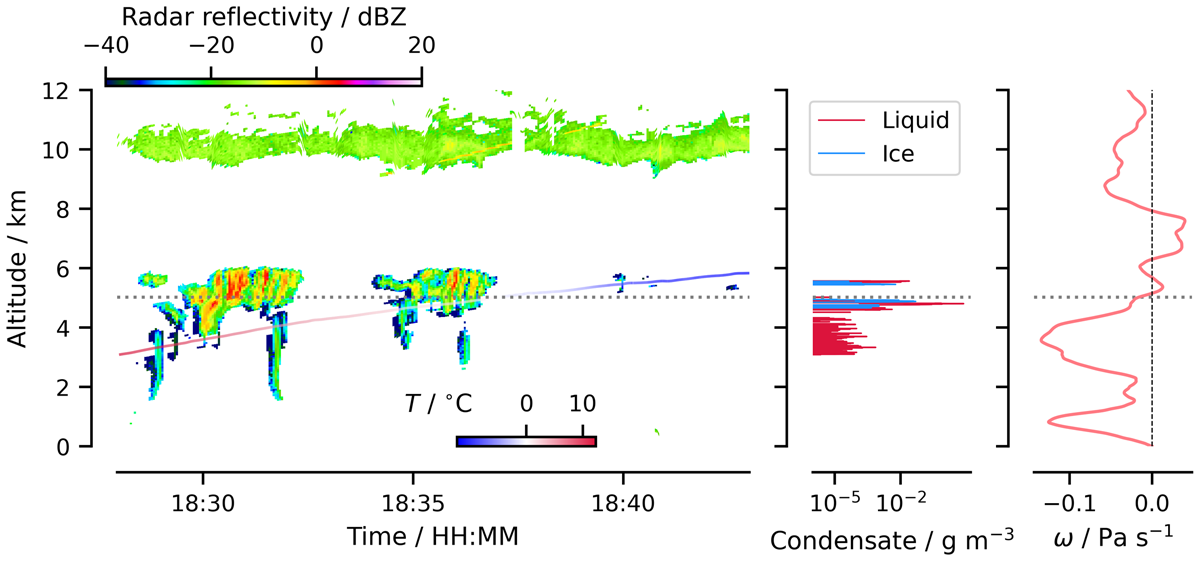
Figure 11
Cloud profiles from RASTA measurements and in situ probes during a spiral ascent of the ATR-42 on 09-03. Vertical motion (right panel) from dropsonde measurements executed by HALO flying a circle overhead.
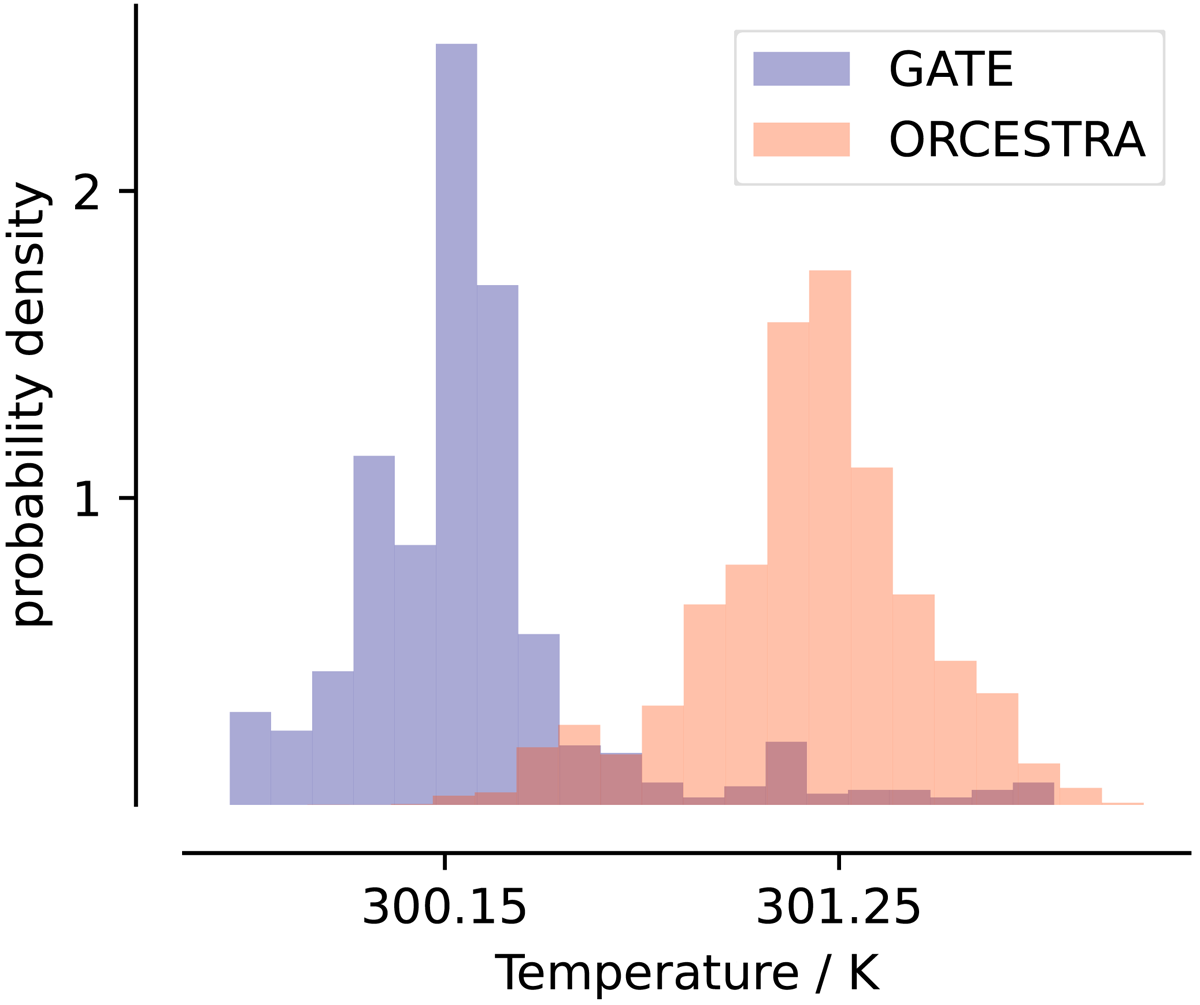
Figure 12
Sea-water temperatures in the GATE-A array as measured by the R/V Meteor thermosalinograph during ORCESTRA between 2024-08-17 and 2024-09-01 and as also archived from R/V Meteor measurements (using a towed buoy with thermistor measurements at 10 cm depth) during GATE between 1974-08-10 and 1974-09-21). Tick marks on x-axis denote median of each distribution.
Table A.1
Overview of servers distributing data from ORCESTRA platforms or sub-campaigns.