
1 Prelude
Amid the harmony underpinning scientific understanding of Earth’s changing climate lingers a dissonant ignorance of tropical deep convection. It was, after all, tropical disturbances that researchers long ago felt compelled to better understand as they first set out to build models of, and theorize about, the atmosphere’s general circulation and the predictability of weather systems (Mason, 1975). Yet today, more than a half century later, a poor understanding of tropical deep convection continues to bedevil efforts to work out the details of climate change (Bony et al., 2015; Shaw & Stevens, 2025).
At the heart of the problem is the range of length and space scales encompassed by tropical convection. A snapshot of the state of the atmosphere over the tropical North Atlantic (Figure 1) helps illustrate the problem. Clouds are colored by the temperature of their tops, which measures their height. Tops reaching above about 12 km are colored white. Usually associated with precipitating deep convection, they can be identified here as small (10 km) sprinkles across a veil of gray, or themselves as large-scale (1000 km) veils and, upon closer inspection, many things in between. For the most part, the largest clusters rise abruptly out of fields of shallow clouds (in blue and green) to their north, and step their way down gradually to the south and west, first through sheets of high (gray) and then mid-level (orange pink) clouds. Apart from the zonally (east-west) extended envelope of features constituting this day’s manifestation of the inter-tropical convergence zone (ITCZ), it is hard to identify a particular scale or structure in the image. Animated, this snapshot becomes the symphony that we struggle to interpret and understand.
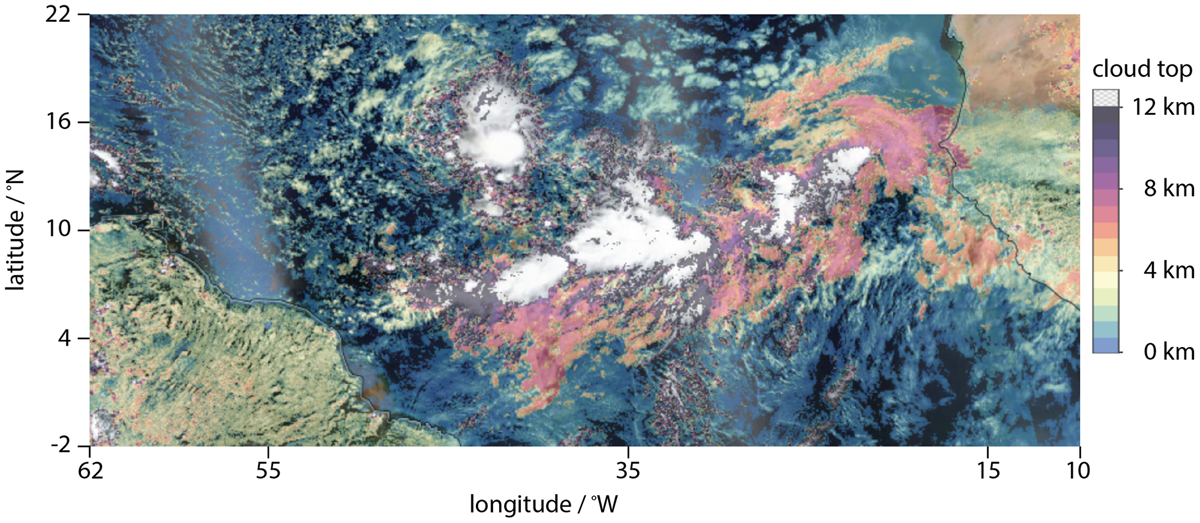
Figure 1
False color VIIRS image from the Suomi satellite showing the tropical Atlantic (62 to 10°W, –2 to 22°N) on 3 September 2024. Cloud-top height with the ainbow4 color-scale (blue-green-yellow-orange-pink-purple-gray) overlain with transparency on visible image, resulting in high clouds-tops (above about 12 km) appearing white.
Already at the time of GATE (Global Atmosphere Research Programme, or GARP, Atlantic Tropical Experiment; Kuettner, 1974) the many scales of tropical deep convection were well appreciated, incorporated into the planning, and verified by the measurements. Since that time, research has helped categorize and describe the types of convective systems found at different scales (Liu et al., 2007; Nesbitt et al., 2006; Takayabu et al., 2010; Yokoyama & Takayabu, 2012). However, understanding of how they come together to form the whole, and what function it serves, remains fuzzy. Some of the movements and motifs that structure our thoughts are sketched in Figure 2. The interaction of cold pools (Heever et al., 2025) highlighted in the upper left is thought to be important for convective (20 km) scale dynamics. Mesoscale convective systems, often in the form of squall lines (Houze, 2004) and which themselves encompass cooperative interactions with cold pools or density currents on much larger scales, are associated with much of the rainfall and are highlighted in the lower center. As possible progenitors of mesoscale convective systems, or even tropical cyclones, much larger scale cloud clusters—thought to form through feedback processes leading to convective self-aggregation (Muller et al., 2022; Wing et al., 2017)—are evident. The counterpoint of clustering convection is clusters of convective absence, as found in the doldrums, which are of interest for their possible contribution to the structure of the inner ITCZ (Windmiller, 2024). On yet larger scales, the role of convergence demanded by low-level force-balances might explain the breadth of the ITCZ, and its frequent edge intensification (Praturi & Stevens, 2025; Windmiller & Stevens, 2024). Embedded within each of these motifs are familiar refrains. For instance, the scale growth of thermals within the boundary layer has been hypothesized to be a precursor of different forms of convective organization (Bony et al., 2025). This begs the question as to how a view of upscale growth is reconciled with the idea of large-scale control. To extend the music analogy we can ask: What is the role of the bass tones of African Easterly waves? of the ocean in setting the timbre of air–sea interaction? of rhythms from nearby continents whose dust dances with water vapor, clouds, and rain (Gutleben et al., 2019); and to what extent is the key of the symphony set on yet larger scales, through planetary scale gradients of heating (Kang et al., 2009; Schneider et al., 2014) or tropics-wide intraseasonal oscillations (Bao et al., 2025).
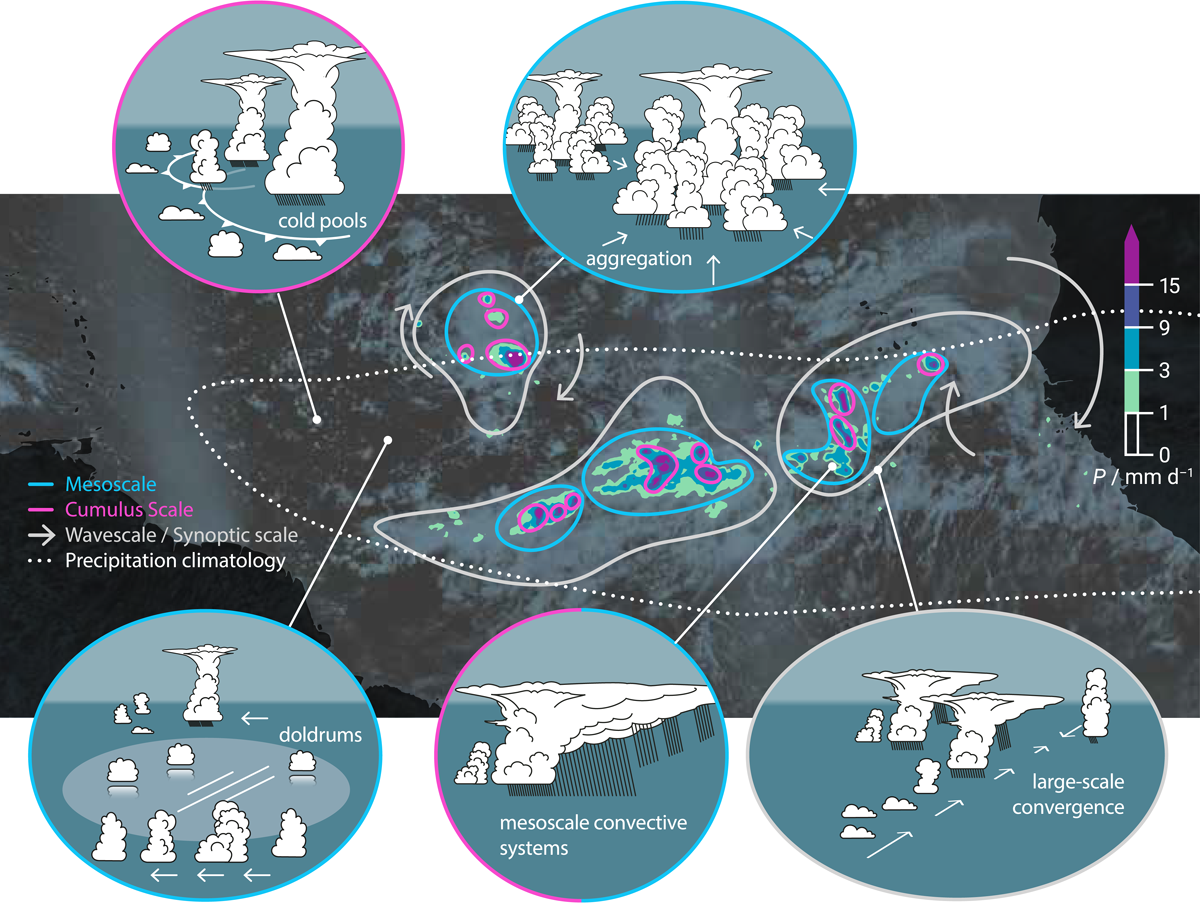
Figure 2
Conceptualizing the multi-scale interactions of clouds and precipitation. Features highlighted, clockwise from upper-left, are interacting cold pools initiating new convection, convective aggregation, edge intensified precipitation associated with the convergence and confluence of boundary layer winds, squall lines in regions of deep convective clusters, and doldrums within the inner ITCZ.
The plethora of possibilities provides different narratives competing to resolve the dissonance of this symphony. These possibilities span space-scales (from hundreds of meters to thousands of kilometers) and time-scales (from minutes to weeks), making them difficult to capture and test observationally—difficulties that the remoteness and scale of the tropical atmosphere, the challenge of working in a maritime environment, and the need to also adequately sample the upper ocean, all compound. While satellites can provide an overview and (thanks to improved spatio-temporal resolution and an increasing use of active sensors) new more advanced satellites can provide a better overview, an ability to immerse measurement systems in the cacophony of the tropical atmosphere remains necessary to sample what satellites don’t measure, and to better understand what they do measure. As such, and in contrast to the usual, more hypothesis-driven approach to field studies, (e.g., Stevens et al., 2021; Stone et al., 2025; Yoneyama et al., 2013) ORCESTRA was not formed to explore a particular movement or motif in the form of a singular hypothesis. Instead, it was designed to combine varied interests, instruments, and questions to create an auditorium for a summer of studies of tropical deep convection and its interaction with the ocean below, across a range of space and time-scales.
ORCESTRA thus harmonizes eight more specifically focused elements, or sub-campaigns. Each of these was named in the spirit of a real orchestra, as a component contributing to a collective effort to interpret nature’s composition, as, for instance, rendered in Figure 1. In this paper, we introduce ORCESTRA, and describe in more detail the composition it was designed to interpret. We do so by orienting readers around the overlap of the specific sub-campaigns that ORCESTRA integrated, and the conditions they shared. The individual goals and implementation of these sub-campaigns are left to papers by those that carried them forth, but here we add some high notes, in the form of surprises that were less part of the conception of the composition, but emerged through its rendering. The ORCESTRA website provides further documentation of the campaign, as well as access to data and software from the campaign.
2 Conception
ORCESTRA was structured by three new technologies: a quantified capability of measuring mesoscale vertical motion using dropsondes (Bony & Stevens, 2019; George et al., 2021) and (in the absence of clouds) satellites (Poujol & Bony, 2024); satellite active remote sensing through coordination with EarthCARE (Wehr et al., 2023); and the computational capacity to perform km-scale global (Hohenegger et al., 2023) and hm-scale campaign-spanning regional (Schulz & Stevens, 2023) simulations. These structured ORCESTRA, through the capabilities they provided and the new questions they posed. Specific examples of the latter include the question of how convection behaves as near-surface winds slacken in km-scale simulations (Segura et al., 2025), and how Doppler velocities are measured by EarthCARE and what this implies for cloud microphysical processes. The measurement capabilities, combined with extensive operational measurements allowed ORCESTRA to comprehensively characterize the tropical atmosphere and upper ocean using far fewer platforms than would have been required in the past.
The ORCESTRA platforms are shown in Figure 3. They comprised the latest and most advanced Earth Explorer Satellite (EarthCARE; Wehr et al., 2023); the High-Altitude Long-range (HALO) research aircraft (Stevens et al., 2019); the SAFIRE ATR-42 (Bony et al., 2022); the INCAS King Air; the R/V Meteor (Klocke et al., 2026), a global-ocean class research vessel; and two advanced ground stations on either side of the Atlantic: one in Mindelo on the island of Saõ Vincente in Cape Verde (complemented by a sounding station on the island of Sal during the campaign), the other on a windward promontory on Barbados’s eastern shore (Stevens et al., 2016). Many of the platforms operated advanced remote sensing instrumentation, with doppler radars operating in the Ka, W, and C bands and advanced lidar systems (using either Raman and DIAL techniques with high spectral resolution to measure composition) on the ATR-42, HALO, R/V Meteor, at BCO and Mindelo, and aboard EarthCARE. It might seem unusual to claim a satellite as a contribution to a field campaign, but in the case of EarthCARE this is justified not just by the degree to which the planes and ships coordinated their measurements around its overpasses, but also because a special effort, including the securing of a separate launch vehicle, was made to get it to space and make it ready for correlative and complementary observations in time for the campaign.
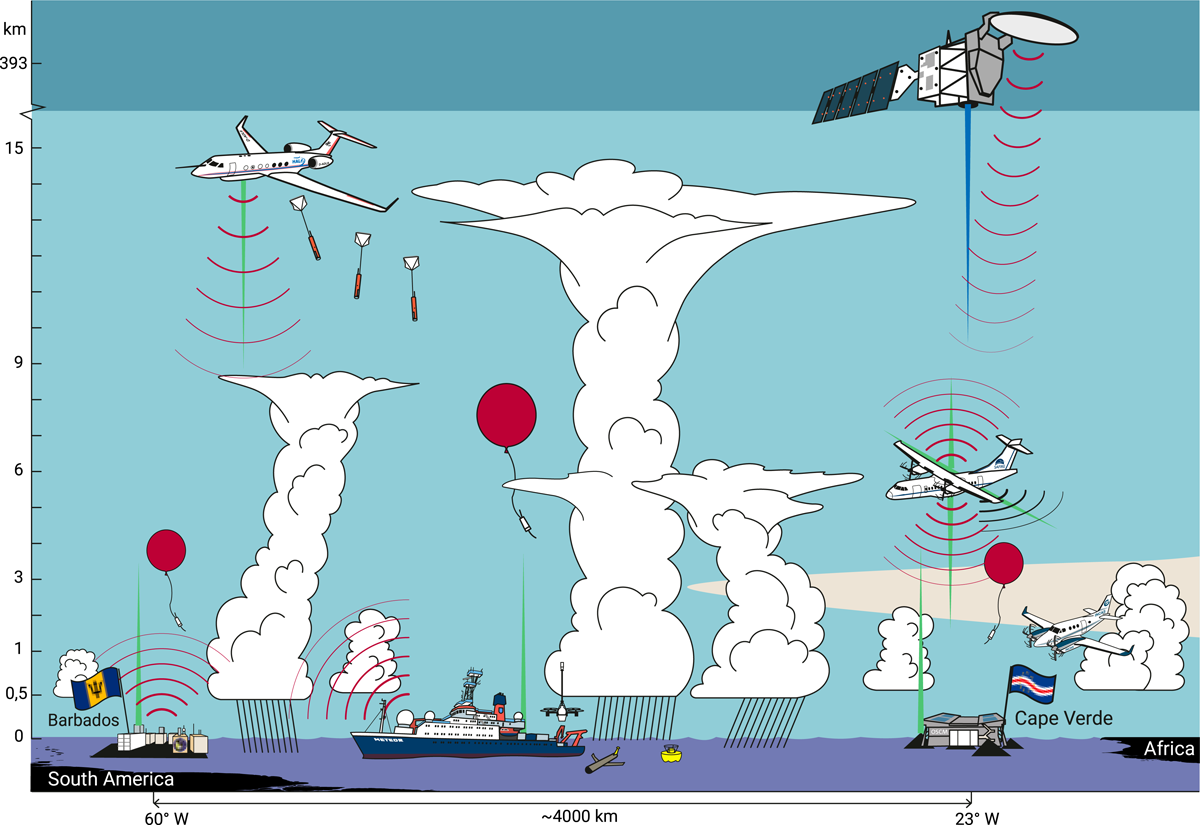
Figure 3
Different components and platforms: Research aircraft (HALO, ATR, King Air), R/V Meteor, gliders, highlighting the use of active remote sensing by radar and lidar and deployment of sondes. Measurements stretch across the Atlantic through the ITCZ, covering dust and its interaction with more organized convection in the East and Central Atlantic to regions of low winds and isolated convective towers in the West Atlantic.
2.1 The Ensemble
The eight sub-campaigns that ORCESTRA harmonized are identified by their logos in Figure 4 and sketched as follows:
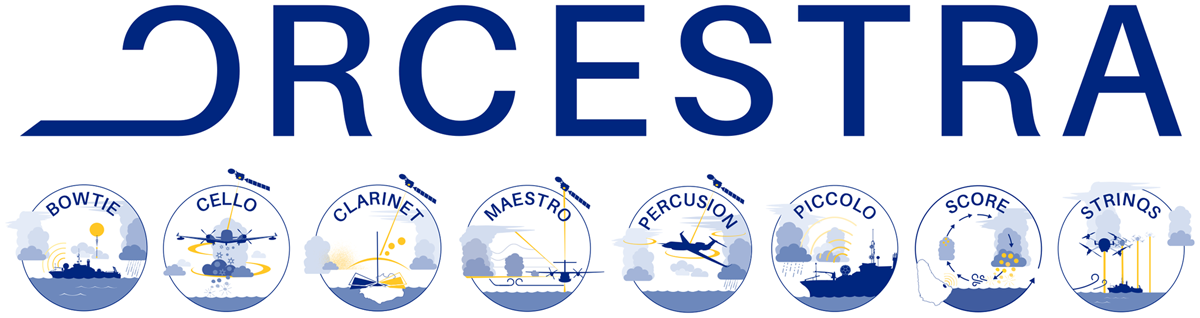
Figure 4
ORCESTRA and sub-campaign logos.
BOWTIE
The Beobachtung von Ozean und Wolken – Das Trans ITCZ Experiment1 supported measurements by the Research Vessel Meteor (Klocke et al., 2026). During its 40-day cruise across the tropical Atlantic, from Cape Verde to Barbados, the R/V Meteor made measurements at and below the ocean’s surface and profiled the atmosphere with radiosondes and a wide variety of remote sensing equipment, including a water-vapor Raman lidar, wind lidars, a staring W-band radar and a scanning C-band radar (SEA-POL; Rutledge et al., 2019) provided as part of PICCOLO. Drone profiling of the lower troposphere was conducted as part of STRINQS.
CELLO
Cloud and EarthCARE caL/vaL Observations was primarily concerned with validating EarthCARE retrievals. It was a Norwegian initiative that performed measurements using the Romanian INCAS King Air flying out of Praia in Cape Verde to make in situ measurements of atmospheric aerosol, clouds, and precipitation, under the EarthCARE orbit as well as above the CLARINET observations, in coordination with other aircraft.
CLARINET
The CLoud and Aerosol Remote sensing for EarThcare campaign provided ground-based remote sensing for EarthCARE validation and comparison to airborne measurements from the Ocean Science Center in Mindelo on Cape Verde. Among other things, it operated a 15-channel multi-wavelength Raman polarization lidar of type PollyXT and two cloud profiling radars operating at 35 GHz and 94 GHz.
MAESTRO
The Mesoscale organization of tropical convection refers to the campaign component of a larger French project by the same name. It deployed the French research aircraft SAFIRE ATR-42 to test hypothesized processes influencing the mesoscale organization of tropical convection. The ATR-42 was equipped with multiple lidars and radars, including a water vapor Raman system, staring upward, downward, sidewards and diagonally up and down, plus an ensemble of probes and sensors for in-situ measurements of turbulence and microphysics. MAESTRO coordinated GNSS (Global Navigation Satellite Systems) and radiosounding measurements with the Instituto Nacional de Meteorologia e Geofisica (INMG) from its base of operations on the island of Sal (Cape Verde). About half of the ATR flights were flown out of Sal in coordination with EarthCARE (for calibration and validation) or with SAR on board Sentinel-1 or RCM.
PERCUSION
Persistent EarthCare Underflight Studies of the ITCZ and Organized convection was based on the use of the HALO aircraft flying in and across the ITCZ. In addition to flight-level in situ measurements of thermodynamic quantities and gust-probe wind measurements HALO deployed a suite of passive and active remote sensing, including a 35 GHz and high-spectral resolution water vapor DIAL lidar. HALO made use of circular flight patterns with extensive deployments of dropsondes to measure the mesoscale vertical velocity. HALO flew out of SAL in the eastern tropical Atlantic during the first half of ORCESTRA, and out of Barbados in the western tropical Atlantic during the second half of the campaign. It also coordinated the radiosonde measurements from the Barbados Cloud Observatory with SCORE. In addition to its scientific objectives, PERCUSION focused on a comprehensive and holistic validation of EarthCARE (Groß et al., 2026).
PICCOLO
THe Process Investigation of Clouds and Convective Organization over the AtLantic Ocean was a US-led project that deployed the Colorado State University Sea-Going Polarimetric Radar (SEA-POL; Rutledge et al., 2019) aboard the R/V Meteor to investigate the nature, governing mechanisms, and impact of mesoscale organization of precipitating deep convection in the context of the Atlantic ITCZ. Together with BOWTIE, it also coordinated the radio-soundings from the R/V Meteor.
SCORE
The Sub-Cloud Observations of Rain Evaporation focused on assessing the robustness of new techniques to retrieve rain evaporation and downdraft profiles from shallow cumulus, and together with PERCUSION coordinated intensive measurements at the Barbados Cloud Observatory and sounding launches. As part of the ORCESTRA continuation, it is also installing horizontally scanning X-band radars on Barbados.
STRINQS
Soundings and TuRbulent eddy measurements in the ITCZ with a Network of QuadcopterS) was a Dutch initiative that coordinated measurements of four meteorological drones flying from the R/V Meteor. The drones were capable of coordinated flights and had an unusually high ceiling of 6 km. STRINQS was interested in characterizing the mesoscale structure of the ITCZ and the role of boundary-layer processes in organizing its structure.
2.2 Harmoninizing the ensemble
From the beginning, and with the goal of making the varied efforts understandable and accessible, the ORCESTRA sub-campaigns harmonized not just their execution and branding, but also their data policies, dissemination (e.g., through a common data server and website), and outreach activities. The website and associated repository were also used to open share supplementary tools, such as access to satellite data, numerical simulations, and scripts for all aspects of campaign preparation and subsequent analysis.
The basic strategy in the coordination of these sub-campaigns was to use measurement complementarity and overlap to more deeply span a wider variety of conditions. For instance, the R/V Meteor as part of BOWTIE and HALO as part of PERCUSION linked the measurements from the islands on both sides of the Atlantic, and MAESTRO supported additional dropsondes that HALO launched in circles coordinated with flights of the ATR-42. Depending on the campaign, either a fixed, and hence scene-independent, schedule of sampling was performed to provide unbiased statistics, or measurements targeted particular situations to test specific ideas (e.g., as part of MAESTRO), or to provide desired calibration data for EarthCARE (e.g., CELLO flights).
Among the sub-campaigns, BOWTIE, MAESTRO, and PERCUSION took responsibility for most of the central and common infrastructure. Coordination and weather briefings were organized by MAESTRO and PERCUSION. PERCUSION and BOWTIE organized an IPFS (Interplanetary File System) delivery of data through a simple browser serving content IDs. The AERIS Archive, sponsored by MAESTRO, supported data storage and distribution using more traditional methods. The ORCESTRA website, which continues as a collaborative platform and provides extensive documentation of the campaign (including operational reports) was developed by investigators affiliated with BOWTIE and PERCUSION, while a web-based operational center for visualizing weather forecasts, monitoring conditions, and a storm tracking facility (TOOCAN) was organized by investigators affiliated with MAESTRO. Outreach activities were also organized on Sal, with the organization of a workshop and exchanges with local stakeholders, tours of measurement facilities, training of students from the West African Science Centre on Climate Change and Adapted Land Use (WASCAL) Program, and activities with biodiversity protection associations. Likewise, on Barbados, site visits, as well as seminars and training activities for local scientists and students, were organized. Scientists from ANACIM (Dakar) and CIMH (Barbados) participated in the weather briefings, and are continuing to be supported to work with ORCESTRA data. Not counting the consortium of nations supporting ESA and EarthCARE, ORCESTRA bundled support and infrastructure from nine countries/international entities—Barbados, Cape Verde, France, Germany, the Netherlands, Norway, Romania, the United States, and the European Union—and hundreds of investigators. It was endorsed by the Global Energy and Water Experiment (GEWEX) and the World Climate Research Programme (WCRP).
3 Rendering
ORCESTRA’s rendering is illustrated by Figure 5. It shows the tracks of the different platforms during the 10 August through 30 September observational period, overlain on precipitation from the IMERG v07 final run satellite product (Huffman et al., 2023) for September 3. Platform tracks are also highlighted for this day for each platform, and for one other day (20 August for the ATR-42 and the King Air, and 23 September for HALO and the R/V Meteor). This illustrates the sampling strategy followed by the totality of (partially transparent) tracks, and how it sampled the breadth of the tropical Atlantic on a raster drawn by the daytime (descending) overpasses of EarthCARE. The measurements also define three domains as indicated by the figure and as summarized in Table 1. As the table indicates, not all platforms operated for the duration of the campaign, nor across all domains.
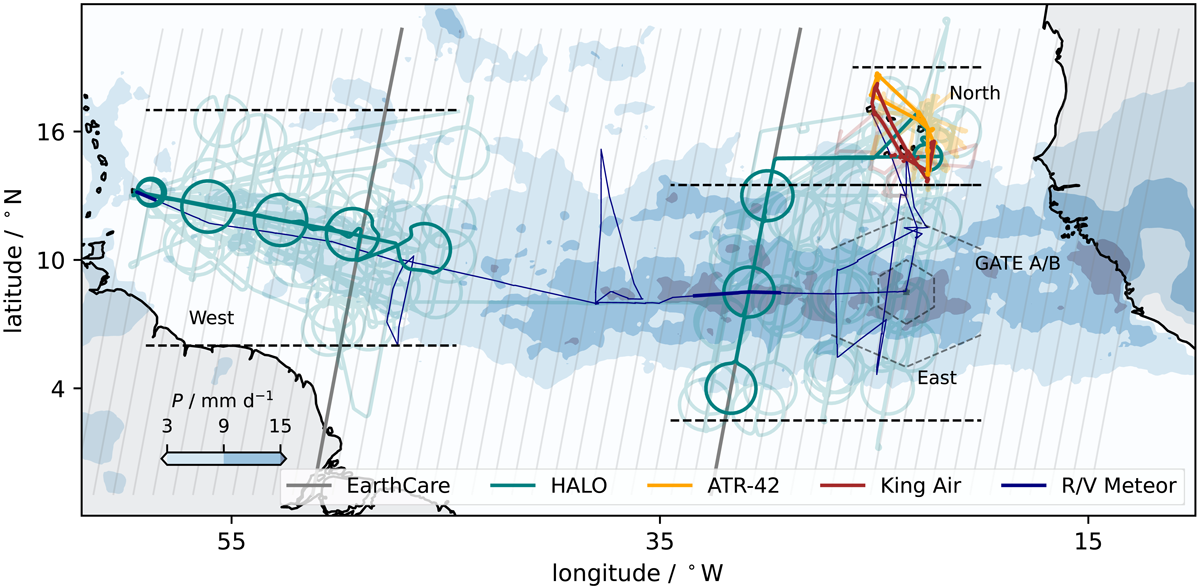
Figure 5
Data coverage following platform tracks. The tracks for the respective platforms differentiated by color, with transparency. For each platform, two days are plotted without transparency to help illustrate inter-platform coordination. The tracks for all platforms are shown for 09-03, coordination between the ATR-42, the KingAir and the Mindelo Ocean Science Center is highlighted for 08-20, while coordination between the R/V Meteor, HALO, and the BCO is highlighted for 09-23. Three sub-domains—ORCESTRA East, West, and North—are further delineated. The area of GATE Phase II and III measurements is shown for historical reference (dashed lines and hexagons). Precipitation on 09-03 from IMERG is shown in the shading.
Table 1
Summary of operation period of varied platforms. Due to ascent and descent measurements, many radiosondes measured two profiles. EarthCARE start is referring to the date when all four instruments were set to Nominal mode.
| PLATFORM | START | END | COMMENT |
|---|---|---|---|
| BCO Radiosondes | 2024-09-07 | 2024-09-29 | 276 radiosonde profiles |
| INMG Radiosondes | 2024-08-09 | 2024-09-11 | 277 radiosonde profiles |
| EarthCARE | 2024-08-10 | Standby CPR (not operative) status on Aug 28, 30, and Sept 2, 3, 21, and 23 | |
| R/V Meteor | 2024-08-16 | 2024-09-24 | 635 radiosonde profiles |
| DLR HALO | 2024-08-11 | 2024-09-28 | 23 flights, 1115 dropsondes |
| INCAS King Air | 2024-08-15 | 2024-09-07 | 9 flights |
| SAFIRE ATR-42 | 2024-08-10 | 2024-09-10 | 24 flights |
To better elucidate the coordinated execution of the sub-campaigns, we discuss measurements associated with the highlighted tracks in Figure 5. On September 3, where all platforms are highlighted, the north-south-oriented line of circles in the East domain shows how in this region HALO mostly flew across the ITCZ, with its measurement region selected based on the requirement that the orbit of EarthCARE bisect the flight circles. This day also shows how measurements were coordinated with the R/V Meteor, which was tracking westward through the center circle and underneath EarthCARE on that day. SEA-POL’s volume scan covered the domain bounded by HALO’s flight circle (during which time R/V Meteor was positioned at the center of the circle). On this same flight, a smaller circle was flown by HALO in the northern domain in coordination with the ATR-42 and King Air measurements. Whereas HALO tended to fly at high altitude oriented along a line following an EarthCARE overpass in and across the region of the climatological precipitation maximum, the King Air and the ATR-42 flew in the lower and mid troposphere to better characterize boundary layer, cloud, and aerosol properties. For this, they usually executed long straight legs and spiral soundings. The ATR-42 and the King Air are also highlighted on the 20th of August, a day on which EarthCARE overflew the Ocean Science Center in Mindelo, leading to coordinated measurements between it, CLARINET, MAESTRO, and CELLO. Operations of the R/V Meteor and HALO are also highlighted on the 23rd of September to show a period of coordinated measurements with the BCO. These measurements also show how, over the western Atlantic, where the rain-band becomes less identifiable as such, and when air-space restricted the deployment of sondes from HALO, measurements were strung out in the East-West direction.
Integrative elements of ORCESTRA include the number of EarthCARE overpasses, further coordination among platforms, the sounding measurements spanning the entirety of the domain, and an accompanying program of numerical experiments. Snapshots showing the coordination, and some of the meteorological conditions encountered, are shown in Figure 6, with instances of direct platform overlap summarized in Table 2. Of the 23 research flights with HALO, 21 had coordinated overpasses with EarthCARE, and the two that did not (on 09-06 and 08-21) were due to rescheduling caused by unexpected aircraft maintenance issues. As part of MAESTRO, the ATR-42 had 11 flights with HALO dropping sondes along a circle centered on its transect, 6 coordinated under-flights of EarthCARE, 8 coordinated under-flights of SAR (on Sentinel-1 or RCM), 4 collocated flights with the King Air, and 2 flights above Mindelo. During CELLO, the King Air flew with EarthCARE for 7 flights, of which 5 were in coordination with the other aircraft. Additionally, the King Air flew over the R/V Meteor once and conducted spirals above Mindelo during three flights. PERCUSION and BOWTIE/PICCOLO coordinated on 10 days, which included 15 HALO measurement overpasses of the R/V Meteor (12 straight-and-level legs) and 10 HALO circles in which R/V Meteor was within the circle. EarthCARE passed over R/V Meteor 6 times (5 daytime, 1 nighttime), and passed nearby a 7th time. Across the campaign, radio and dropsonde data have been collated into two data sets. RAPSODI (Winkler et al., 2025) describes the radiosondes, and provides data from 624 sondes for which there are 1196 profiles, as most of the radiosondes also provided data during their descent. BEACH (Gloeckner et al., 2025) describes the dropsonde data, which consisted of 1115 dropsondes, most dropped during the 89 flown circles. Finally, to better link the measurements to the new technologies of next-generation climate models, two-day numerical simulations using ICON were initialized daily from the European Center Analyses for the entire ORCESTRA period. As described by Fiévet et al. (2026, in preparation), each initially used a grid spacing of 1.25 km on a domain spanning the entire region shown in Figure 3.
Table 2
Summary of coordinated activities among platforms. The period where coordination is possible is evident by the range of marked columns, and when platforms were co-located the cell is indicated by an ✗. Note that HALO coordinated with two separate ATR flights on 08-22.
| Cabo Verde | Barbados | |||||||||||||||||||||||||||||||||||||||||||||||||||
|---|---|---|---|---|---|---|---|---|---|---|---|---|---|---|---|---|---|---|---|---|---|---|---|---|---|---|---|---|---|---|---|---|---|---|---|---|---|---|---|---|---|---|---|---|---|---|---|---|---|---|---|---|
| August | September | |||||||||||||||||||||||||||||||||||||||||||||||||||
| # | Co-location | 10 | 15 | 20 | 25 | 30 | 5 | 11 | 15 | 20 | 25 | 29 | ||||||||||||||||||||||||||||||||||||||||
| Airborne | ||||||||||||||||||||||||||||||||||||||||||||||||||||
| 10 | HALO + ATR-42 | ✗ | ✗ | ✗ | ✗ | ✗ | ✗ | ✗ | ✗ | ✗ | ✗ | ✗ | ||||||||||||||||||||||||||||||||||||||||
| 4 | HALO + King Air | ✗ | ✗ | ✗ | ✗ | |||||||||||||||||||||||||||||||||||||||||||||||
| 4 | ATR-42 + King Air | ✗ | ✗ | ✗ | ✗ | |||||||||||||||||||||||||||||||||||||||||||||||
| R/V Meteor | ||||||||||||||||||||||||||||||||||||||||||||||||||||
| 10 | HALO | ✗ | ✗ | ✗ | ✗ | ✗ | ✗ | ✗ | ✗ | ✗ | ✗ | |||||||||||||||||||||||||||||||||||||||||
| 1 | ATR-42 | ✗ | ||||||||||||||||||||||||||||||||||||||||||||||||||
| 1 | King Air | ✗ | ||||||||||||||||||||||||||||||||||||||||||||||||||
| Mindelo | ||||||||||||||||||||||||||||||||||||||||||||||||||||
| 4 | HALO | ✗ | ✗ | ✗ | ✗ | ✗ | ||||||||||||||||||||||||||||||||||||||||||||||
| 1 | ATR-42 | ✗ | ||||||||||||||||||||||||||||||||||||||||||||||||||
| 3 | King Air | ✗ | ✗ | ✗ | ||||||||||||||||||||||||||||||||||||||||||||||||
| BCO | ||||||||||||||||||||||||||||||||||||||||||||||||||||
| 1 | HALO | ✗ | ||||||||||||||||||||||||||||||||||||||||||||||||||
| 1 | R/V Meteor | ✗ | ✗ | ✗ | ||||||||||||||||||||||||||||||||||||||||||||||||
| EarthCARE | ||||||||||||||||||||||||||||||||||||||||||||||||||||
| 21 | HALO | ✗ | ✗ | ✗ | ✗ | ✗ | ✗ | ✗ | ✗ | ✗ | ✗ | ✗ | ✗ | ✗ | ✗ | ✗ | ✗ | ✗ | ✗ | ✗ | ✗ | ✗ | ||||||||||||||||||||||||||||||
| 6 | ATR-42 | ✗ | ✗ | ✗ | ✗ | ✗ | ✗ | |||||||||||||||||||||||||||||||||||||||||||||
| 6 | King Air | ✗ | ✗ | ✗ | ✗ | ✗ | ✗ | |||||||||||||||||||||||||||||||||||||||||||||
| 6 | R/V Meteor | ✗ | ✗ | ✗ | ✗ | ✗ | ||||||||||||||||||||||||||||||||||||||||||||||
| - | Mindelo | |||||||||||||||||||||||||||||||||||||||||||||||||||
| SAR | ||||||||||||||||||||||||||||||||||||||||||||||||||||
| 2 | ATR-42 + Sentinel 1 | ✗ | ✗ | |||||||||||||||||||||||||||||||||||||||||||||||||
| 6 | ATR-42 + RCM | ✗ | ✗ | ✗ | ✗ | ✗ | ✗ | |||||||||||||||||||||||||||||||||||||||||||||
| PACE | ||||||||||||||||||||||||||||||||||||||||||||||||||||
| 3 | HALO | ✗ | ✗ | ✗ | ||||||||||||||||||||||||||||||||||||||||||||||||
To prevent fragmentation, wherever possible, a more homogeneous and open access to datasets from across different sub-campaigns is being facilitated through the use of the interplanetary file system (IPFS). The idea is to make data access FUN (FAIR and Unstoppable) to support ORCESTRA’s data policy which
“encourages the free use and access to its data and relies on the integrity of the scientific community to ensure that this open data policy does not diminish the contributions of those who collected these data.”
More information about data access, which due to different platforms and policies of the national entities supporting them is heterogeneous, is provided in Appendix A.1.
4 Instantiation
The year 2024 stands out in many people’s minds as the warmest year on record and the first with global mean temperatures exceeding the 1.5 K guardrail, with much of the warming being found in the Atlantic (Terhaar et al., 2025). However, the intense warm period was mostly concentrated in the 12-month period preceding ORCESTRA. By the time of the campaign, tropical sea-surface temperatures had moderated, with warming relative to a trend-adjusted climatology mostly confined to the West and (to a lesser extent) North domains (Table 3). And while the season began with the earliest Category 5 Atlantic Hurricane ever on record, during the campaign there was a lull in tropical cyclone activity. Between August 20 and September 23, which includes the climatological peak in the season, only one tropical storm (Gordon) formed in the Atlantic. This lull was unexpected. One possible factor for its emergence was an apparent northward shift of Easterly wave activity in August, to an area where waters are relatively colder (Klotzbach et al., 2025), though the magnitude of this shift depends on the wave tracking method, and the importance of Easterly waves for cyclogenesis has been disputed (Patricola et al., 2018). Other factors, such as a suppressed phase of the Madden-Julian Oscillation, have been hypothesized to explain the September lull.
Table 3
Mean precipitation from IMERG for different ORCESTRA sub-domains during period of intensive measurement and August–September SST anomalies from the 1992–2011 mean from the Optimum Interpolation of Sea Surface Temperature (Banzon et al., 2020).
| COORDINATES | PERIOD | PRECIP / mm d–1 | Δ SST / K | ||||
|---|---|---|---|---|---|---|---|
| REGION | SW | NE | BEGIN | END | 2024 | CLIM. | |
| North | 26.0°W, 13.5°N | 20.0°W, 19.0°N | 10 Aug | 10 Sep | 0.6 | 1.6 | 0.69 |
| East | 34.5°W, 2.5°N | 20.0°W, 13.5°N | 10 Aug | 5 Sep | 9.1 | 8.7 | 0.05 |
| West | 59.0°W, 6.0°N | 44.5°W, 17.0°N | 5 Sep | 30 Sep | 2.9 | 3.6 | 0.17 |
During ORCESTRA, the rainfall within the Atlantic ITCZ was well above average. This is mostly concentrated in the East domain, where the 15 mm/d contour (isohyet), which in IMERG is climatologically confined to the coastal region, extends to 30°W (Figure 7). However the Central Atlantic, near where the climatological 9 mm/d isohyet locates, precipitation also extended further to the west and north of the climatology. Elevated amounts of precipitation in the East and Central Atlantic occurred despite a lack of tropical cyclones, which on average account for up to 30% of the annual precipitation in the region (Jones et al., 2021). In the West and North domains, however, a marked reduction in precipitation is observed. This was especially true for the North domain, where precipitation was half of its climatological average (Table 3). Satellite-derived estimates of precipitation anomalies were thus below average in the two regions where the sea-surface was anomalously warm, and above average where sea-surface temperatures tracked the tropical mean (Table 3), a behavior which is typical for the tropical Atlantic.
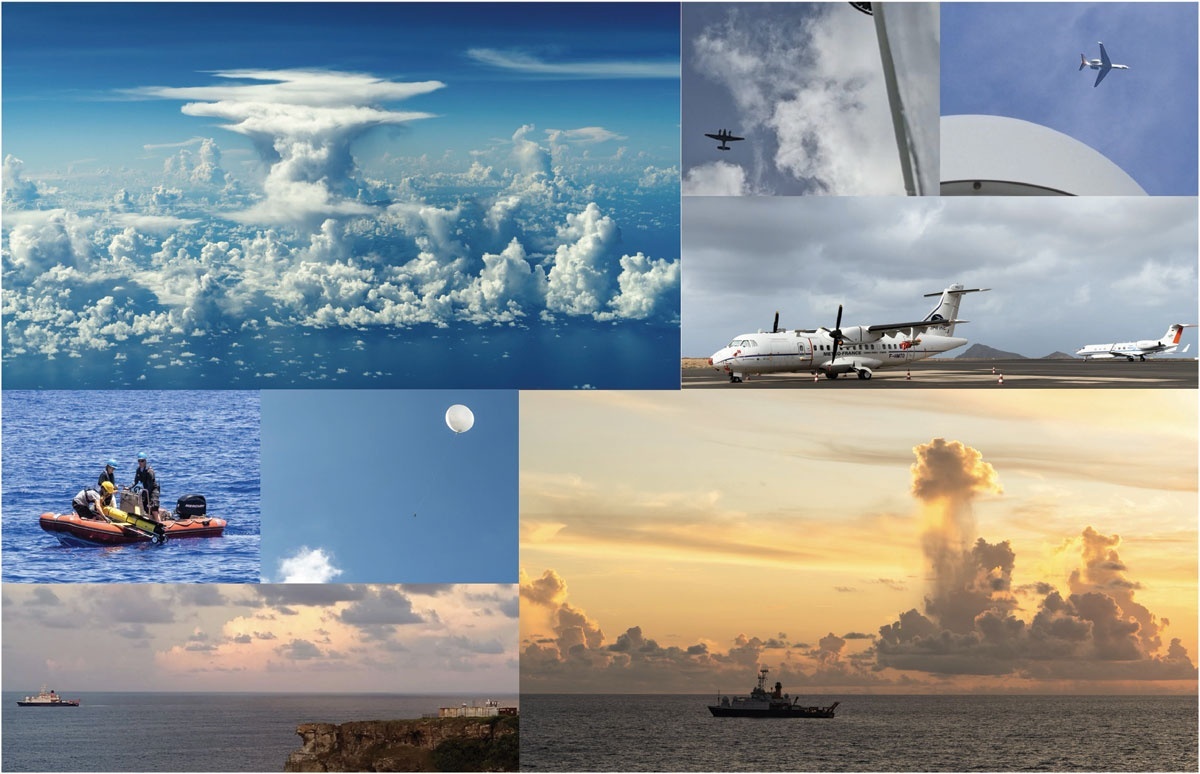
Figure 6
Coordination of instrument platforms during ORCESTRA. From upper left, a view of upright and isolated convection in a weak wind regime (note cloud reflection on surface) of the Western Atlantic taken from the flight deck of HALO. King Air and HALO overpasses of the R/V Meteor. The ATR-42 and HALO preparing for measurements on Sal. Retrieval of a glider from a Zodiac deployed from the R/V Meteor, one of many sounding ascents from the BCO, INMG, or the Meteor, coordinated measurements between the R/V Meteor and the BCO, and convection in the vicinity of the R/V Meteor as seen from the BCO. The contrasting fate of condensate is highlighted by the first and last images.
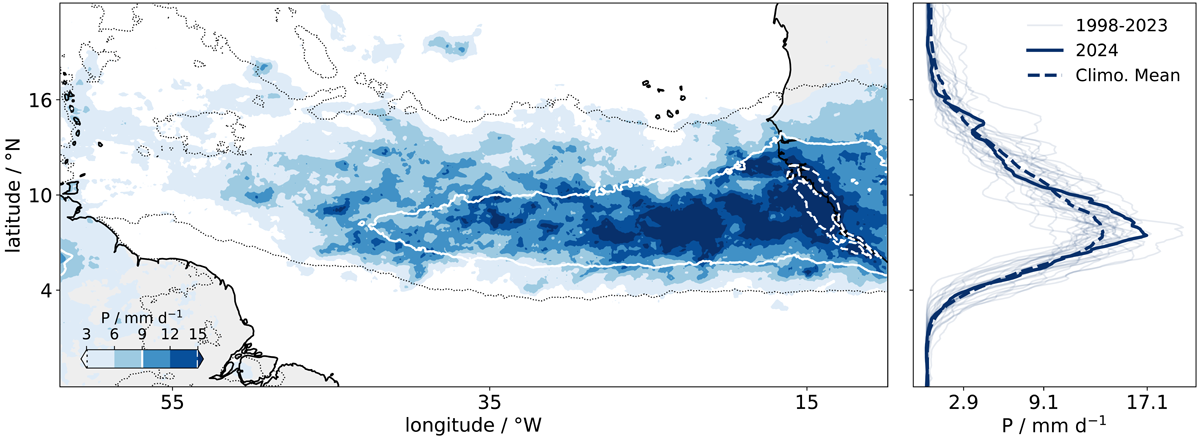
Figure 7
Mean precipitation for ORCESTRA period compared to climatology (white dashed line: 15 mm d-1, white solid line: 9 mm d-1, black dotted line: 3 mm d-1) averaged over the entire IMERG record. The right panel shows the zonal mean between 20 and 30° W. Tick mark labels on the ordinate axis denote the mean precipitation in the ORCESTRA West and East domains, and the latitudinal max, respectively.
Figure 8 shows the winds from the dropsondes and radiosondes compared to the climatology from the Advanced Scatterometer ASCAT. Compared to climatology, and consistent with the precipitation signal, 2024 had a more westward extended region of surface westerlies. Surface doldrums also extended across the Atlantic, somewhat north of their climatological position, following the westward extension of the westward wind regime. Although there are few reference points, the depth and strength of the low-level westerlies was more pronounced than expected. The low-level wind vectors from the radio- and drop-sondes show a considerable coherence in the wind-field, and the regions of measured westerly near-surface winds prevail within the region of mean westerlies as seen by satellite (Figure 8, solid contour). This gives a sense of the persistence of the wind regimes.
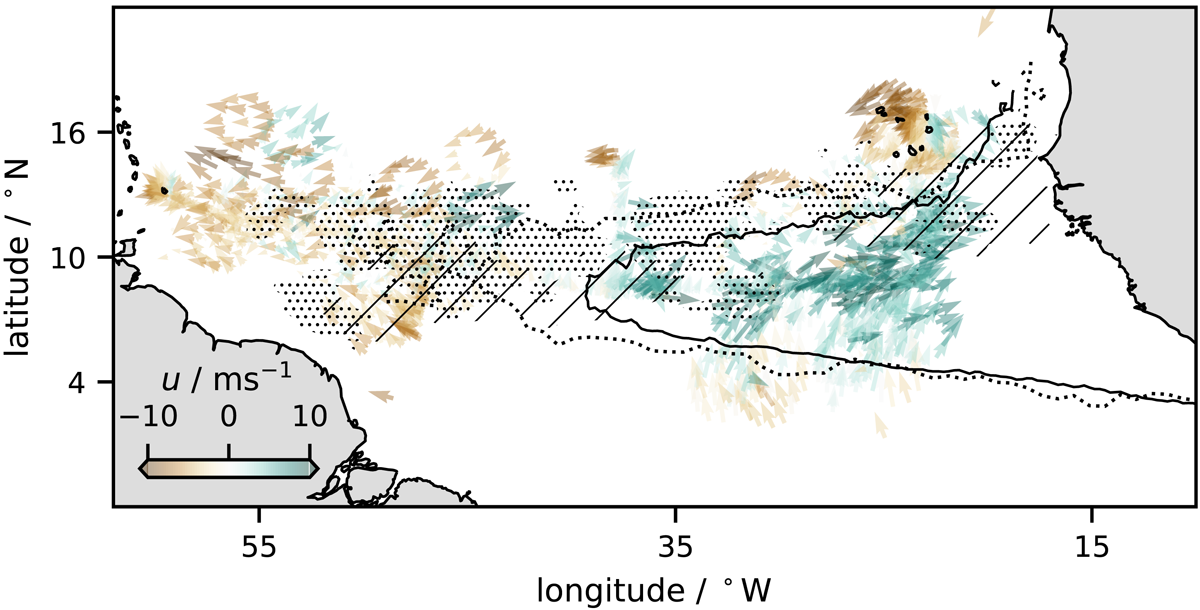
Figure 8
Near surface winds from ORCESTRA sondes, plotted as arrows colored by zonal wind (green denotes westerlies, brown easterlies). Contour delineates region of 2008–2024 westerlies (solid, black) and 2024 westerlies (dotted, black) by 0 ms-1 zonal wind contour. Doldrums shown as stippled (2024) and hatched as taken. Winds contours and stippling taken from ASCAT August–September 2008–2024 mean.
5 Some High Notes
ORCESTRA’s scientific high notes come from the juxtaposition of its contrasting movements—East versus West, warm versus cold, wet versus dry, in versus ex situ, now versus then. This possibility of contrast distinguishes ORCESTRA’s measurements from many others within the tropics.
The contrast between East and West is most pronounced in the structure of the lower troposphere. Figure 9 shows this to be evident irrespective of whether one looks at the thermodynamic (stability, relative humidity), kinematic (zonal wind) or material (aerosol extinction) properties of the atmosphere (see also Gloeckner et al., 2025; Klocke et al., 2026; Winkler et al., 2025, for analyses of individual datasets). The data document substantial vertical shear of the zonal wind in the East, with a surface bounded westerly jet. This is absent in the West where very light easterlies extend to the surface. Both relative humidity and stability are elevated near the 0°C isotherm everywhere, but more so in the East. East-West contrasts are also marked in the structure of convection, as exemplified by the radar imagery from the R/V Meteor during the aforementioned periods of coordinated measurements (Figure 10). As was the case on 3 September in the East, convection often took the form of organized squalls extending for a hundred kilometers with large areas of stratiform echoes and associated with much larger mean rain-rates (Figure 7), and strong upward motion. In the West, convection was more scattered and upright, as seen in the radar echos for 23 September (Figure 7). These features can also be identified in photos (upper left and lower right of Figure 6). More isolated and upright convection in the West was associated with less dynamical support, as in both the time-mean, and in this region on this day (23 Sept.), air descended in the mean – patterns reminiscent of what was found for GATE (Cheng & Houze, 1979).
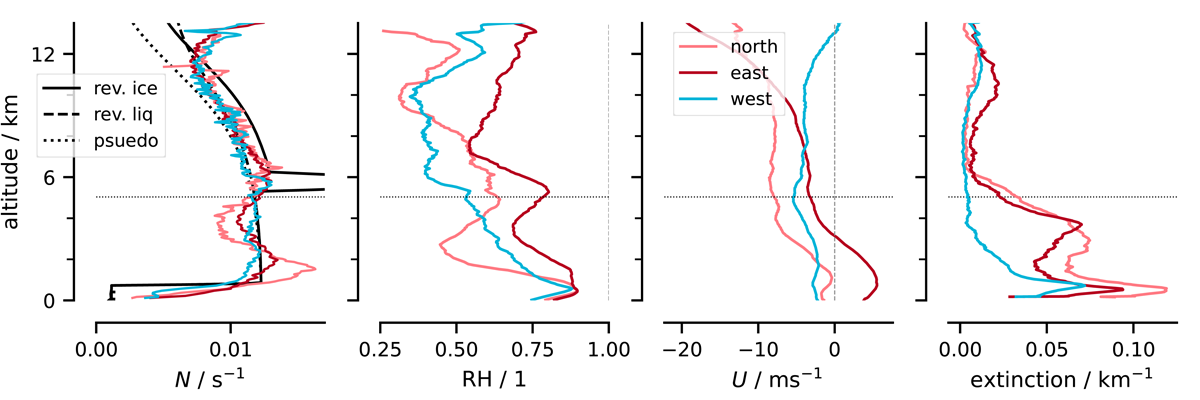
Figure 9
Profiles of static stability, relative humidity and zonal wind for the ORCESTRA domains from all soundings, and extinction from cloud-free scenes sampled by WALES. Shown with the static stability are the indicated adiabats. Estimates of standard error are not shown, but differences among profiles are robust to sampling.
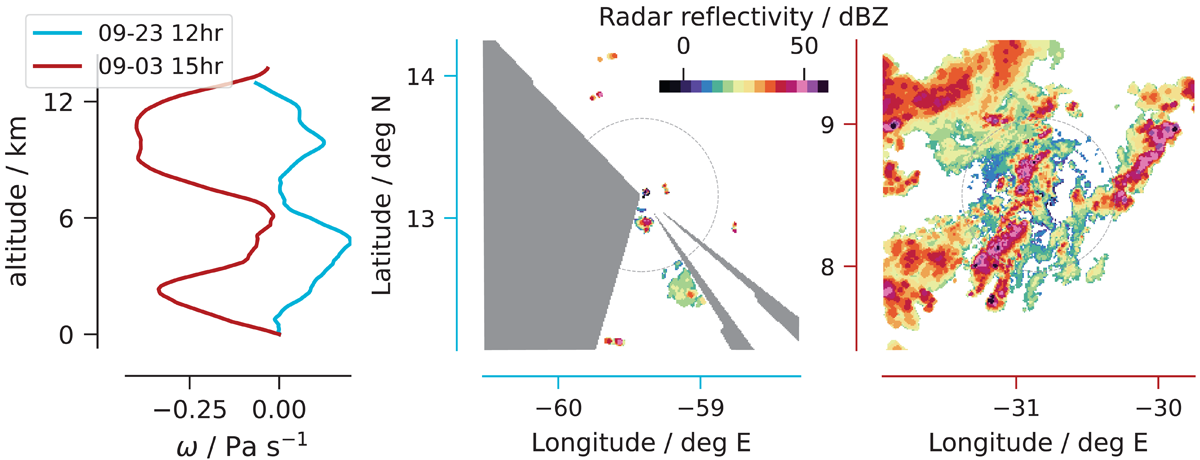
Figure 10
Maximum reflectivities from SEA-POL volume scans in the West, on 09-23 (middle panel) and in the East on 09-03 (right panel), with accompanying vertical motion from HALO dropsondes. For scale 60 km diameter circle is indicated by the dashed line. Blank regions for the radar in the West are due to obstructions from the ship and its masts; this was avoided for the image on the right through the circling of the ship.
The lack of contrast between extinction profiles in and out of the ITCZ, manifest here as differences between East and West, adds a high note that merits further attention. Despite the strength of convection and rainfall in the East, and the seemingly different origin of air masses, the aerosol extinction is quite similar to what was found in the North. Also surprising is how little vertical transport is apparent in the East. Extinction profiles do not extend as deeply through the lower troposphere as one might expect given the structure of relative humidity, and not at all past the zone of enhanced stability. This might be explained by a mixing of air masses in the analysis, i.e., if deep convection was more associated with westerlies, and shallow convection with easterly intrusions, with the former being more masked by high clouds.
In the cold, upper troposphere, the profiles from the three regions are more similar also in other quantities. There the static stability, as measured by the Brunt-Väisälä frequency, N, is indistinguishable across the regions and well described by a reversible (liquid) adiabat. Differences in vertical shear and the structure (if not the amount) of humidity in the West versus the East are small. Apart from the somewhat moister East, the similarity of the structure of the upper troposphere is at odds with differences in surface temperatures, the structure of the lower troposphere and the mean vertical motion, which the dropsondes show is on average upward in the East and downward in the West (Gloeckner et al., 2025). These contrasts emerge from the din of unsorted measurements and beg a closer investigation in light of theories of convective quasi-equilibrium (Xu & Emanuel, 1989).
ORCESTRA’s observations of mid-level clouds provided the visual equivalent of a long viola solo, whose forgotten tapestry is recalled from one’s memory as it is played anew. Johnson et al. (1999) emphasized the tri-modal nature of convection in measurements from TOGA-COARE, and reviewed a longer history of such observations. In their study, mid-level clouds were associated with cumulus congestus and deep convection preferentially detraining near the 0°C isotherm, but this versus other mechanisms, and their implication for how clouds influence the equilibrium climate sensitivity is far from settled (Spaulding-Astudillo & Mitchell, 2025; Stevens et al., 2017; Kluft et al., 2025). In ORCESTRA, mid-level clouds were also evident in great abundance, and across all domains. The measurements should be able to determine to what extent these form in situ, or are from cumulus congestus or deeper clouds. Using in situ cloud microphysical, temperature, and wind measurements from dropsondes, with upward and downward ex situ measurements from a cloud radar, Figure 11 shows evidence for both processes as observed during a spiral ascent of the ATR-42 on 3 September. Estimates of vertical velocity from divergence measurements by sondes dropped by HALO circling overhead suggest that these form in a layer of uplift just below the freezing level. The in situ ATR-42 measurements also document the presence of ice, and super-cooled liquid water, which combined with the remote sensing by HALO and EarthCARE should help clarify the role of microphysical processes in the life-cycle of these elusive clouds.
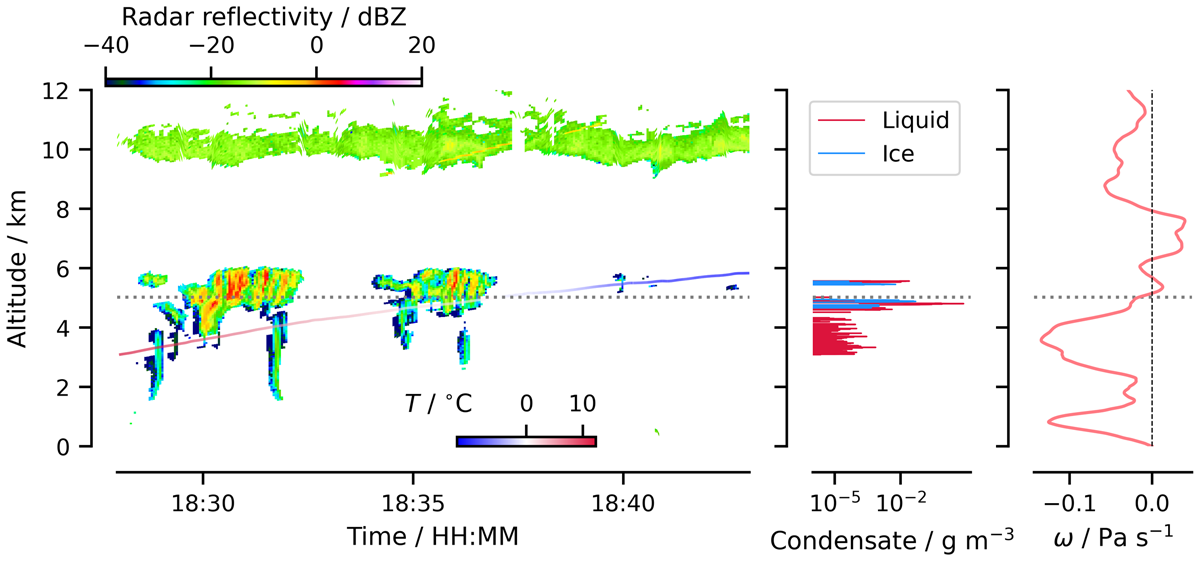
Figure 11
Cloud profiles from RASTA measurements and in situ probes during a spiral ascent of the ATR-42 on 09-03. Vertical motion (right panel) from dropsonde measurements executed by HALO flying a circle overhead.
As the discussion of the mid-level clouds reminds us, the more we explored ORCESTRA’s lofty notes, the more we were reminded of pioneering earlier work, particularly that associated with GATE. Like GATE back then, ORCESTRA now supported measurements across the entirety of the tropical Atlantic, but also chose a subdomain (ORCESTRA East), that subsumed the GATE A/B ship array, for intensive coordinated activities. While considerably more modest in scope, ORCESTRA used technologies that GATE helped pioneer (dropsondes, radar, and satellites) to sample the tropical atmosphere with a comparable intensity using far fewer resources. Like GATE, which introduced the then new technology of geostationary satellites, ORCESTRA introduced EarthCARE. And where GATE benefited from early applications of radar remote sensing, ORCESTRA benefited from the considerable maturation of this technology, including small wavelength systems whose enhanced sensitivity allows them to measure clouds, and with stabilization platforms to compensate for the pitch and heave of the ship, and in multiple directions. ORCESTRA also made extensive use of surface, airborne, and spaceborne lidar remote sensing, and as part of STRINQS, experimented with meteorological drones capable of measuring through the depth of the lower troposphere. GATE and ORCESTRA even mirrored each other in their preparation, BOMEX (Holland, 1970) in the winter trades as prelude for GATE, as was EUREC4A (Stevens et al., 2021) for ORCESTRA.
Many of the elements common between GATE and ORCESTRA follow naturally from the similarity of their objectives, which were to characterize the multi-scale nature of tropical convection. That said, whereas the experimentalists during GATE sought to incorporate these scales in their description, many theorists of that era worked with the premise that the intermediate (meso) scales of motion could be neglected. There is now increasing evidence for the importance of scale interactions in weather and climate (Bony et al., 2020; Kang et al., 2026; Yeager et al., 2023; Yoon & Hohenegger, 2025), and today it seems inconceivable that the tropics can be understood without accounting for the mesoscale instabilities (Emanuel et al., 2014; George et al., 2021; Janssens et al., 2023) that arise within them. By measuring interactions across scales to improve and inform our use of more powerful models, ORCESTRA allows theorists and experimentalists to work with the same score to understand how the melodies and motifs of deep convection determine the structure, strength, and stability of the tropical rainbands.
6 Envoi
As an international campaign conducted over the same waters, and in the same season as GATE, ORCESTRA’s score also enables us to reflect on changes that have occurred over the past 50 years. While this “now” and “then” have many similarities, the differences are poignant. Whereas GATE was conducted during a period when appreciation for the benefits of international cooperation in understanding and managing our planet was on the rise, ORCESTRA finds itself in a different situation. In this respect, it was also hard for ORCESTRA not to hear the Tristan Chord, a harbinger of modernity, in the atmosphere’s tropical symphony. Its sound was registered by most of the instruments, and is shown (Figure 12) by the near-surface temperature measurements by the R/V Meteor made as it steamed—then and now—through the same seas. Hopefully, its atonality gives impetus to efforts to use ORCESTRA’s many measurements, also in conjunction with those of GATE, to resolve the lingering dissonance of a still poor understanding of tropical convection and its role in climate and climate change.
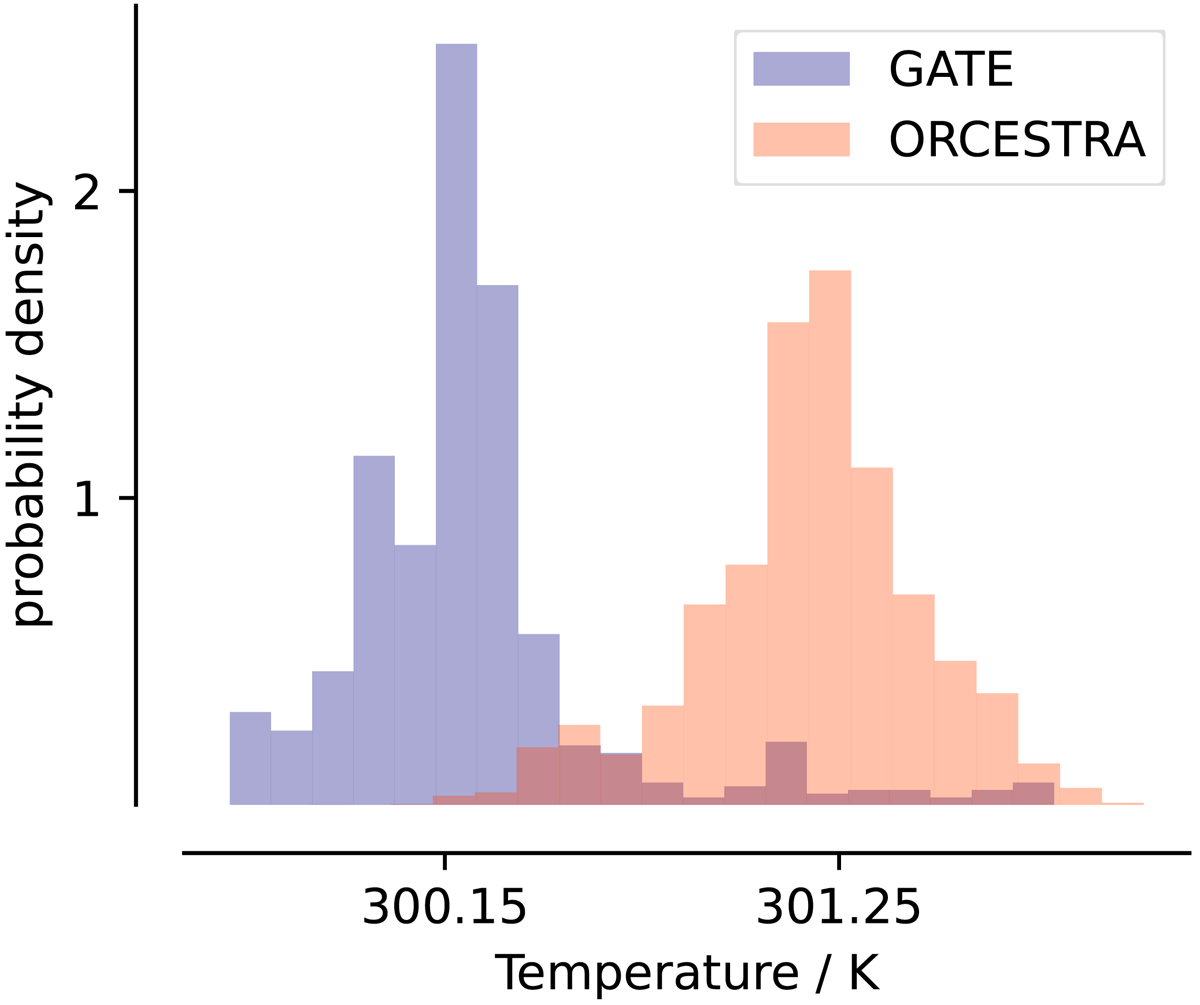
Figure 12
Sea-water temperatures in the GATE-A array as measured by the R/V Meteor thermosalinograph during ORCESTRA between 2024-08-17 and 2024-09-01 and as also archived from R/V Meteor measurements (using a towed buoy with thermistor measurements at 10 cm depth) during GATE between 1974-08-10 and 1974-09-21). Tick marks on x-axis denote median of each distribution.
Appendices
Appendix: Data Access
To provide a less idiosyncratic, more robust, and verifiable way to deliver content-addressable data, ORCESTRA has defined a living data concept that is maintained and updated on the ORCESTRA website. An outgrowth of this is the ORCESTRA Data Browser, which provides a low-threshold entry point to explore an ever-growing catalog of ORCESTRA data products available via the interplanetary file system (IPFS), along with information related to setting up and using IPFS to access these and other data. In addition to IPFS, the Interplanetary Naming System (IPNS) helps facilitate access to the latest version of evolving datasets. Through this, ORCESTRA strives to make data access FUN (FAIR and UNstoppable). The WALES data used in this paper are also available on Zenodo at Sal 10.5281/zenodo.15527242 and Barbados 10.5281/zenodo.17153148.
Table A.1
Overview of servers distributing data from ORCESTRA platforms or sub-campaigns.
| PLATFORM | URL |
|---|---|
| BCO | https://tcodata.mpimet.mpg.de/intro.html |
| BOWTIE | https://marine-data.de |
| EarthCARE | https://earth.esa.int/eogateway/missions/earthcare/data |
| MAESTRO | https://maestro.aeris-data.fr/catalog |
Because many platforms, or measurement groups, have their own policies and culture to provide open access to ORCESTRA data, not all data is distributed through IPFS. The distribution of datasets not served through IPFS will be described in sub-campaign overview papers as well as in data papers for individual data products. In the meantime, known data servers hosting data for specific sub-campaigns and platforms are also listed in Table A.1.
Notes
Acknowledgements
Michael Bell of Colorado State University came up with the name for the campaign, and produced the radar composite data from the circling ship in Figure 10. Tim Carlsen, Marcus Dengler, and James Ruppert are thanked for comments on an initial outline of this paper. Tobias Kölling and Lukas Kluft are thanked for their leadership in developing the FUN data concept. Helene Glöckner, Theresa Mieslinger, and Marius Winkler are thanked for comments and corrections to the draft manuscript. Giovanni Biagioli and Pierre Coutris are thanked for conceptualizing Figure 11, and for assistance in its drafting. Martin Wirth is thanked for help in processing the lidar data to provide extinction profiles. Yvonne Schrader of the Max Planck Institute for Meteorology drafted and co-designed the conceptual figures (Figures 2 and 3), Lydie Le Gal (École Polytechnique) drafted and co-designed the sub-campaign logos. Tristan Vostry is thanked for the photo documentation. We also wish to thank and acknowledge them and many individuals who contributed to ORCESTRA’s execution and whose contributions will become explicit in forthcoming papers describing ORCESTRA’s different sections and the data they collected. IMERG data (Huffman et al., 2023) is available from the NASA Goddard Earth Sciences (GES) Data and Information Services Center (DISC) at https://disc.gsfc.nasa.gov/datasets. We thank the editors, Kerry Emanuel, and an anonymous reviewer for their comments, which improved the presentation of our ideas. We also thank everyone’s support of Tellus’ attempt to swim against the tide of the commercial diminishment of scientific publishing.
Author Contributions
BS and AAW developed the outline of the paper and BS wrote the first draft. SB, BS, JMW, and AAW developed the scientific rationale for the campaign, and together with SG and DK were responsible for the scientific design. JvB, EB, ROD, DF, JD and JMW provided additional and essential technical coordination among sub-campaigns with YW being responsible for the overall coordination. All authors read the manuscript, and provided feedback and suggestions that improved the final draft. The figures were conceived by BS, JMW, and/or AAW, with input from SB, SG, DK, and YW and collaborators as acknowledged.