
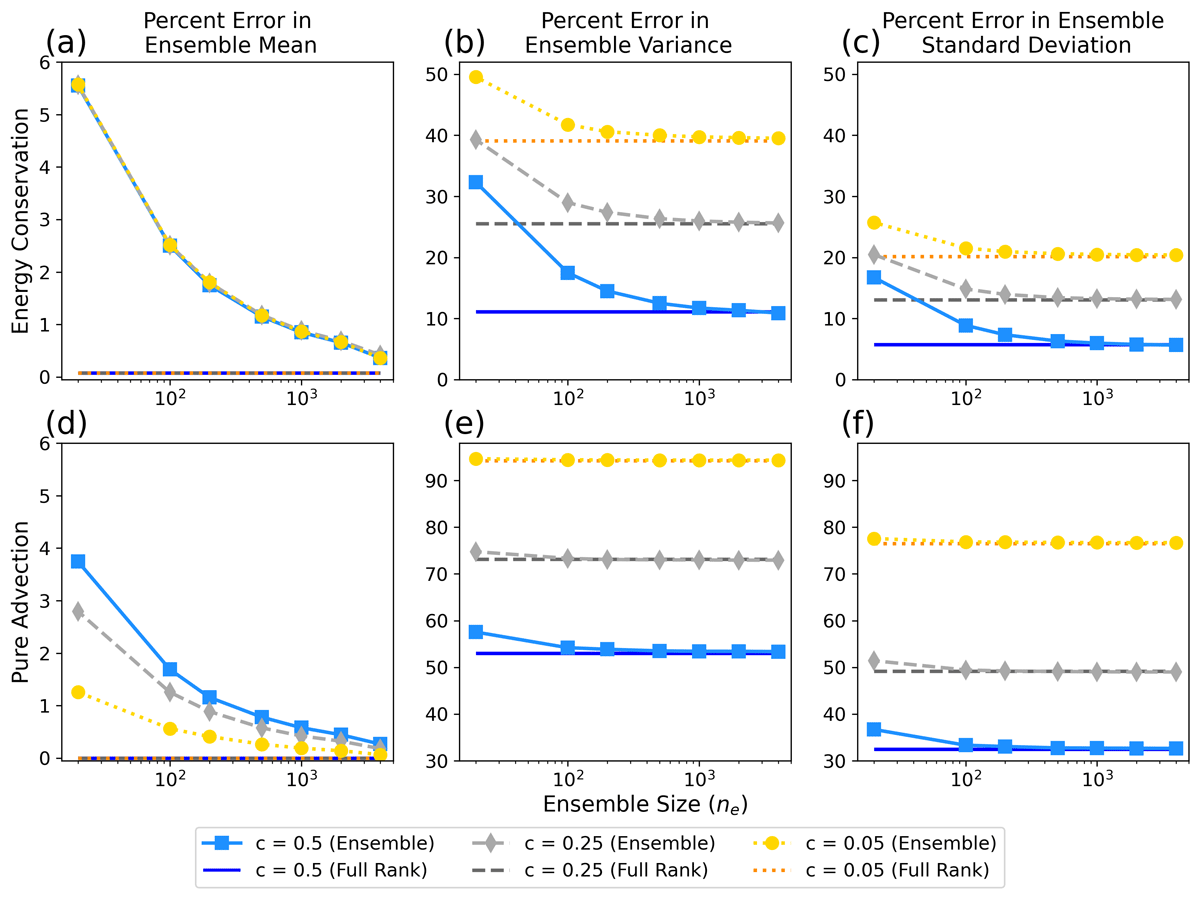
Figure 1
Percent error in the mean, variance, and standard deviation estimated from ensemble and full-rank propagation. Panels (a) and (d) plot the average percent error in the ensemble mean (scatter markers; Ensemble in the legend) and mean state from full-rank propagation (Full Rank in the legend) relative to the exact mean state. Panels (b) and (e) plot the average percent error in the ensemble variance (scatter markers; Ensemble in the legend) and covariance diagonals from full-rank propagation (Full Rank in the legend) relative to the exact variance. Panels (c) and (f) plot the average percent error in the ensemble standard deviation (scatter markers; Ensemble in the legend) and the square root of the covariance diagonals from full-rank propagation (Full Rank in the legend) relative to the exact standard deviation. All errors are plotted as a function of ensemble size (horizontal axis) and initial correlation length Lc (color; denoted by c in the legend). The top row (a, b, c) corresponds to the energy conservation case, and the bottom row (d, e, f) corresponds to the pure advection case. Errors are computed at the final time Tf for the two respective numerical experiments, see text for details.
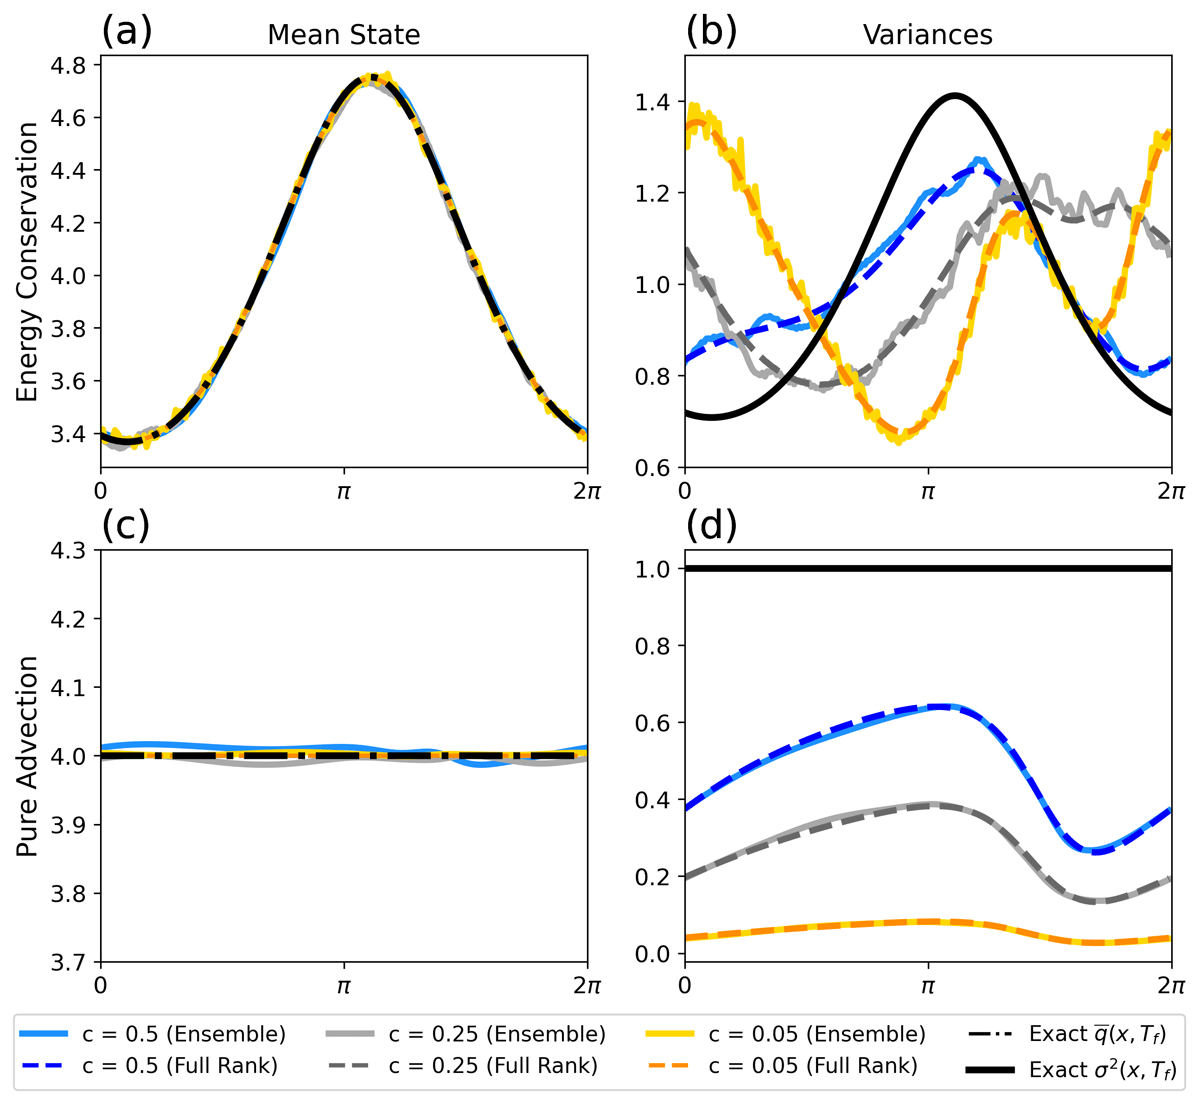
Figure 2
Comparison of exact mean state and variance with approximations by the propagated ensemble and corresponding full-rank propagation. Panels (a) and (c) compare the exact mean state (Exact in the legend) with the ensemble mean (solid color; Ensemble in the legend) and mean state propagated directly at full rank (dashed color; Full Rank in legend) for the different initial correlation lengths Lc (denoted by c in the legend) for the energy conservation (a) and pure advection (c) cases. The mean states propagated at full rank either identically or almost identically overlap with the exact mean state solution (black dashdot). Panels (b) and (d) compare the exact variance (Exact in the legend) with the ensemble variance (solid color; Ensemble in the legend) and variances approximated by full-rank covariance propagation (dashed color; Full Rank in legend) for different initial correlation lengths. The ensemble means and variances are calculated for ensemble size . Note the different vertical scales in each panel.
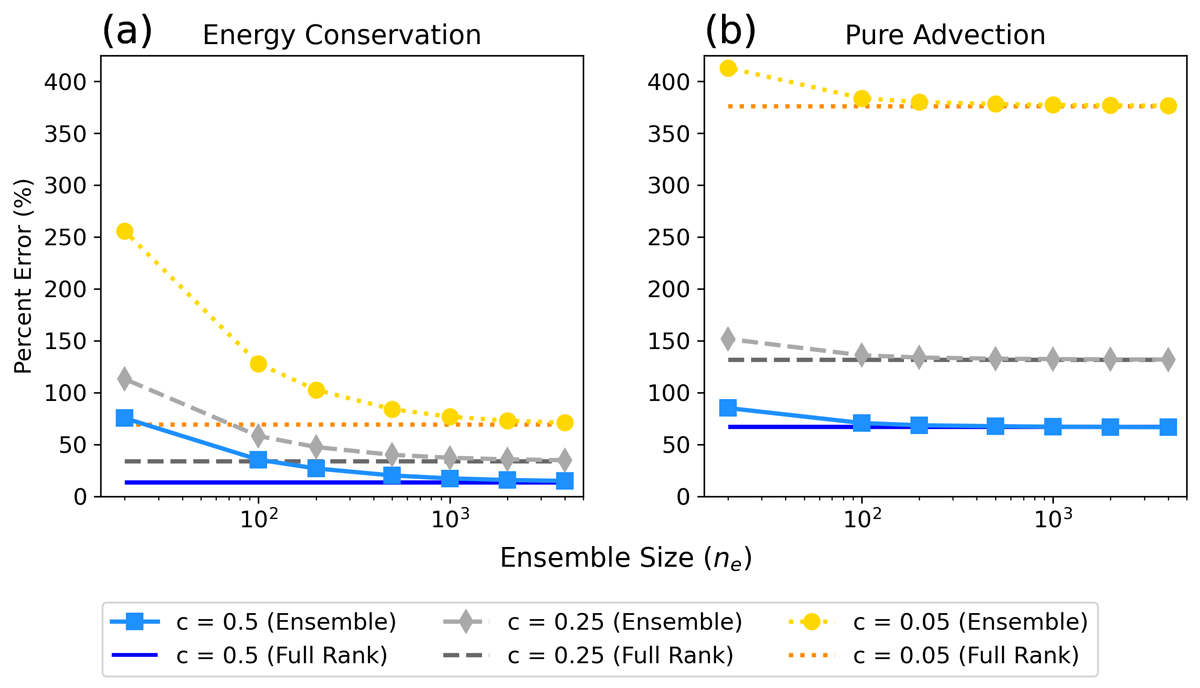
Figure 3
Percent error in the correlations estimated from the ensemble and full-rank propagation. Panels (a) and (b) plot the average percent error in the ensemble correlations (markers; Ensemble in the legend) and correlations from full-rank discrete covariance propagation (Full Rank in the legend) relative to the exact correlations as a function of ensemble size (horizontal axis) and initial correlation length Lc (color; denoted by c in the legend). Panel (a) corresponds to the energy conservation case and panel (b) corresponds to the pure advection case. Errors are computed at the final time Tf for the two respective numerical experiments and using the Frobenius norm.
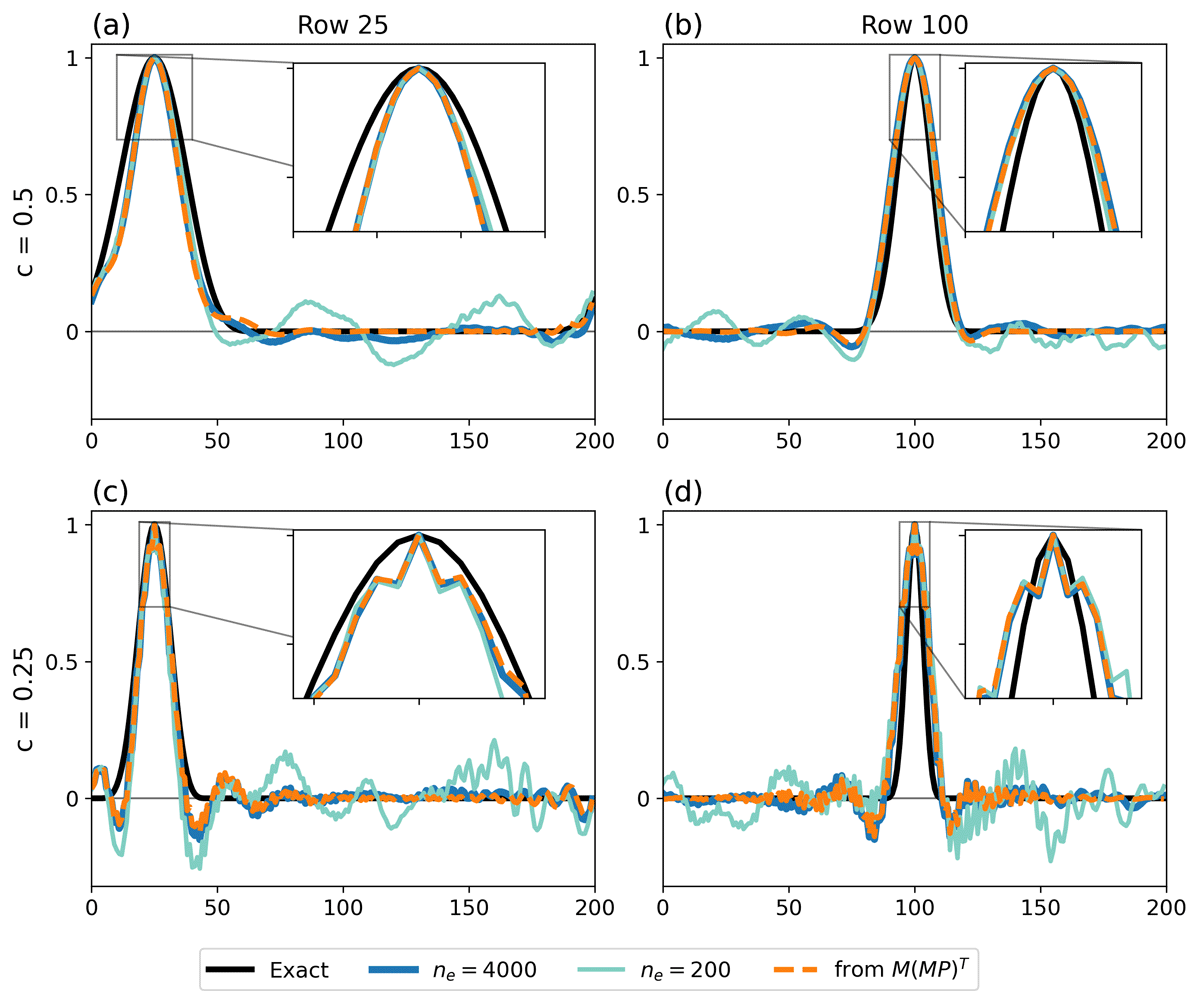
Figure 4
One-dimensional correlations for the energy conservation case. Each panel plots the exact correlation (solid black), correlation from full-rank covariance propagation (dashed orange), with ensemble correlations for (solid blue) and (solid light teal) at the final time for the energy conservation dynamics. Panels (a) and (b) correspond to an initial covariance with and (c) and (d) with . Row 25 of the correlation matrix is shown in (a) and (c); row 100 in (b) and (d). In each panel, the inset axis shows a zoomed-in portion of the correlations near zero separation.
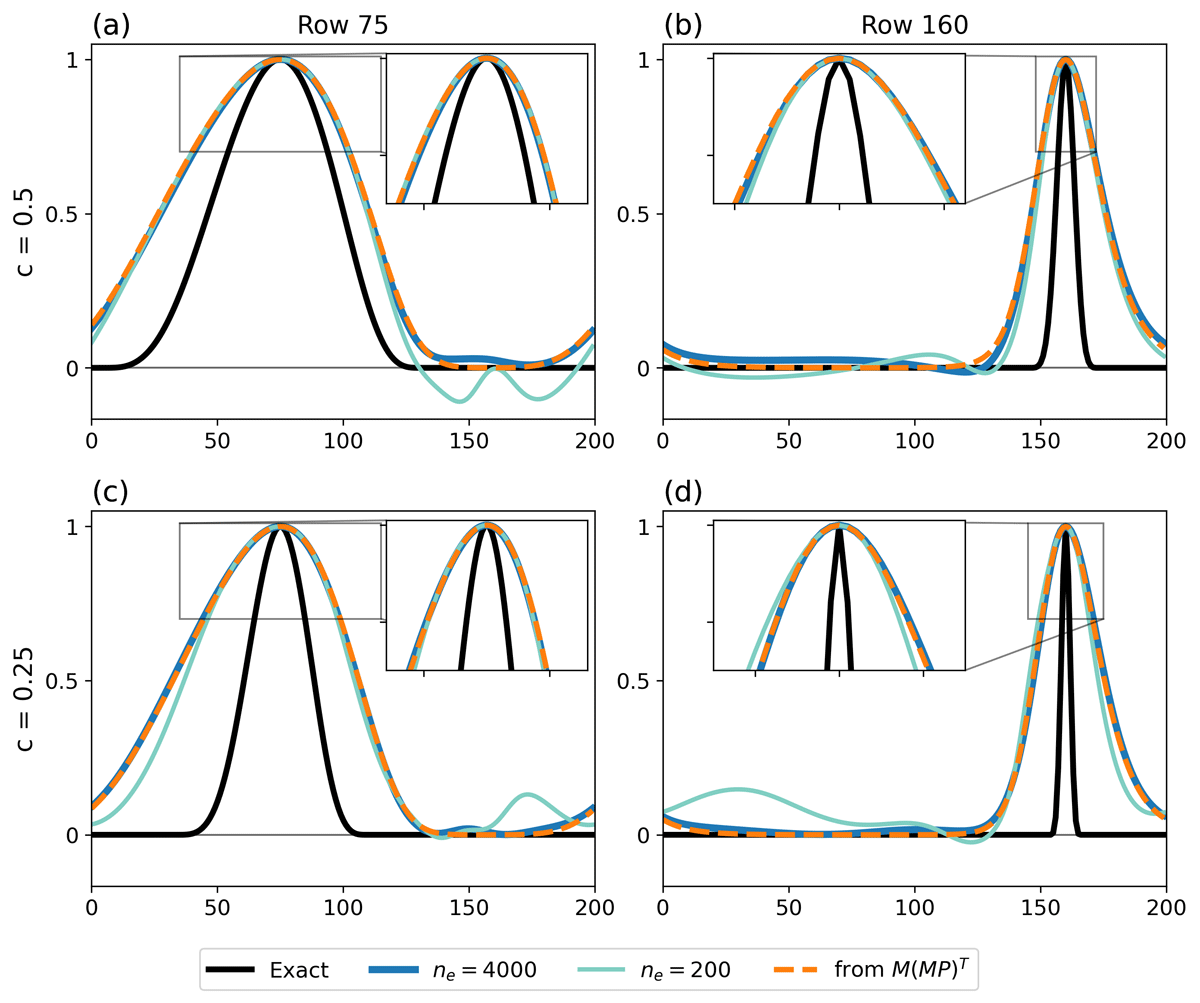
Figure 5
One-dimensional correlations for the pure advection case. Same as Figure 4 for the pure advection case, corresponding to and for row 75 in panels (a) and (c) and row 160 in (b) and (d).