
1. Introduction
Decomposition is a bottleneck in the carbon (C) and nutrient cycles. Microorganisms that catalyze the initial steps of decomposition face strong nutrient limitation, as plant residues typically have lower nutrient contents compared to the decomposer demands (Mooshammer et al., 2014). Microbial nutrient limitation can, in turn, alter cycling of soil C and nutrients [especially, nitrogen (N)], possibly leading to persistent nutrient scarcity for vegetation (Vitousek & Howarth, 1991). To what degree element cycling is affected by nutrient limitation is still a matter of debate, as the consequences of nutrient limitation on element cycling depend on how microorganisms respond to stoichiometric imbalances. In fact, depending on how microorganisms face nutrient limitation, C in excess of the microbial stoichiometric demand can either remain in the soil organic matter (potentially adsorbed to soil minerals or occluded in aggregates) or be released as carbon dioxide or dissolved organic matter. If this excess C remains in the soil, it is possible that nutrient limitation is exacerbated, resulting in large soil C stocks but low primary productivity (Janzen, 2006). In contrast, if C exceeding the microbial demand is released, microbial growth would be reduced, lowering nutrient demand for growth, so that nutrients associated to the released C could be mineralized even under nutrient poor conditions. The resulting mineralized nutrients would support primary productivity while organic C would be lost. Thus, microbial responses to nutrient limitation can have an impact on both primary productivity and ecosystem C budgets.
Four main responses to nutrient limitation have been hypothesized: (1) selective acquisition of the most limiting element, (2) increase of microbial biomass C to nutrient ratio [more for phosphorus (P) than for N], (3) regulation of C use efficiency (CUE, the ratio of microbial growth over C uptake), and (4) regulation of nutrient retention when microbial cells die or become inactive (Spohn, 2016). Microorganisms can preferentially produce specific extracellular enzymes to target the most limiting elements, and they can upregulate the expression of transporters thus compensating for nutrient limitation by altering the relative rates of C and nutrient acquisition from organic matter (Averill, 2014; Sinsabaugh & Moorhead, 1994; Wutzler et al., 2017). To some degree, microorganisms can also adjust their biomass C to nutrient ratio (Camenzind et al., 2021; Heuck, Weig, & Spohn, 2015), for example, by storing excess C in C-rich compounds (Butler, Manzoni, & Warren, 2023; Mason-Jones et al., 2022), and by replacing cellular compounds with others of different nutrient content (Warren, 2020). While C:P biomass ratios can vary more widely, the C:N of the active microorganisms is relatively stable at the community level, setting limits to how much microbial biomass stoichiometry can match substrate stoichiometry (although C:N of mycorrhizal mycelium can increase at low N availability, Högberg et al., 2021). CUE tends to decrease as the substrate C-to-nutrient ratios widen (Lashermes et al., 2016; Manzoni et al., 2017). At the ecosystem level, this response essentially decouples C and nutrient cycles by removing excess C from the system, thus decreasing C storage potential. Alternatively, nutrients could be recycled more efficiently when they are in limited supply (Boberg et al., 2014; Camenzind et al., 2023; Falconer et al., 2005; Spohn, 2016). This could be achieved by nutrient reallocation and retention within multicellular organisms or biofilms (transfer from the senescing part of the biomass to the growing part), by intra-cellular recycling of nutrient-rich compounds, and by uptake of nutrients from necromass by growing cells nearby. These mechanisms lead to longer residence time of limiting nutrients within the microbial biomass (Spohn & Widdig, 2017). For example, in fungi, nutrients could be reallocated via vacuolization—that is, N rich protoplasm is moved from the old mycelium to the tip of the hyphae by filling the space in the older hyphae with a vacuole, as the old mycelium senesce and eventually die. In this way, the growing mycelium reuses internal nutrients for growth and can rely less on external nutrients (Veses, Richards, & Gow, 2008). N recycling occurs also in bacteria, which recycle amino-acids and part of their cell wall, in particular under nutrient limitation (Mayer et al., 2019), or intracellular enzymes from dying cells to growing ones during cell division (Hartl et al., 2017). The net result of these processes is a higher nutrient retention at the microbial community level. In the following, we collectively refer to these mechanisms as ‘N recycling’.
While there is evidence in support of all these responses, it is difficult to determine which of them is dominant under certain conditions, and thus to predict if nutrient limitation triggers C release (CUE regulation) or promotes C and nutrient retention (the other three responses). This difficulty arises because measuring microbial traits involved in C and nutrient acquisition and use is challenging, especially in decomposing litter. Multiple methods exist to measure CUE, but they are based on different underlying assumptions, target different aspects of microbial resource use, and thus yield variable CUE (Geyer et al., 2019; He et al., 2024; Schimel, Weintraub, & Moorhead, 2022). The tracing of isotopically labeled compounds (13C or14C labeled substrates or 18O labeled water) into microbial biomass is most commonly used and most directly targets (substrate-specific or substrate-independent, respectively) CUE (He et al., 2024; Schimel, Weintraub, & Moorhead, 2022). However, the various methods used to estimate microbial biomass require conversion factors associated with large uncertainties (Čapek et al., 2023; Glanville et al., 2016; Pold, Domeignoz-Horta, & DeAngelis, 2020). Furthermore, the production of extracellular compounds like extracellular polymeric substances and exoenzymes remains neglected (Bölscher et al., 2024). The activities of extracellular enzymes can also be measured to detect preferential acquisition of a certain element, but measured activities in soil also include stabilized enzymes and possibly those produced by roots, making it difficult to link the measured activities to microbial response to nutrient limitation (Burns et al., 2013; Schimel, Weintraub, & Moorhead, 2022). Regarding nutrient recycling, substantial reallocation of P (Boddy, 1999) and N (Tlalka et al., 2002) within fungal mycelia has been demonstrated using radioactive tracers, but is challenging to quantify due to the inhomogeneous distribution of the tracers and the difficulty in recovering it in the cells. Overall, these empirical approaches provide insights on individual processes, but they have not been applied systematically over large scales or across very diverse litter types. Therefore, here we rely on mathematical modeling combined with a large set of decomposition data to estimate microbial traits that characterize nutrient limitation responses.
Process-based models can be used to describe microbial C and nutrient acquisition and use during decomposition. Models of C and N dynamics featuring each of the four responses to N limitation have similar explanatory power (Manzoni et al., 2021). Therefore, model performance alone does not seem to be a sufficient criterion to identify the dominant responses. However, it is also possible that fitting of simple but robust models with closed-formed solutions and few but biologically meaningful parameters (which we call ‘minimal models’) to a large number of datasets can shed some light on this question. With this approach, it becomes possible to assess if the microbial traits estimated from model fitting vary systematically with environmental conditions or litter chemistry (Ågren et al., 2013; Manzoni et al., 2010). Even if a model fits well to decomposition data, patterns in the estimated parameters might have different interpretations. For example, Manzoni et al. (2017) demonstrated that microorganisms may maximize their growth rate by reducing CUE at high C:N and C:P ratios. In fact, high CUE would imply a too high nutrient demand for growth in nutrient limited environments, causing growth inhibition. However, their model did not account for the possibility that nutrients can be recycled from senescent biomass, thus attributing variations in litter N and P import and release to changes in CUE only. It can be argued that lowering CUE under nutrient limitation is not a beneficial response, as it leads to wasteful loss of C by respiration or investment of C in products that are not contributing to growth (Maitra & Dill, 2015). This raises the question of whether CUE regulation is indeed an optimal response to nutrient limitation. Whether other physiological responses to nutrient limitation can better promote microbial fitness remains an open question.
Here we used a minimal model describing how litter N varies as a function of remaining litter C in a single cohort of decomposing litter. We fitted model parameters representing preferential N acquisition, CUE, and N recycling efficiency, and assessed how they varied across litter types with a broad range of initial C:N, and during decomposition as litter C:N is progressively reduced. Six model variants, in which preferential N acquisition, CUE, or N recycling efficiency were allowed to vary either only across litter types or both across litter types and through time. Importantly, these models describe the stoichiometric relations between litter N and C, rather than the kinetics of decomposition. This approach allows us to neglect the effect of environmental conditions (e.g., temperature and moisture) on the decomposition rates, while focusing on how environmental conditions and litter chemistry affect the parameters representing microbial responses to N limitation. These models were used to address the following questions:
– Can flexible preferential N acquisition or N recycling from senescent microbial biomass explain N accumulation and release in decomposing litter?
– Are preferential microbial N acquisition and N recycling increased under N limitation?
Changes in N acquisition and recycling across litter types are then compared to the expected and already documented decline in CUE in N-poor litter—a pattern that alone explains well N accumulation and release in litter (Manzoni et al., 2010; Manzoni et al. 2017).
2. Methods
2.1 Theory
2.1.1 Model rationale
We used macro-chemical (total C and total N) data from litter decomposition studies in combination with several variants of a minimal mathematical model to identify potential N limitation responses in litter decomposer communities. The model tracks C and N in litter substrates and microbial biomass (Figure 1) and includes parameters describing N versus C acquisition preference, CUE, and N recycling efficiency. Instead of using the model to determine the temporal trajectory of litter C and N during decomposition, we used it to find analytical expressions for the N import/release curve; that is, the relation between the fraction of initial N and the fraction of initial C that remain in the litterbags during decomposition. As shown mathematically in the following, the decomposition rates (and thus the effects of environmental conditions on these rates) do not affect the relations between litter N and C (Eq. (10)). Therefore, this approach allowed us to focus on microbial traits (at the community level) that affect litter stoichiometry, rather than on environmental and litter chemical conditions that control the speed of decomposition. Specifically, we estimated the degree of preferential N acquisition (denoted by α), microbial CUE (denoted by e), and efficiency of N recycling (denoted by η) within the community across litter types and climatic conditions. While the mathematical approach per se is not new (Ågren et al., 2013; Bosatta & Ågren, 1985; Manzoni, 2017; Manzoni et al., 2010), it was previously restricted to CUE estimation, neglecting the possible role of other traits (Table 1).
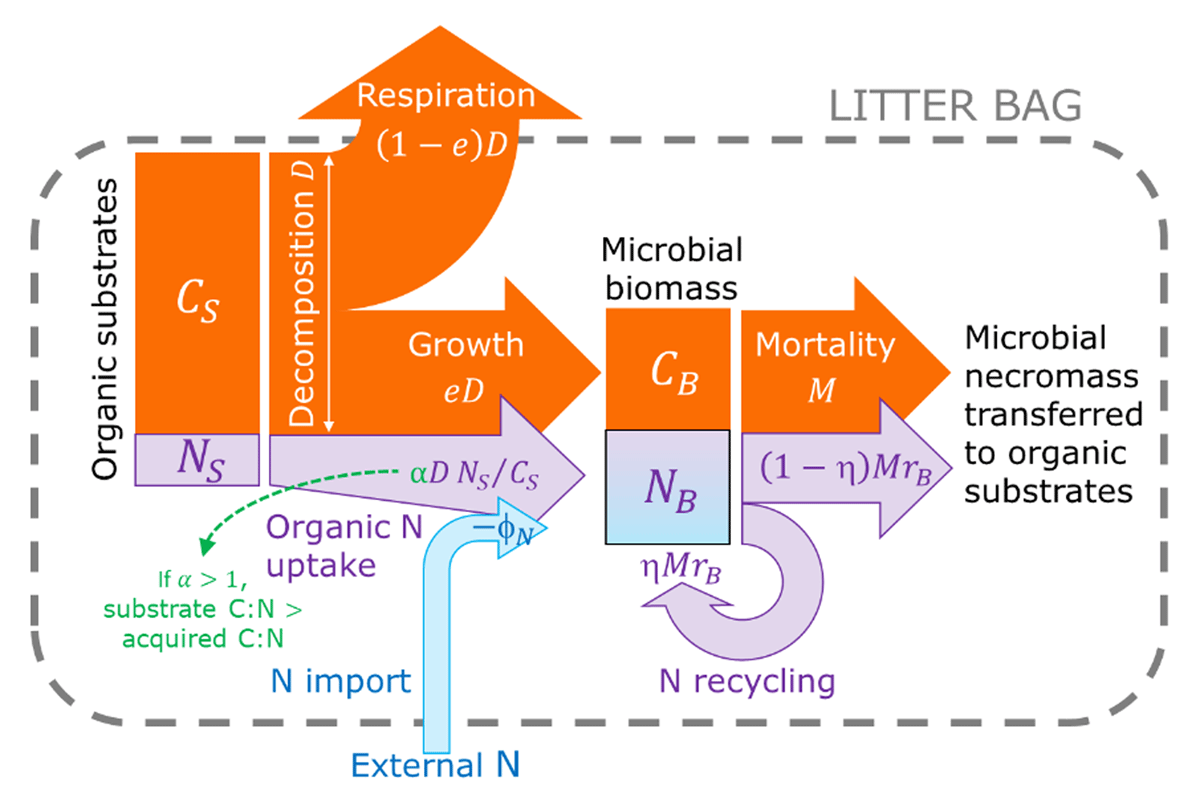
Figure 1
Schematic of the microbial biomass C and N exchanges [see symbol explanations in Table 1 and Eqs. (3) and (4)]. Orange, violet, and blue arrows indicate fluxes of organic C, organic N from residues, and inorganic or organic N from external sources, respectively. Necromass-derived organic substrates are returned to the substrate compartments (not shown for simplicity). The C:N ratio of acquired organic substrates can be lower than that of the original substrate if N is preferentially acquired (α > 1). The outer dashed box represents the modeled system (litter bag), which exchanges with the environment only through respiration and N release/import. In this illustration, N is imported (arrow pointing to NB) due to insufficient amount of substrate N—that is, external N accumulates within the litter bag).
Table 1
Symbol definitions and units (see also Figure 1). State variables are expressed in terms of C or N mass per litterbag.
| SYMBOL | EXPLANATION | UNITS |
|---|---|---|
| State variables and independent variables | ||
| cL | Fraction of initial litter C, cL = CL/CL,0 | – |
| CB | Microbial biomass C | g C |
| CL | Total litter C, CL = CS + CB | g C |
| CS | Litter substrate C | g C |
| nL | Fraction of initial litter N, nL = NL/NL,0 (nL > 1 when N is imported) | – |
| NB | Microbial biomass N | g N |
| NL | Total litter N, NL = NS + NB | g N |
| NS | Litter substrate N | g N |
| t | Time | Y |
| Rates and other calculated quantities | ||
| D | Litter decomposition rate | g C y–1 |
| G | Microbial growth rate, G = eD | g C y–1 |
| M | Microbial mortality rate | g C y–1 |
| φN | Net N import/release rate (net N import when φN < 0) | g N y–1 |
| ē | Mean C use efficiency throughout the decomposition process | – |
| Initial conditions | ||
| CL,0 | Initial total litter C | g C |
| C : NL,0 | Initial litter C:N ratio, C : NL,0 = 1/rL,0 | g C g N–1 |
| L0 | Initial lignin fraction | g lignin g litter–1 |
| NL,0 | Initial total litter N | g N |
| rL,0 | Initial litter N:C ratio, rL,0 = 1/C : NL,0 | g N g C–1 |
| Parameters | ||
| a | Exponent in Eqs. (15)–(17) | – |
| b | Half saturation constant in Eqs. (15)–(17) | g N g C–1 |
| b0 | Half saturation constant at zero lignin content in Eqs. (15)–(17) | g N g C–1 |
| b1 | Sensitivity to lignin content of the half saturation constant in Eqs. (15)–(17) | g N g litter g C–1 g lignin–1 |
| e | Microbial C-use efficiency (0 < e ≤ emax) | – |
| e0 | Microbial C-use efficiency when rL,0 = 0 (0 < e0 ≤ emax) | – |
| emax | Maximum microbial C-use efficiency (emax = 0.6) | – |
| rB | N:C ratio of microbial biomass | g N g C–1 |
| α | Preferential N acquisition coefficient (αmin ≤ α ≤ αmax) | – |
| α0 | Preferential N acquisition coefficient when rL,0 = 0 (αmin ≤ α0 ≤ αmax) | – |
| αmin, αmax | Lower and upper bounds for the fitting of the preferential N acquisition coefficient | – |
| η | N recycling efficiency (0 ≤ η < 1) | – |
| η0 | N recycling efficiency when rL,0 = 0 (0 ≤ η0 < 1 ) | – |
2.1.2 Mass balance equations
The mass balance equations for the litter substrate C and N (respectively CS and NS) can be written as,
where D is the substrate decomposition rate (equal to microbial uptake rate, as we neglect losses of depolymerized products), M is the microbial mortality rate, and α is a coefficient capturing the preferential uptake of substrate N (Manzoni et al., 2010). When α > 1, microorganisms take up proportionally more N than according to the C:N of the bulk substrate. η is the efficiency of N recycling (defined as in Manzoni et al., 2021), and rB is the microbial biomass N:C ratio. When recycling occurs (η > 0), the fraction η of N in senescing biomass is retained within the biomass, thereby decreasing the necromass N:C ratio compared to N:C ratio of the living biomass (see Eq. (4)), while the fraction 1 – η is transferred to the substrate compartment (and thus appears in Eq. (2) as an input).
The mass balance equations for the microbial biomass C and N (respectively CB and NB) can be written as,
where φN is the net N import/release rate (φN is positive when N is released by the microorganisms, negative when it is imported, as in Figure 1), and e is the microbial CUE (growth rate G = eD). Net N release changes depending on C and N uptake to allow microorganisms to maintain a fixed C:N ratio through time (Manzoni & Porporato, 2009). This stoichiometric constraint is imposed by setting,
Substituting in Eq. (5) the two mass balances in Eq. (3) and (4) we find the net N import/release rate,
where the three terms on the right-hand side represent the rate of N uptake, the rate of N use to grow new biomass at a rate eD, and the rate of N that is recycled within the microbial community at senescence, respectively. If η = 0 and α = 1, Eq. (6) recovers the definition of net N release commonly adopted in soil C–N cycling models (Manzoni & Porporato, 2009).
We can now derive the mass balance equations for the whole litter C and N by summing up the equations for substrate and microbial biomass,
Equation (8) can be slightly reformulated by assuming that microbial biomass is at quasi equilibrium at the time scales relevant for litter decomposition (months to years), so that M ≈ eD, and by noting that microbial biomass is a small fraction of the total litter, so that NS ≈ NL and CS ≈ CL,
2.1.3 Derivation of the N import/release curves with time-invariant traits
To derive the analytical curve linking the N pool to remaining C in the litterbags, we combine Eqs. (7) and (9) in a single ordinary differential equation with CL as the independent variable and NL as the dependent variable,
and initial condition NL(CL = CL,0) = NL,0. It is important to note that in Eq. (10), the decomposition rate D does not appear—this means that expressing litter N mass as a function of litter C mass removes environmental effects on decomposition rates and allows focusing instead on litter stoichiometry as controlled by the microbial traits α, η, e, and rB.
It is convenient to rewrite the state variables in normalized form as fractions of initial litter C and N. This is done by dividing CL and NL by the initial mass of litter C and N in the litterbags and obtaining the normalized variables cL = CL/CL,0 and nL = NL/NL,0. Using the normalized variables, Eq. (10) becomes,
with initial condition nL(cL = 1) = 1, and where rL,0 is the initial litter N:C ratio. Notably, the equation depends on the ratio between microbial and initial litter N:C, rB/rL,0, which is the stoichiometric imbalance defined by Mooshammer et al. (2014).
Equation (11) has a compact analytical solution if traits α, η, e, and rB are time invariant (see details in Manzoni, 2017),
If N is not recycled within the community (η = 0) the N release curve derived by Manzoni et al. (2010) is recovered. If, additionally, N is not preferentially taken up (α = 1), Eq. (12) simplifies further to,
which is the simplest formulation for the N import/release curve, mathematically equivalent to that derived in earlier works (Bosatta & Ågren, 1985; Bosatta & Staaf, 1982).
We considered three model variants based on Eq. (12), in which only α (model Aflex), only e (model Cflex) or only η (model Nflex) are estimated by fitting the analytical nL(cL) curve to data on remaining litter N and C (Table 2).
Table 2
Summary of model variants, including how C use and N recycling efficiencies are parameterized, which parameters are fitted to data, and which equations are used for the fitting.
| MODEL VARIANT | FIGURE LINE STYLE AND COLOR | PREFERENTIAL N ACQUISITION, α | C USE EFFICIENCY, e | N RECYCLING EFFICIENCY, η | FITTING PARAMETERS | FITTING EQUATION | |
|---|---|---|---|---|---|---|---|
| Time-invariant traits | Aflex | Dashed green | α | emax | 0 | α | Eq. (12) |
| Cflex | Dashed orange | 1 | e | 0 | e | Eq. (13) | |
| Nflex | Dashed blue | 1 | emax | η | η | Eq. (12) | |
| Dynamic traits | Adyn | Solid green | emax | 0 | α0 | Eq. (11) | |
| Cdyn | Solid orange | 1 | 0 | e0 | Eq. (11) | ||
| Ndyn | Solid blue | 1 | emax | η0 | Eq. (11) or Eqs. (13) and (14) |
2.1.4 N import/release curves with microbial traits varying during decomposition
We also considered three more general model variants, in which α, e, and η are functions of the current litter C:N ratio. The rationale behind these variants is that N acquisition (model Adyn), CUE (model Cdyn), or N recycling (model Ndyn) could be regulated during litter decomposition so that N acquisition is prioritized, CUE is lower, or more N is resorbed at early stages of decomposition when the litter C:N is still high (Table 2). As in the model variants with time-invariant traits, traits are allowed to vary one at a time. In model Adyn, N acquisition is assumed to be higher (relative to the pool) than C acquisition at high litter C:N. This effect is captured by imposing that α decreases from a maximum hypothetical value characterizing a litter completely devoid of N (α0) to α = 1 when the litter C:N reaches the microbial biomass C:N (solid green curve in Figure 2A). In model Cdyn, CUE is assumed to increase linearly with decreasing litter C:N, from a minimum hypothetical value for a litter without N (e0) to a maximum value (emax) when litter C:N reaches the microbial biomass C:N (solid orange curve in Figure 2B). In model Nflex, η is assumed to decrease linearly with decreasing litter C:N ratio, from a maximum hypothetical value for a litter without N (η0) to zero when litter C:N reaches the microbial biomass C:N (Table 2, blue solid curve in Figure 2C).
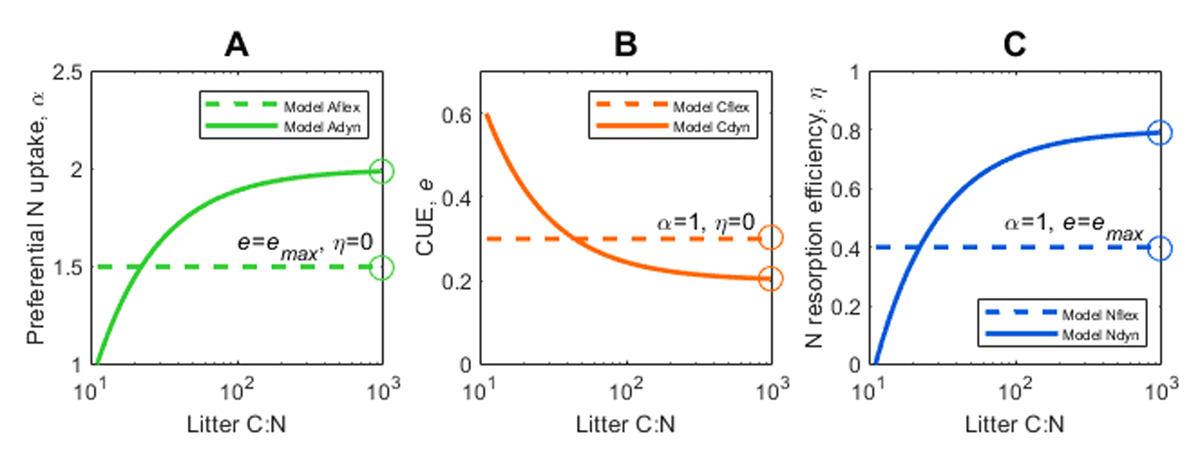
Figure 2
Relations between microbial traits and litter C:N during decomposition. (A) Coefficient indicating preferential N acquisition (α), (B) microbial C use efficiency (CUE, e), and (C) N recycling efficiency (η) as a function of litter C:N. Line styles refer to different model variants (legend); open symbols show the trait values that are estimated by fitting N import/release curves to the data. The equations for each of these relations are shown in Table 2.
In models Adyn and Cdyn, the relations between α or e and nL/cL introduce nonlinearities in Eq. (11) that prevent compact analytical solutions, so we solved Eq. (11) numerically. In contrast, model Ndyn can be formulated exactly as model Cflex (Eq. (13)), where e in Cflex is related to η0 in Ndyn according to,
Given the mathematical equivalence of models Cflex and Ndyn, η0 can also be determined analytically.
2.2 Litter decomposition data
We started from the database of litter decomposition datasets used by Manzoni et al. (2017) and added datasets encompassing N-poor needles and wood (B. J. Wijas et al., 2024; Khanina et al., 2023; Smyth et al., 2016; Spohn & Berg, 2023) to better cover the higher end of the litter C:N range. Decomposition data from aquatic systems and wetlands were not included. Each dataset includes multiple measurements of remaining C and N in litterbags or wood blocks, as well as initial litter C:N ratios. The model does not account for leaching of soluble compounds that often occurs early during decomposition. Therefore, we followed the method described by Manzoni et al. (2010) to identify and remove the initial leaching phase. In practice, in datasets where leaching was present, we considered only data points after the initial leaching phase, resetting the initial litter C:N ratio as the C:N of the first point after the leaching phase. Moreover, we excluded datasets with fewer than six data points from the analysis (to ensure robust parameter estimation) as well as those datasets in which final mass loss was lower than 60% (to ensure the estimated parameters are representative of all or most of the decomposition process). The former requirement was relaxed for wood decomposition datasets, which often do not include more than five datapoints. Litterbags from plots fertilized during the field incubation were also disregarded. After screening, we retained ~500 N import/release curves from ~40 published articles (Ball, Bradford, & Hunter, 2009; Berg & McClaugherty, 1989; Blair et al., 1998; Busse, 1994; Chen et al., 2015; Chuyong, Newbery, & Songwe, 2002; Edmonds, 1987; Foster & Lang, 1982; Hirobe et al., 2004; Hobbie, 2008; Hobbie et al., 2012; Isaac & Nair, 2005; Jacob et al., 2009; Kamei, Barik, & Pandey, 2009; Khanina et al., 2023; Krankina, Harmon, & Griazkin, 1999; Lambert, Lang, & Reiners, 1980; Li, Han, & Zhang, 2007; Liu, Fox, & Xu, 2000; Long-term Intersite Decomposition Experiment Team, 1995; Means, Macmillan, & Cromack, 1992; Melillo et al., 1989; Moore et al., 2006; Osono & Takeda, 2004; Osono & Takeda 2005; Palm & Sanchez, 1990; Palviainen & Finer, 2015; Parsons & Congdon, 2008; Ricker et al., 2016; Rustad, 1994; Schroth, Zech, & Heimann, 1992; Smyth et al., 2016; Sollins et al., 1987; Spohn & Berg, 2023; Thompson & Vitousek, 1997; Tripathi & Singh, 1992; Trofymow & CIDET, 1998; Tu et al., 2014; B. J. Wijas et al., 2024; Xu, 2006; Xu & Hirata, 2005; Yavitt & Fahey, 1986; Zhu & Ehrenfeld, 1996) or online data repositories (Harmon, 2013; Hobbie, 2013; Hobbie 2015; B. Wijas et al., 2024).
For each litter decomposition dataset, we used the original sources to collect—when available—initial lignin contents and climatic data (mean annual precipitation, MAP, and mean annual temperature, MAT), which were used as covariates to predict the microbial traits (Tables S1 and S2). Wood lignin contents for the species in Khanina et al. (2023) were obtained from Kahl et al. (2017) and for the species in Wijas et al. (2024) from Lee et al. (2022).
2.3 Estimation of microbial traits
To estimate the microbial traits, we considered the three model variants with time-invariant microbial traits (Aflex, Cflex, and Nflex) and the three variants with traits that change through time during decomposition (Adyn, Cdyn, and Ndyn; Table 2). Parameters encoding preferential N acquisition (α or α0), CUE (e or e0), and N recycling efficiency (η or η0) were estimated by fitting either the analytical N import/release curves [Eqs. (12) or (13)] or the numerical solution of Eq. (11) to litter remaining N and C data. All calculations were done in Matlab (MathWorks, 2024). When a numerical solution was necessary, we implemented the numerical integration of Eq. (11) (ode45 function) into a least square optimization algorithm (lsqcurvefit function). To constrain the parameter optimization algorithm, minimum and maximum values were set for α or α0 (1 ≤ α or α0 ≤ 10), e (0 ≤ e ≤ emax = 0.6), e0 (0 ≤ e0 ≤ emax = 0.6), and η or η0 (0 ≤ η or η0 ≤ 1). The maximum value of N recycling efficiency was set to one, but we expected that realistic values would be lower, as at least some N is likely to be left behind in necromass.
Model performance was evaluated by calculating the root mean square errors (RMSE) for each model variant. All model variants had the same degree of freedom (one fitting parameter), allowing a comparison only based on RMSE. To summarize and compare model performances, we finally calculated the percentage of datasets in which each model variant achieved the lowest RMSE, either among the models with time invariant traits (Aflex, Cflex, and Nflex) or among the models with dynamic traits (Adyn, Cdyn, and Ndyn). The estimated microbial traits and RMSE are reported in Table S3.
2.4 Analysis of C-use and N recycling efficiencies
We tested the combined effects of initial litter chemistry and climate on the microbial traits using linear statistical models (fitlm function) with initial litter C:N ratio (log transformed), initial lignin content, MAP, and MAT as predictors, including C:N-lignin and MAP–MAT interactions. All independent and dependent variables were normalized before the statistical analysis (subtracting the mean and normalizing by the standard deviation). Since climate in general did not affect the estimated microbial traits, but initial C:N and lignin content did, we focused on these chemical properties in more detailed analyses.
We assessed the relations between litter initial C:N ratios and the estimated e and η using sigmoidal functions,
where a (exponent) and b (half saturation constant) are fitting parameters representing the steepness of the sigmoidal curve at the inflection point, and the location of the inflection point, respectively; αmin and αmax are the lower and upper bounds of α . The choice of these functions is motivated by their flexibility despite a low number of fitting parameters. We also considered a variant to Eqs. (15)–(17) in which we could test if initial lignin content modulates the effect of initial litter C:N on the microbial traits. This analysis was restricted to the decomposition datasets in which initial lignin content was available (87% of the total number of datasets). Lignin effects were included in the parameter b, as b = b0 + b1L0, where b0 and b1 are fitting parameters and L0 is the initial lignin content expressed as a fraction of litter dry weight.
Nonlinear least square fitting was performed with the function lsqcurvefit. Positive values of a indicate that the sigmoidal curve is increasing with rL,0, whereas negative values indicate a decreasing curve. Trends with increasing rL,0 were considered significant if the 95% confidence interval of a did not bracket zero.
Once the microbial traits are estimated, it is possible to use the mass balance equations [Eqs. (7) and (8)] to calculate the mean CUE throughout the decomposition process—interpreted here as a measure of growth performance at the microbial community level. The mean CUE is defined as the total C converted into new biomass divided by the total C taken up,
It is convenient to calculate the integrals in Eq. (18) along the variable CL (total remaining C) instead of time, recalling that at the beginning of decomposition, t = 0 and CL = CL,0 (initial litter C), while at the end of decomposition, t = ∞ and CL = 0. Changing the variable of integration, we obtain,
We note that (Eq. (7)), and that we can change the variable of integration further from the total litter C to the fraction of initial litter C (c). As a result, the calculation of ē reduces to,
In models Aflex, Cflex, Nflex, Adyn, and Nflex, e is time-invariant, so ē = e in Cflex and ē = emax in the other variants. In contrast, in model Cdyn, e varies during decomposition, so the integral cannot be further simplified and needs to be calculated numerically (trapz function). The relations between ē and initial litter C:N were assessed using Eq. (16).
3. Results
3.1 Effect of preferential N acquisition, C-use, and N recycling efficiencies on the N import/release curves
N import/release curves illustrate how, the remaining litter N as a fraction of the initial litter N (nL), changes as a function of the remaining litter C as a fraction of the initial litter C (cL). These curves start from the initial litter C and N, at the point cL = 1 and nL = 1, and end when all litter has been decomposed, at the point cL = 0 and nL = 0. Their shape depends on both the initial litter C:N ratio and microbial traits—here α, CUE, and η. High values of initial litter C:N cause N to accumulate (nL > 1) within decomposing litter, because microorganisms retain N in their biomass and import N from the environment to fulfill their stoichiometric requirements (Figure 3A). Net N release from these N-poor litter types starts relatively late during the decomposition process. In contrast, with N-rich litter (low initial C:N), N release can start from the beginning and no N accumulation occurs (nL < 1). Preferential acquisition of N from the litter (i.e., α > 1) increases internal N availability and thus reduces external N requirements, ultimately lowering the peak in litter N (compare green dashed and solid gray curves in Figure 3A). Lower values of CUE decrease the microbial N demand linked to growth, and thus also lower N import (compare orange dashed and solid gray curves in Figure 3A). A similar effect is obtained by increasing microbial N recycling—stronger N recycling reduces N demand from external sources, thus lowering the N import/release curves (compare blue dashed and solid gray curves in Figure 3A). Despite a similar overall effect on the litter N peak, the three N limitation responses result in different shapes of the N import/release curves (compare dashed curves with the same thickness in Figure 3A). Most notable is the occurrence of a more pronounced, but earlier N peak when N is preferentially acquired (green curves).
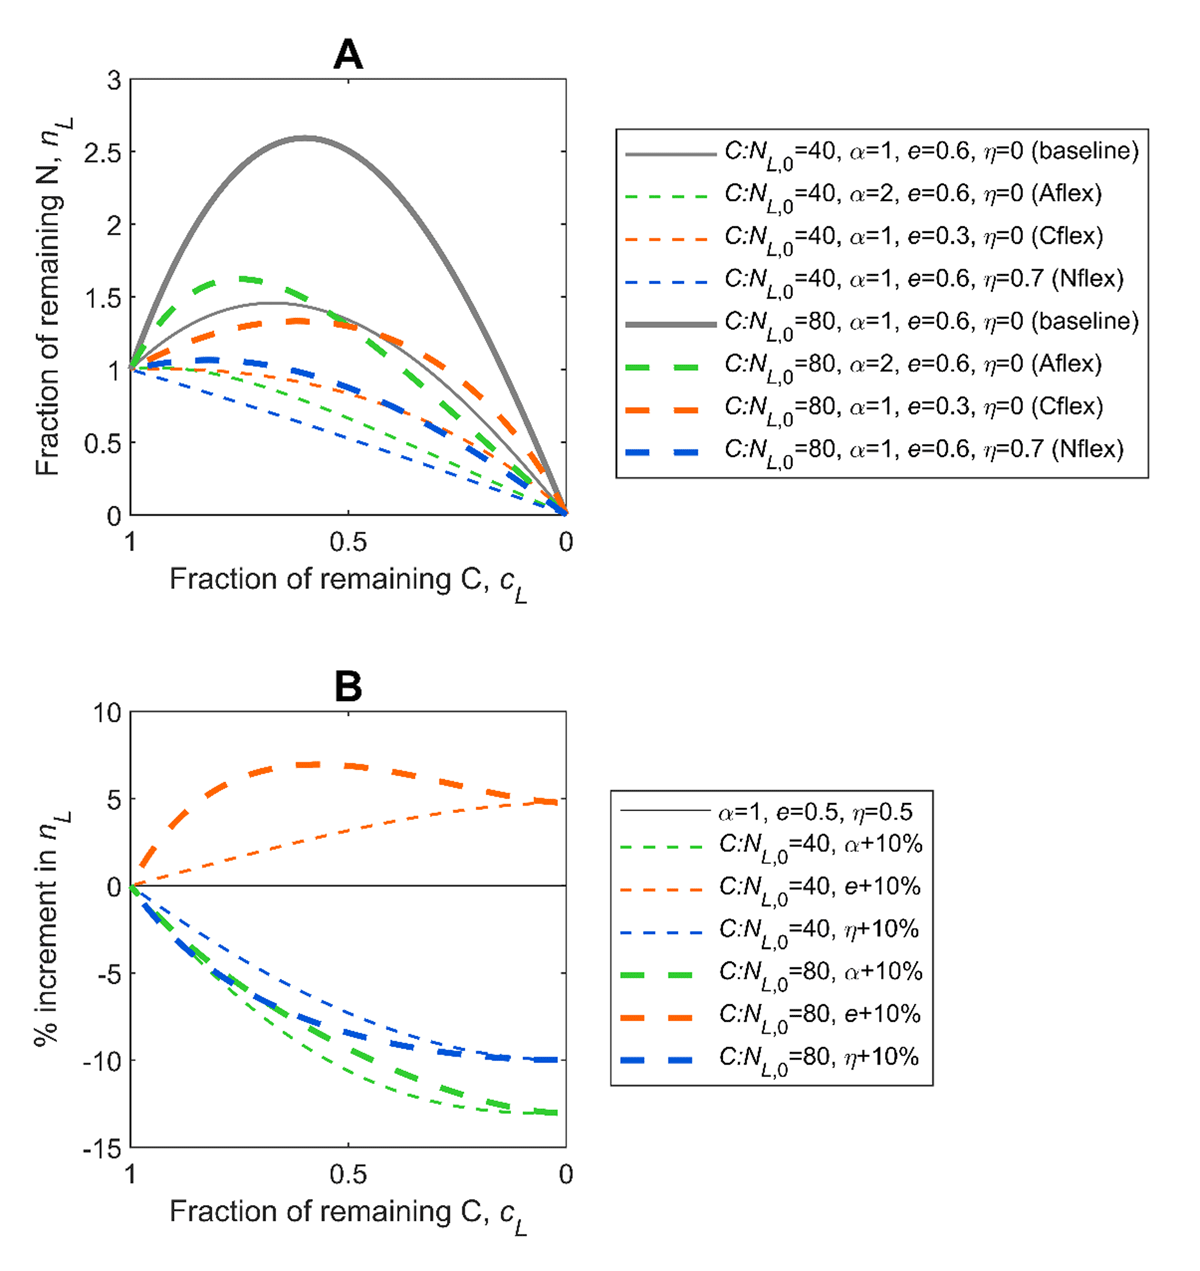
Figure 3
Effect of microbial traits on N import/release curves. (A) Fraction of initial litter N (nL) as a function of the fraction of initial litter C (cL), as predicted by models with time-invariant traits for different values of initial litter C:N ratio (C:NL,0 = 1/rL,0 in the model equations), preferential N acquisition (α), C-use efficiency (CUE, e), and N recycling efficiency (η). The gray curves are drawn assuming no preferential N acquisition, maximum CUE, and no N recycling, and serve as baselines to visualize the effect of flexible α, e, and η. (B) Sensitivity of nL to a 10% increase in α, e, and η from α = 1, e = 0.5, and η = 0.5, for different C:NL,0. In both panels, time progresses from left to right as cL decreases.
Consistent with the differences shown in Figure 3A, an increase in preferential acquisition of N or N recycling causes a decrease in the predicted fraction of the initial litter N (green and blue curves are negative in Figure 3B), whereas an increase in CUE promotes N import (orange curve in positive in Figure 3B). A 10% relative change in α, e, and η causes a 5%–15% change in nL, indicating that these three parameters have similarly strong effects on the predicted fraction of the initial litter N.
3.2 Model fitting and performance
Figure 4A shows an example of model fitting to data on remaining litter N and C. In this particular example, net N import occurred at the beginning of decomposition (when the fraction of remaining C was close to one), as apparent from values of nL larger than one. This N import phase is often observed in litter decomposition studies (Moore et al., 2006; Parton et al., 2007; Spohn & Berg, 2023). N import continued until about 40% of the litter C had been lost. This specific example highlights contrasting modeled N import/release curves depending on the chosen model variant. When fitting the preferential N acquisition coefficient (Aflex and Adyn), the N peak occurred too early and N release in the later phase of decomposition was overestimated (green curves in Figure 4A). In models where only e was estimated and η = 0 (Cflex and Cdyn), e remained low (~0.2, see orange curves in Figure 4C). This means that low CUE allows microorganisms to reduce their N demand, resulting in relatively low N import. The same effect was obtained through high η and high e in models where η was estimated from the data (Nflex and Ndyn; blue curves in Figure 4A). Thus, high η and low e have complementary roles in lowering the microbial demand for external N, while flexible N acquisition alone does not explain the observed N import/release patterns well.
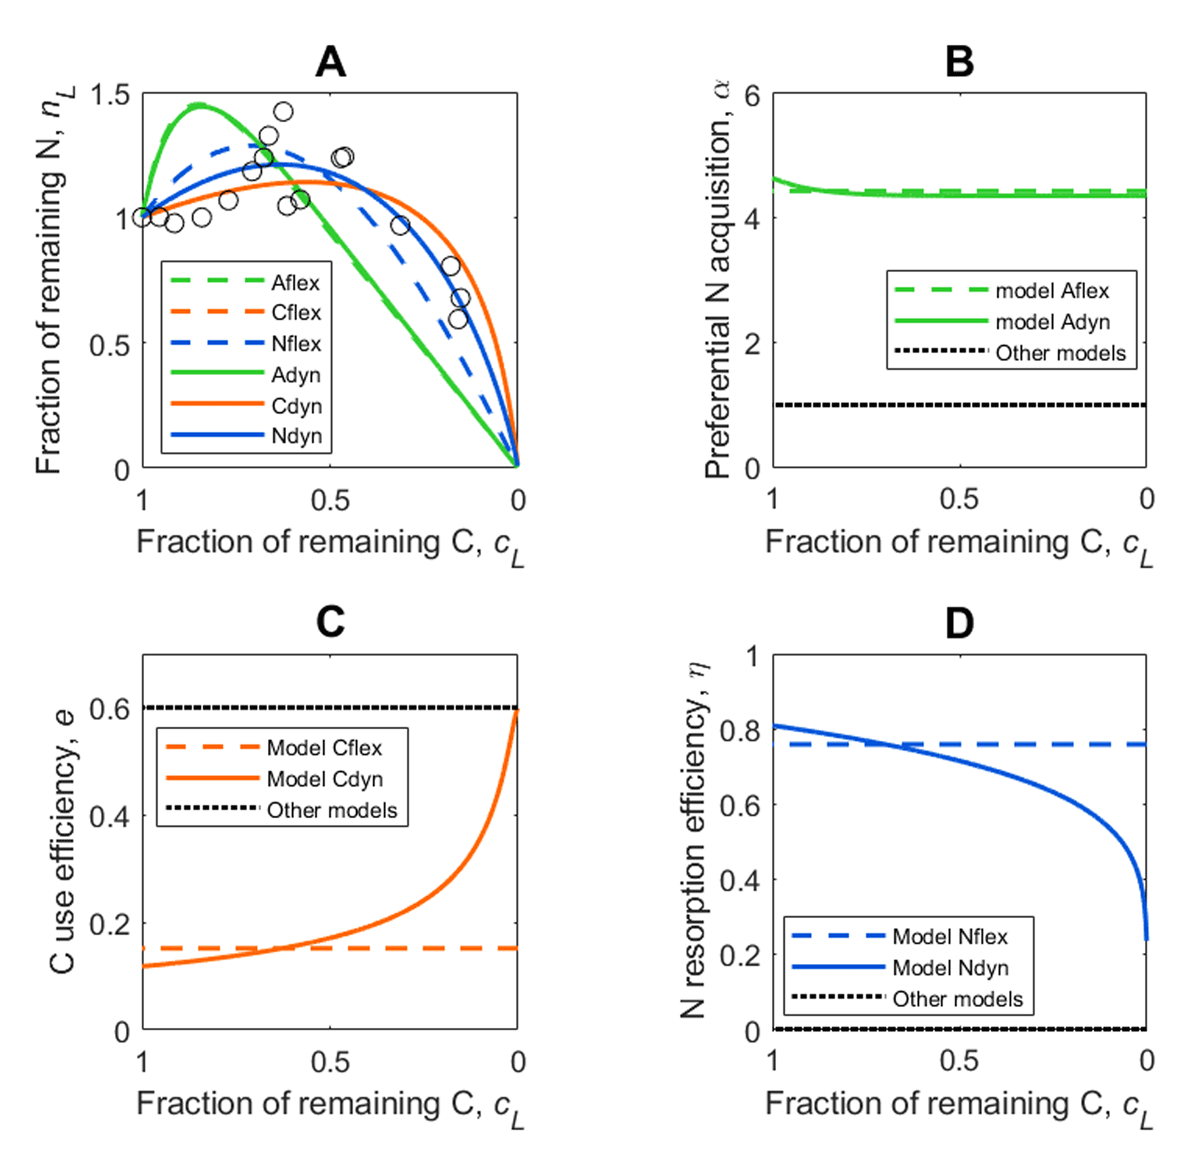
Figure 4
Example of N import/release data fitting with the six model variants (Table 2). (A) fraction of initial litter N (nL) modeled as a function of fraction of initial litter C (cL); (B) preferential N acquisition coefficient (α), (C) microbial C-use efficiency (e), and (D) N recycling efficiency (η) as a function of cL. Open circles indicate data for Pinus sylvestris from Melillo et al. (1989). In Figure 4A, the trajectories of models Cflex and Ndyn overlap so that the orange solid and dashed curves cannot be distinguished. In all panels, time progresses from left to right as cL decreases.
In models Adyn, Cdyn, and Ndyn we assumed that microbial traits could vary during decomposition. While we imposed linear relations between traits and litter N:C ratio, the (hypothetical) values for litter without N were estimated from the data, resulting in different relations between α, e, or η and the fraction of remaining litter C. In model Cdyn, e increased during decomposition (solid orange curve in Figure 4C), whereas in model Ndyn η decreased (solid blue curve in Figure 4D). In contrast, preferential N acquisition remained high throughout decomposition (green solid curve in Figure 4B), leading to a persistent (and unrealistic) high litter C:N (shallow slope of the green curves in Figure 4A indicates low N:C in the late decomposition phase).
Fitting of the N import/release curves to all the litter N and C data led to a range of model performances. Overall, prediction errors were larger at the beginning of decomposition, especially when N accumulated in the litter, and much lower when the fraction of remaining N approached zero (Figure S1). This error structure indicates heteroscedasticity, but it should be noted that the model is constrained at cL = 1, when nL(1) = 1, so it cannot capture rapid variations in remaining N induced by relatively large measurement errors near cL ≈ 1. Generally, the RMSE were low (indicating a good fit) and around 0.1 for models where e or η were fitted, whereas they were notably higher (indicating a bad fit) when fitting α (Figure 5A). When comparing models with time-invariant parameters, model Cflex had the best performance in ~60% of the datasets, whereas among models with dynamic parameters Ndyn performed best in ~50% of the datasets (Figure 5B). These results demonstrate that patterns in the data are best captured by flexible CUE across litter types (model Cflex), or flexible N recycling efficiency across litter types when allowed to decrease as decomposition progresses (model Ndyn). It is important to recall that these two best-performing models are mathematically equivalent, suggesting that it is a single model structure (with contrasting interpretation of the meaning of its parameters) that captures most of the variation in the litter decomposition data.
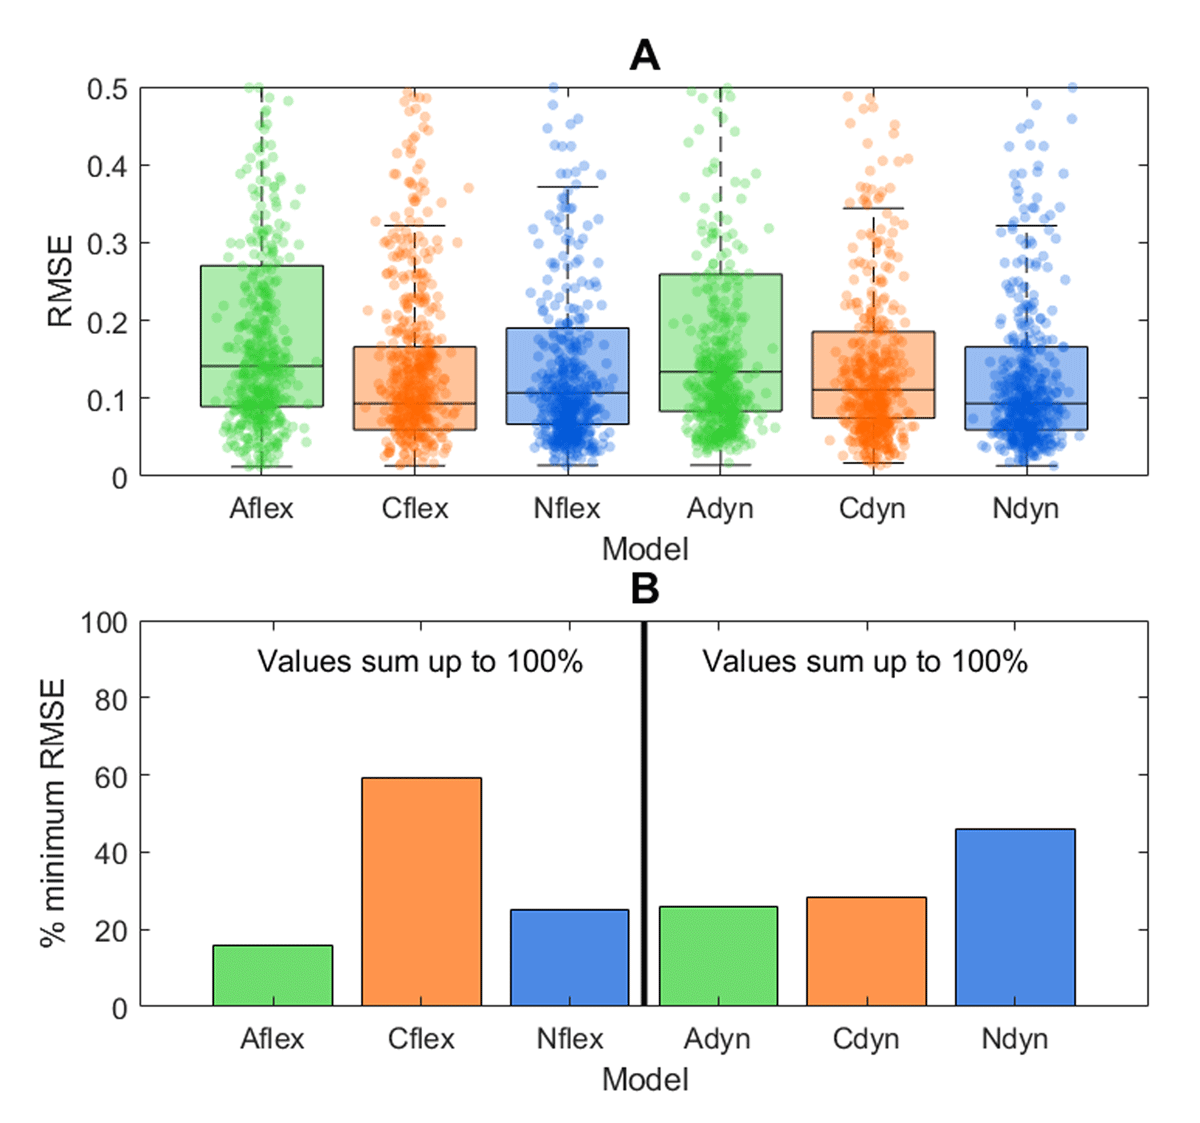
Figure 5
Comparison of model performances. (A) distributions of root mean square errors (RMSE) for the fractions of initial litter N (low values imply good fit) and (B) percentage of the datasets in which each model attains the minimum RMSE (among the different models assuming time-invariant traits (left of the vertical line) or dynamic traits (right of the vertical line). In Figure 5A, boxes show the median and quartiles, the whiskers indicate the extremes within 1.5 times the interquartile range, and dots are all RMSE values (not shown if higher than 0.5).
3.3 Relations between litter C:N ratio and preferential N acquisition, C-use, and N recycling efficiencies
Climate was not a good a predictor of the microbial traits except for significant but minor positive effect of mean annual temperature on α and α0, and marginally significant effects on e0 (Figure 6). In contrast, litter chemical properties were good predictors of the N limitation responses. Specifically, initial lignin content and C:N were positively correlated with N acquisition and recycling traits, but negatively correlated with CUE (Figure 6). Lacking significant climatic correlations, in the following we focus on relationships between microbial traits and litter chemistry.
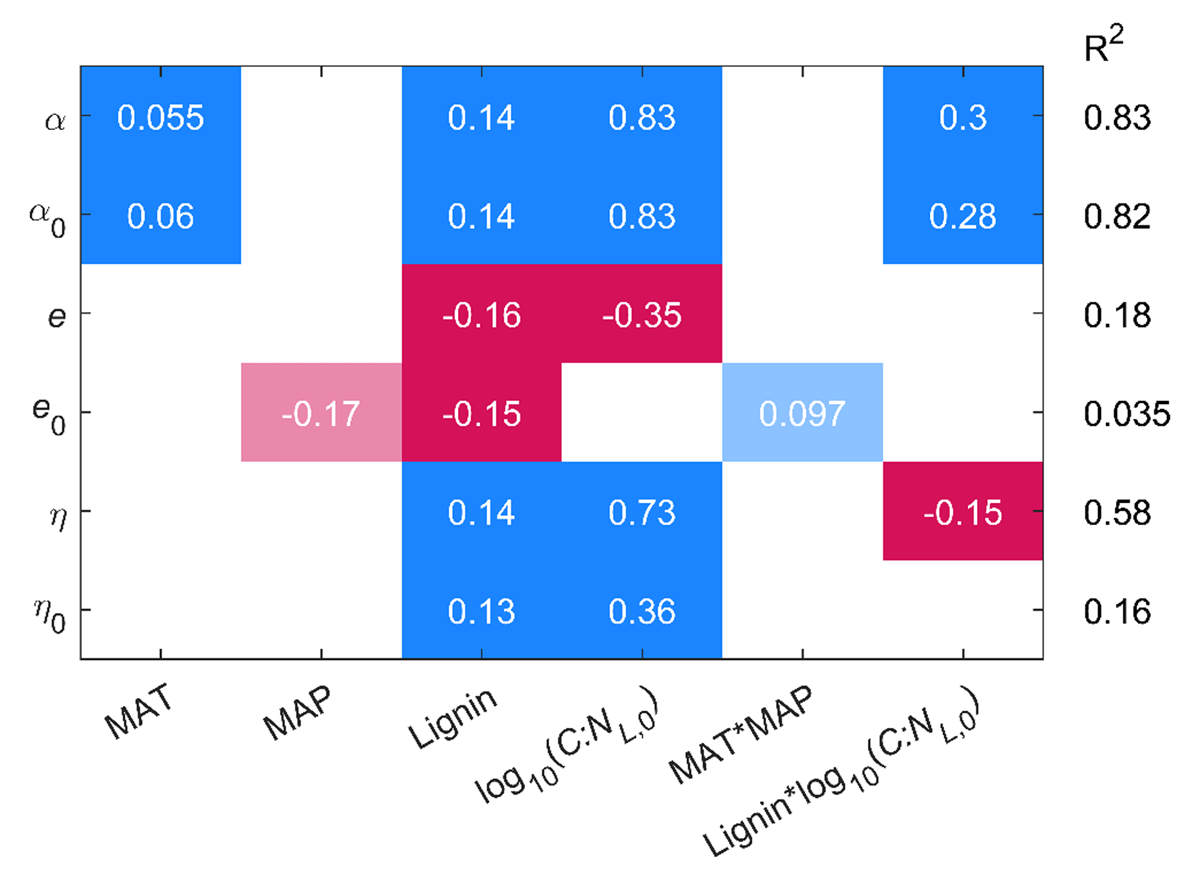
Figure 6
Chemical and climatic drivers of microbial traits. Results of linear models to predict microbial traits (preferential N acquisition α and α0, C use efficiency e and e0, and N recycling efficiency η and η0) as a function of mean annual temperature (MAT), mean annual precipitation (MAP), initial lignin content, initial litter C:N ratio (C:NL,0), and interactions between the two climatic factors and the two chemical characteristics. Each value represents a model coefficient (all variables are normalized), with colors indicating the direction of the effect (blue: positive, red: negative) and shading indicating the significance of the effect (dark colors: significant, p < 0.05; light colors: marginally significant, 0.05 < p <0.1; blank: not significant). On the right of the table the coefficients of determination (R2) for each model are reported.
Proportionally more N was acquired in N-poor litter, as indicated by increasing α with wider initial C:N ratio (Figure 7A). The estimated C-use efficiency decreased with increasing initial litter C:N when N recycling was neglected (Figure 7C). If instead N recycling efficiency was estimated at fixed CUE, η increased with increasing initial litter C:N (Figure 7E). In the models with dynamic traits, the parameters representing preferential N acquisition, C use, and N recycling efficiencies at zero litter N (α0, e0, and η0) followed similar patterns as the corresponding time invariant traits (Figure 7B, 7D, and 7F). The CUE at zero litter N in model Cdyn decreased with increasing initial litter C:N, but a large fraction of these CUE values were at their lower boundary, indicating that the model was not flexible enough to capture patterns in the data with physically meaningful parameter values (Figure 7D).
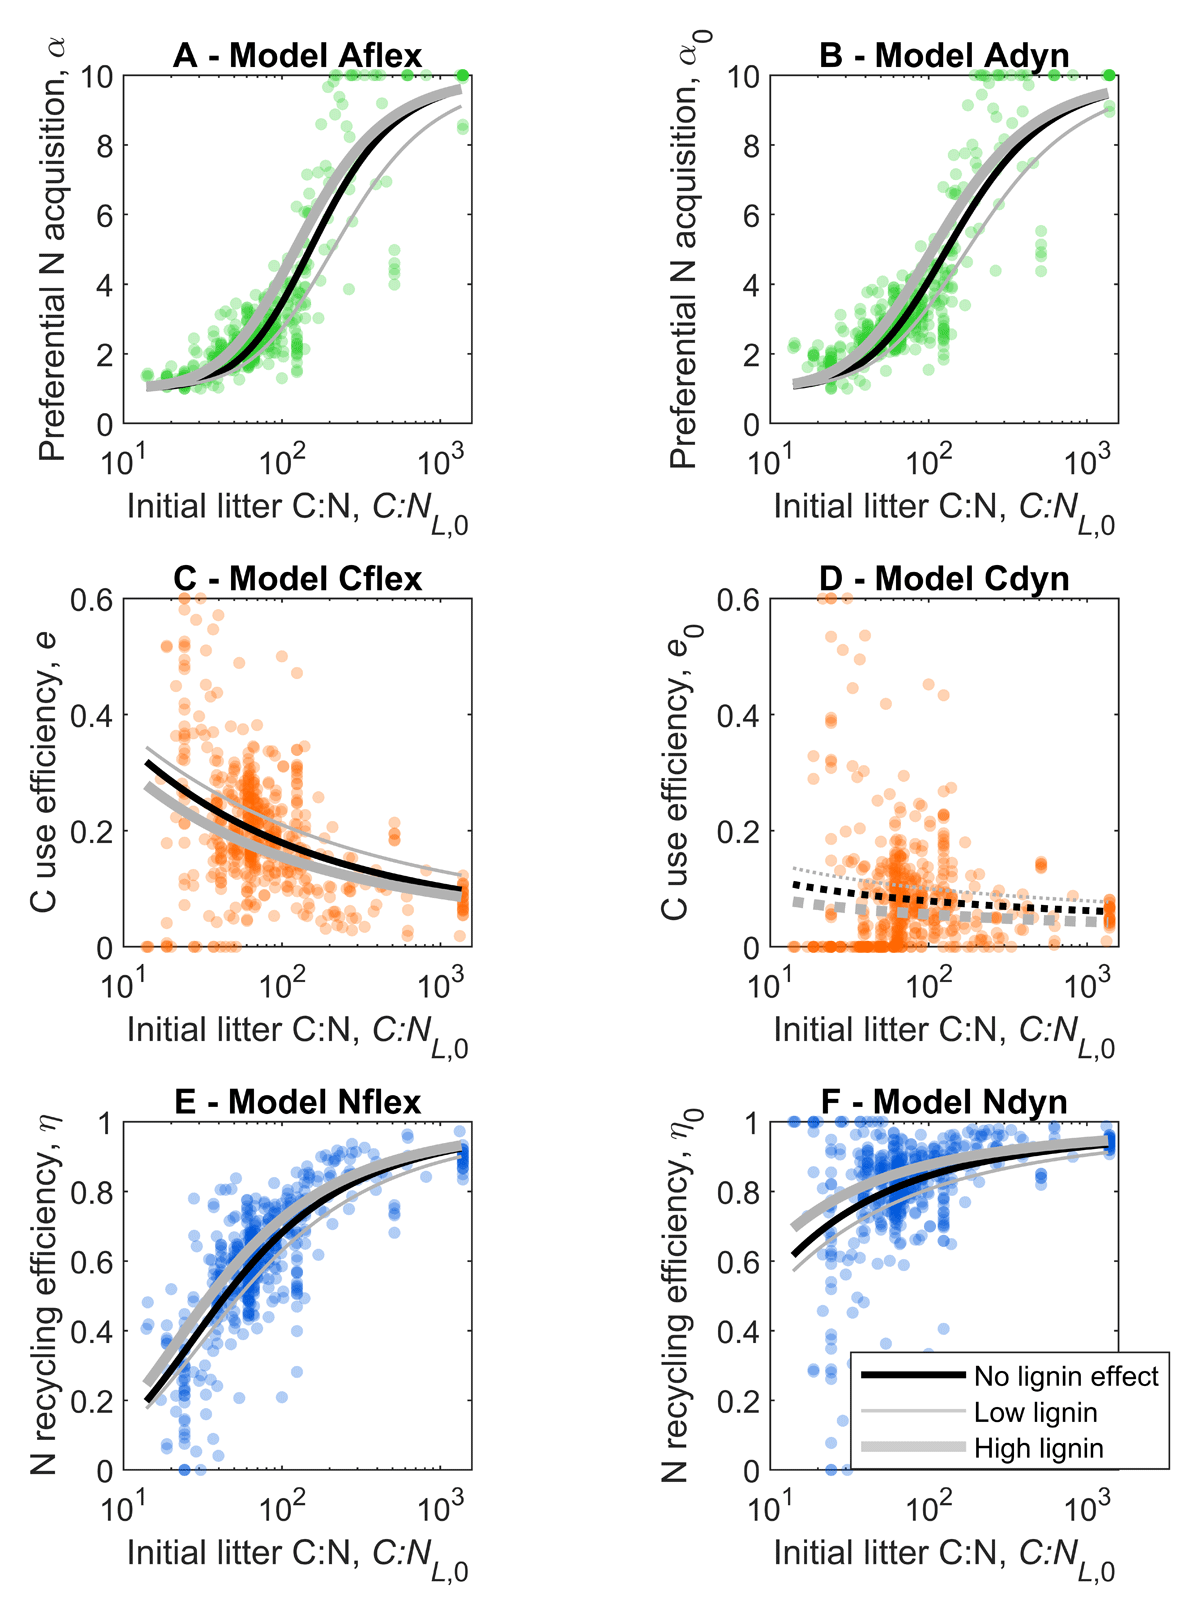
Figure 7
Litter chemistry effects on microbial traits. Model estimates of preferential N acquisition coefficient (α), C-use efficiency (CUE, e), N recycling efficiency (η) in the six model variants, as a function of the litter initial C:N ratio (C:NL,0): (A) α in model Aflex, (B) preferential N acquisition at zero litter N (α0) in model Adyn, (C) e in model Cflex, (D) CUE at zero litter N (e0) in model Cdyn, (E) η in model Nflex, (F) N recycling efficiency at zero litter N (η0) in model Ndyn. Curves are least square regressions of sigmoidal functions fitted to the estimated parameters [Eqs. (15)–(17); black: no lignin effects (full dataset), gray: including lignin effects (only data from sources reporting initial lignin content)]; dotted curves indicate that the trend when varying C:NL,0 is not significant (i.e., parameter a in the sigmoidal curve is not significantly different from zero). Gray curves are drawn at initial lignin contents corresponding to the 5th (labeled ‘Low’) and 95th percentiles (‘High’) of all lignin content data.
Initial lignin contents modulated the trait-litter C:N relations (compare gray and black curves in Figure 7). At any given initial litter C:N, higher initial lignin promoted the preferential acquisition of N (Figure 7A and 7B), decreased CUE (Figure 7C and 7D), and promoted N recycling (Figure 7E and 7F).
In models Adyn, Cdyn, and Ndyn, we imposed increasing trends for α and η, and a decreasing trend for e with increasing litter C:N, so the general shape of the relations of these traits with current litter C:N in Figure 8 are not surprising. In general, the temporal trajectories of these traits as litter decomposes and the C:N ratio is reduced followed the same pattern emerging across litter types with varying initial C:N. Notably, the variation of η0 was minor compared to that of η, indicating that our assumed relation between η and current litter C:N can capture most of the trait variation both across litter types and through time.
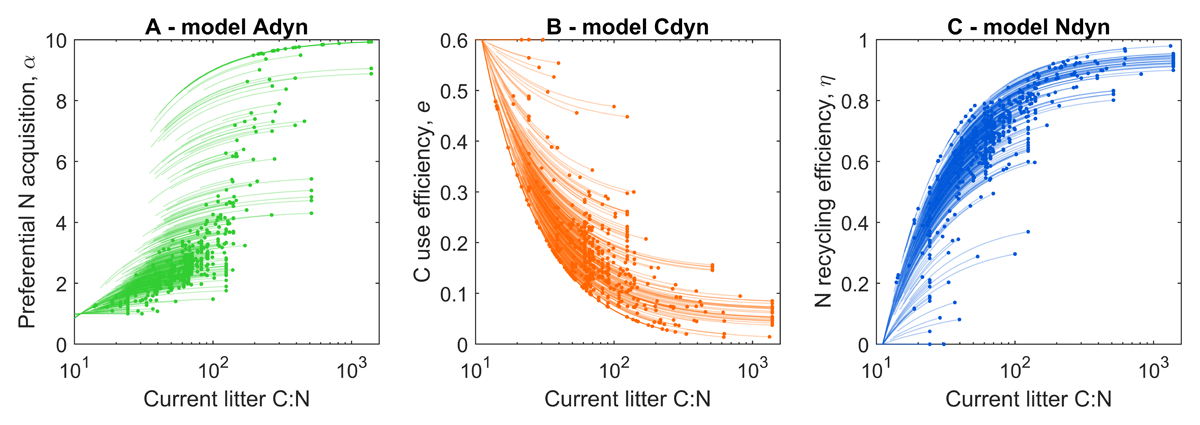
Figure 8
Temporal variations in microbial traits. Temporal changes in preferential N acquisition coefficient (α), C-use efficiency (e), and N recycling efficiency (η) in the three model variants that assume microbial traits can vary during decomposition, shown as a function of the current litter C:N ratio: (A) α in model Adyn, (B) e in model Cdyn, and (C) η in model Ndyn. Each curve represents a trajectory starting from the initial condition (indicated by a dot) and moving toward the left, as time progresses and litter C:N decreases.
3.4 Long-term mean C-use efficiency across model variants
The mean CUE in models where N acquisition or recycling were regulated is equal to the maximum CUE (emax) by default, and thus always higher than in models Cflex and Cdyn. Between the latter two models, the mean CUE calculated for Cdyn was higher than for Cflex (Figure 9A). Moreover, the mean CUE calculated using model Cdyn decreased with increasing initial litter C:N (Figure 9B)—similar to e and e0 (Figure 7C and 7D). Overall, the comparison of mean CUE among models implies that flexible N acquisition or recycling allows microorganisms to use a larger share of the residue C for growth compared to CUE regulation.
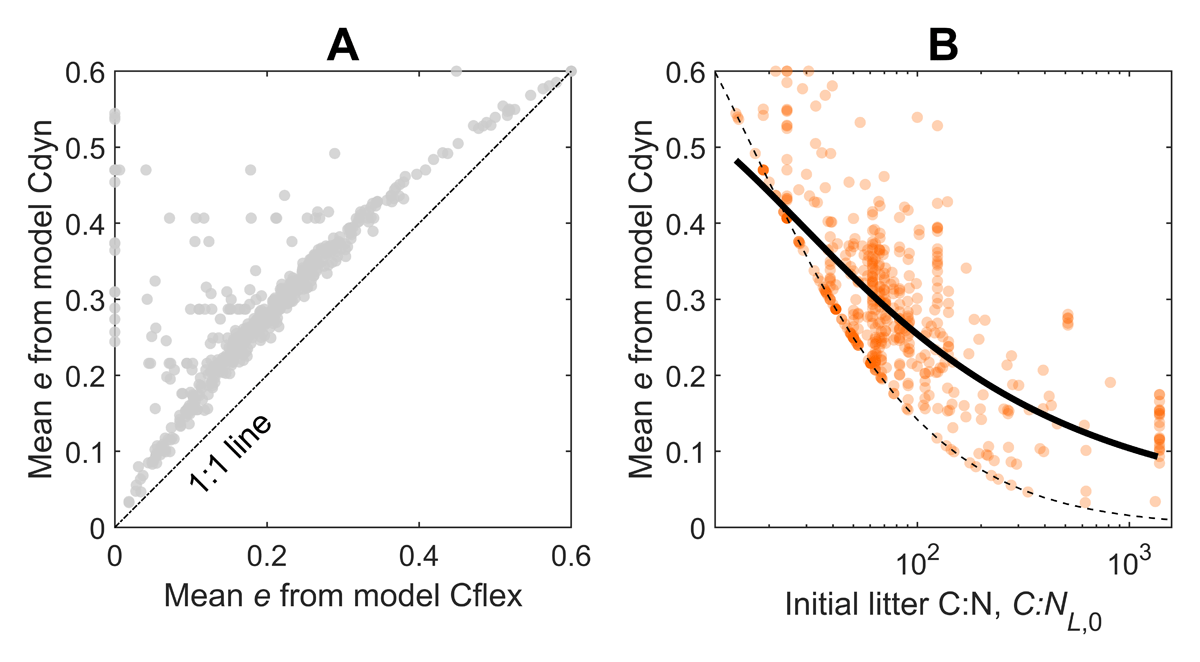
Figure 9
Mean C-use efficiencies. (A) comparisons of mean C-use efficiencies [ē from Eq. (20)] between models Cflex and Cdyn. (B) relation between ē and the initial litter C:N (C:NL,0) for model Cdyn. In Figure 9A, values of ē above the 1:1 line indicate that microbes convert more litter C into biomass than in model Cflex. In Figure 9B, the solid black curve is the least square regression of a sigmoidal function fitted to ē [Eq. (16); the trend when varying C:NL,0 is significant] and the thin dashed curve represents the limiting case of e0 = 0. Note that for all other model variants except Cdyn, ē = e or ē = emax, so relations between ē and C:NL,0 are the same already shown in Figure 7.
4. Discussion
4.1 Contrasting theories on microbial responses to nitrogen limitation
Previous work on litter decomposition had concluded that CUE is lower in litter with high initial C:N ratio (Manzoni, 2017; Manzoni et al., 2010), but such work was based on a model that did not consider preferential N acquisition or N recycling (i.e., models Cflex and Cdyn), so that all variation in litter N was attributed to changes in CUE. To fill this gap, here we considered N acquisition and N recycling as alternative responses to N limitation. Regulation of N acquisition alone did not explain well the N import/release data (poor fitting, Figure 5), even though theory predicts that the most limiting element should be preferentially targeted by microorganisms (Averill, 2014; Wutzler et al., 2017). Given these theoretical expectations, the low predictive power of our models based on regulation of N acquisition was surprising. Empirical evidence of N acquisition regulation is not entirely consistent. The ratio of C-acquiring to N-acquiring enzyme activities decreased slightly with increasing soil C:N ratio (more so when labile C was added) in one study (Karhu et al., 2022), but in another it did not respond to N addition, suggesting that the expression of individual enzymes might not only be upregulated in response to a specific resource limitation (Mori et al., 2021).
Our model results show that regulation of N recycling can be as effective as CUE regulation to compensate for stoichiometric imbalances, as indicated by the comparable fitting performance of models based on these two mechanisms (Figure 5). This result might explain why CUE regulation is not always detected despite wide stoichiometric imbalances (Hasby et al., 2021), and suggests that we should interpret previous results focusing on CUE regulation alone with caution. However, there is also direct evidence of reduced CUE at high substrate C to nutrient ratio in litter (Lashermes et al., 2016; Voriskova et al., 2011), soil (Takriti et al., 2018; Z. M. Lee & Schmidt, 2014), and aquatic systems (del Giorgio & Cole, 1998; del Giorgio & Newell, 2012; Godwin & Cotner, 2015). How can we reconcile this perspective on N recycling as a major avenue of stoichiometric regulation, with the documented decrease in CUE as substrate C to nutrient ratio widens? The answer to this question might be linked to the type of decomposers and how they interact with their environment.
N recycling can occur within a fungal mycelium, in unicellular organisms, or within communities with microbial cells in close proximity. Within a mycelium, growth of hyphal tips at the mycelial front may be supported by reallocation of nutrients from older parts of the mycelium (Boberg et al., 2014; Falconer et al., 2005; Fricker et al., 2017; Tlalka et al., 2002; Wells, Harris, & Boddy, 1998), depleting the nutrient content of senescent mycelium (compartmental senescence, Camenzind et al., 2023). In Ghersheen et al. (2025), a mathematical model featured this mechanism by explicitly incorporating fungal physiological responses to N limitation during litter decomposition. Under low N availability, the model describes an increase in the proportion of vacuolised mycelium and accumulation of N in slowly decomposing necromass, thereby conserving internal N and buffering stoichiometric imbalances through vacuolization, without invoking CUE regulation. This approach functionally resembles the flexible N recycling response in our model variant Nflex, where N recycling efficiency increases in response to nutrient limitation, but it also provides a mechanistic basis by linking N retention and recycling directly to fungal growth traits and mycelial turnover.
Bacteria can recycle N within their cells by reusing amino acids that have already been used for protein synthesis to synthesize new proteins, instead of releasing old N and forming proteins from newly acquired N. This internal reuse of N does not alter the N content of the microbial necromass, and so cannot be captured by the parameter η in our model. In addition, in communities of unicellular microorganisms, N released at senescence can be rapidly reused by active cells in the community without being returned to the substrate pool. For example, nutrients contained in bacterial cell walls and intracellular enzymes of dying dells are efficiently recycled in the growing cells (Hartl et al., 2017; Mayer et al., 2019). Therefore, for a N recycling mechanism to promote N retention when necromass is formed, we need either multicellular organisms that can translocate N within their bodies (i.e., fungi), or tight interactions among bacterial cells within colonies or biofilms.
We assumed that different microbial responses to N limitation are mutually exclusive, but it is likely they coexist. For example, bacteria can both increase their C:P ratio and reduce their CUE as the C:P supply ratio is increased (Godwin & Cotner, 2015). From a statistical perspective, it is difficult to determine the relative contributions of combined responses because they give rise to similar decomposition patterns (Figure 3A), creating an equifinality problem. Ideally, one could constrain some of the model parameters using functional trait observations and fit the remaining parameters to infer which responses are expressed and to what extent. However, such detailed functional trait data is too scarce for this approach to work. Given these limitations, we can only discuss which response is more likely to be dominant based on the fitting performance of the different model variants.
4.2 More efficient nitrogen recycling under nitrogen limitation
In our model variants where N recycling was flexible (Nflex and Ndyn) η increased when N was scarce. In particular, η from model Nflex increased with increasing initial litter C:N (Figure 7E), allowing excellent model fit to the data without CUE regulation. In model Ndyn, η was assumed to decrease during decomposition, as litter C:N decreased. While this response within a litter cohort was hardwired in the model, we did not constrain the value of η at the beginning of decomposition (technically, the value of η in a hypothetical litter without N). Notably, we found that this initial N recycling was higher in litter with higher initial C:N (Figure 7F), suggesting that microbial communities colonizing N-poor litter have higher N recycling capacity.
Evidence from a field study in a boreal forest supports this conclusion. Fungal mycelium was collected using sand-filled ingrowth bags inserted into the organic topsoil (Högberg et al., 2021). The C:N of the mycelium decreased from almost 40 to 10 across a local gradient of increasing N availability, and since a large proportion of the collected mycelium may be expected to be dead (with higher C:N than the live biomass), a major contribution of recycling of N from senescent mycelium seems likely. When easily available N (methylurea) was added to the ingrowth bags, mycelial C:N remained low regardless of soil N availability, suggesting that in the presence of abundant external N, internal N recycling might be less necessary. This evidence is suggestive of putative mechanisms, but to our knowledge there is no direct evidence of regulation of N recycling in response to changes in substrate C:N ratio. Such evidence would validate our interpretation of the patterns in η that we found.
4.3 Effects of nitrogen limitation response on microbial growth
Microbial CUE integrates numerous metabolic processes and trade-offs in a single macro-trait, and it has been argued that evolutionary pressure acting on these processes should lead to CUE values that maximize microbial growth (Allison, 2014; Roller & Schmidt, 2015; Westerhoff, Hellingwerf, & Vandam, 1983). In this light, we could expect that CUE varies along gradients of nutrient availability to ensure continued growth despite imbalanced resources (Sterner & Elser, 2002). In fact, low nutrient content in the substrates requires CUE to be low, otherwise N demand for growth would be too large compared to the amount provided by the external environment (Figure 1). Indeed, CUE of microorganisms and animals in both terrestrial and aquatic systems decreases with increasing substrate C:N and C:P ratios and increases when mineral N and P are added to nutrient limited systems, as expected from a CUE optimization hypothesis (Manzoni et al., 2017). Our models in which CUE was flexible (Cflex and Cdyn) showed a clear declining trend of CUE as the initial litter C:N increased (Figure 7C and 7D), confirming previous findings (Manzoni et al., 2010; Manzoni et al. 2017).
In addition to CUE downregulation at high litter C:N, other traits could also vary and allow microorganisms to grow even more than by regulating CUE alone. Indeed, reducing CUE under N limitation leads to large losses of C that could sustain growth at a later stage when N becomes available, or meet the C demand from the growing mycelium (Boberg et al., 2010). N recycling under N limitation (as shown in Figure 8C) could sustain growth without wasteful expenditure of C. With flexible N recycling, microbial communities can achieve a much higher long-term mean CUE than without N recycling. Mean CUE is the amount of C used for growth throughout the decomposition process and can thus be interpreted as a measure of the overall microbial capacity to convert litter C into biomass [Eq. (18)]. The highest mean CUE was attained in the models in which N recycling was regulated, because in those models CUE was always equal to the maximum value emax. Therefore, we propose that N recycling could be optimized along nutrient availability gradients, as this allows higher growth than CUE regulation alone.
CUE regulation has an obvious opportunity cost, as lower CUE implies lower growth, but also regulation of N recycling can have direct and opportunity costs. Direct costs could be related to N transport within the mycelium, but such costs are probably low. An indirect opportunity costs arises because recycling N within the mycelium is associated with vacuolization of the older sections of the mycelium, thus decreasing the proportion of mycelium that is actively engaged in resource acquisition. Therefore, it is reasonable to expect that these costs would lower CUE when N recycling occurs, due to the maintenance respiration of less active mycelium. We have not explored these trade-offs in a systematic way, but we tested an additional model variant in which CUE decreases with increasing N recycling efficiency. Such a model performed as well as those in which N recycling alone is regulated (results not shown), while also allowing reasonably high mean CUE. Based on these results, we can speculate that N recycling might still be advantageous to sustain growth despite its C cost, but a more detailed quantification of the C costs of N recycling would be needed to substantiate this argument.
4.4 Microbial traits are largely independent of climatic and soil conditions, but vary with litter lignin
The model estimates of microbial traits varied with initial litter C:N ratio but were largely independent of climatic conditions. Litterbags were incubated under a wide range of conditions: mean annual temperature between –10°C and 27°C and mean annual precipitation between 150 and more than 10,000 mm y–1. With such a wide range, climatic effects on microbial traits should have been detectable, but the model only predicts minor increases in preferential N acquisition in warmer climates (Figure 6). In particular, estimated CUE was independent of climate, confirming previous results using the same method (Manzoni, 2017; Manzoni et al., 2010).
It could be argued that including leaching from the litterbags in the models could have altered this result. To understand this argument, we can assume that leaching occurs continuously, removing a fraction λ of the decomposed organic matter. Mathematically, this assumption leads to N import/release curves where CUE always multiplies 1–λ (Eq. (6) in Manzoni et al., 2010). This means that our estimates of CUE should be corrected by a factor to be unbiased. For example, a short-term laboratory experiment showed that ≈ 20% of C loss during litter decomposition can be attributed to leaching (Hansson et al., 2010), so that λ ≈ 0.11 if CUE ≈ 0.5. In this example, our CUE estimates would need to be corrected by a factor 1.12. While this model including leaching would not allow independent estimation of CUE and λ because they always appear as a product (again an equifinality issue), we can speculate on how CUE would change if λ was affected by climatic conditions. We could expect leaching to be higher in wet conditions, so that the corrected CUE would also be higher. Therefore, when accounting for leaching effects, we would find a positive effect of precipitation on CUE, though the quantitative importance of such a trend is hard to assess without reliable estimates of λ across our datasets.
Independent empirical evidence supports the conclusion that CUE is not affected by experimental warming when measured at the same temperature as in the field (Zhang et al., 2024). A global CUE meta-analysis also showed that climatic effects on CUE are less important than those on microbial growth rate (Hu et al., 2025), indicating that temperature and water availability affect the rates of decomposition (e.g., Parton et al., 2007) and microbial metabolism (as expected), but not C allocation between growth and respiration (Spohn, 2016). In contrast, soil CUE calculated from modeled C fluxes at the global scale declines with mean annual temperature (Tao et al., 2023). While it is possible that climatic controls on soil and litter CUE differ, here we conclude that microbial traits modulating C and N relations during litter decomposition are largely independent of climate.
In addition to climatic conditions, also soil N availability could affect microbial responses to N-poor litter. High N availability could in fact allow higher rates of N import in the litter layer, reducing the need to regulate N acquisition, CUE or N recycling. For example, inorganic nutrients increase CUE in systems that were originally nutrient limited (Manzoni et al., 2017). Indeed, the litter C:N at which N release starts (threshold element ratio, TER) tends to increase with increasing soil C:N (Ågren et al., 2013). In turn, TER is linked to microbial traits, as TER = α/[(1–η)erB] (this relation can be obtained by setting dnL/dcL = 0 in Eq. (11)). Thus, higher TER could indicate higher N acquisition (α is the equation for TER), lower CUE (e), or higher N recycling (η). In contrast to this expectation, in the subset of our dataset including top soil C:N (data from Trofymow & CIDET, 1998), we did not find any significant effects of soil C:N on the microbial traits (results not shown).
Lignin content modulated the strong effect of initial litter C:N on microbial traits—litter with higher lignin content exhibited lower CUE and higher N recycling efficiency (Figure 6). The lower CUE can be explained by the C cost of ligninolysis, mostly due to continuous production of hydrogen peroxide to maintain the functionality of oxidative enzymes (Chakrawal, Lindahl, & Manzoni, 2024; Moorhead et al., 2013 and references therein). Lignin also increases N recycling efficiency, suggesting that it interferes with N acquisition. It is possible that by shielding N-rich compounds, lignin (or its decomposition products as well as other aromatic compounds included in the measured lignin pool) lowers the availability of organic N (Adamczyk et al., 2019), thus triggering more efficient N recycling (Sun et al., 2024). In other words, in lignin-rich litter, microorganisms perceive a higher litter C:N than the actual value and respond accordingly by regulating N recycling.
5. Conclusions
We assessed the responses of microorganisms to N limitation during litter decomposition using a suite of mathematical models in which different parameterizations represented alternative microbial responses. Specifically, we considered preferential N acquisition (enzyme and transporter regulation), flexible CUE, or flexible N recycling efficiency as plausible responses to N limitation. One model structure emerged as the most suitable to describe N import and release during litter decomposition. This model lends itself to two alternative interpretations: either microbial CUE remains stable during decomposition but varies across litter types (in the absence of N recycling), or N recycling decreases during decomposition as litter C:N decreases and it also varies among litter types (with high CUE regardless of N availability). Variations among litter types are driven by the initial litter C:N—CUE is lower and N recycling efficiency is higher in litter with wider initial C:N. Compared to ‘wasteful’ CUE regulation, N recycling allows microorganisms to convert a larger share of litter C and N into biomass, thereby better supporting their long-term growth.
Additional Files
The additional files for this article can be found as follows:
Supplementary Information
Supplementary figures, site and litter chemistry data, and model results. DOI: https://doi.org/10.16993/tellus.4114.s1
Review History
The review history does not have a specific description. DOI: https://doi.org/10.16993/tellus.4114.s2
Data Accessibility Statement
Datasets were obtained from published sources, either digitized or downloaded from open access repository (Harmon, 2013; Hobbie, 2013; Hobbie 2015; B. Wijas et al., 2024), or kindly shared by the authors of the original studies (Carolyn E. Smyth, John A. Trofymow, and Marie Spohn). Site and litter chemistry data are reported in Tables S1 and S2. Microbial traits obtained from model fitting are reported in Table S3.
Acknowledgements
We thank Carolyn E. Smyth and John A. Trofymow (Natural Resources Canada, Canadian Forest Service), and the Canadian Intersite Decomposition Experiment (CIDET) Working Group for sharing litter (from Moore et al., 2006) and wood decomposition data (from Smyth et al., 2016). Significant funding to the Long-Term Ecological Research (LTER) Intersite Fine Litter Decomposition Experiment (LIDET) was provided by the National Science Foundation LTER programme. We also thank Arjun Chakrawal (Pacific Northwest National Laboratory) for help coding the parameter optimization algorithm in Matlab.
Author Contributions
SM collated and analyzed data, developed and implemented the model, and wrote the first draft; all authors contributed to model development, and commented and edited the manuscript.