
Table 1
Comparison of the sample with the population of unemployed person in Croatia.
| Sample | Population of registered unemployed persons | Difference | |
|---|---|---|---|
| N (%) | 533 (100) | 275,838 (100) | |
| Gender, N (%) | |||
| Male | 232 (43.53) | 130,714 (47.39) | χ2 (1, N = 533) = 3.18, p > 0.05 |
| Female | 301 (56.47) | 145,124 (52.61) | |
| Age, N (%) | |||
| <35 years | 339 (63.60) | 99,884 (36.21) | χ2 (2, N = 533) = 183.19, p < 0.001 |
| 35–49 years | 132 (24.77) | 92,658 (33.59) | |
| >49 years | 62 (11.63) | 83,296 (30.20) | |
| Education, N (%) | |||
| Primary school or less | 18 (3.38) | 72,491 (26.28) | χ2 (2, N = 533) = 21.53 p < 0.001 |
| High school | 281 (52.72) | 175,656 (63.68) | |
| University education | 234 (43.90) | 27,691 (10.04) | |
| Length of unemployment, N (%) | |||
| 1 year | 327 (61.35) | 144,568 (52.41) | χ2 (2, N = 533) = 706.56, p < 0.001 |
| 1–3 years | 139 (26.08) | 78,028 (28.29) | |
| >3 years | 67 (12.57) | 53,242 (19.30) | |
Table 2
Means, standard deviations, correlations and scale reliabilities (in the brackets) (N = 533).
| M | SD | 1. | 2. | 3. | 4. | 5. | 6. | 7. | |
|---|---|---|---|---|---|---|---|---|---|
| 1. Gender | – | – | – | ||||||
| 2. Age | 33.80 | 10.29 | –0.07 | – | |||||
| 3. Education | – | – | 0.07 | –0.14** | – | ||||
| 4. Length of unemployment | – | – | –0.02 | 0.26** | –0.16** | – | |||
| 5. Dispositional employability | 3.90 | 0.53 | 0.10* | –0.06 | 0.09* | –0.06 | (0.89) | ||
| 6. Perceived employability | 3.47 | 0.76 | 0.11** | –0.13** | 0.01 | –0.09* | 0.54** | (0.77) | |
| 7. Job search intensity | 2.13 | 0.59 | 0.16** | –0.18** | 0.03 | –0.04 | 0.17** | 0.24** | (0.72) |
[i] Notes: Cronbach’s alpha coefficients are shown in parentheses; *p < 0.05, **p < 0.01; gender (0 = male, 1 = female), age (years), education (0 = up to high school, 1 = university) and length of unemployment (1 = up to one month, 2 = one to six months, 3 = six to twelve months, 4 = one to three years, 5 = more than three years).
Table 3
Fit indices for the measurement and structural models.
| Model | χ2 | df | SRMR | CFI | RMSEA | RMSEA 90% confidence interval | Model comparison | Δχ2 | Δdf |
|---|---|---|---|---|---|---|---|---|---|
| Measurement models | |||||||||
| 1. three-factor model (M1) (DE, PE, JSI) | 448.81*** | 144 | 0.050 | 0.92 | 0.063 | 0.057–0.070 | – | ||
| 2. two-factor model (M2) (DE + PE, JSI) | 1122.55*** | 151 | 0.074 | 0.74 | 0.110 | 0.104–0.116 | M2 vs. M1 | 673.74*** | 7 |
| 3. one-factor model (M3) (DE + PE + JSI) | 1502.69*** | 152 | 0.095 | 0.63 | 0.129 | 0.123–0.135 | M3 vs. M1 | 1053.88*** | 8 |
| 4. seven-factor model (M4) (PE, RES, OC, PRO, CM, WI, JSI) | 419.66*** | 131 | 0.046 | 0.92 | 0.064 | 0.058–0.071 | – | ||
| 5. six-factor model (M5) (PE + RES, OC, PRO, CM, WI, JSI) | 582.23*** | 137 | 0.056 | 0.88 | 0.078 | 0.072–0.085 | M5 vs. M4 | 162.57*** | 6 |
| 6. six-factor model (M6) (PE + OC, RES, PRO, CM, WI, JSI) | 703.61*** | 137 | 0.057 | 0.85 | 0.088 | 0.082–0.095 | M6 vs. M4 | 283.95*** | 6 |
| 7. six-factor model (M7) (PE + WI, OC, RES, PRO, CM, JSI) | 591.82*** | 137 | 0.055 | 0.88 | 0.079 | 0.073–0.086 | M7 vs. M4 | 172.16*** | 6 |
| 8. six-factor model (M8) (PE + CM, OC, RES, PRO, WI, JSI) | 558.36*** | 137 | 0.052 | 0.89 | 0.076 | 0.070–0.083 | M8 vs. M4 | 138.70*** | 6 |
| 9. six-factor model (M9) (PE + PRO, OC, RES, CM, WI, JSI) | 599.15*** | 137 | 0.052 | 0.87 | 0.080 | 0.073–0.086 | M9 vs. M4 | 179.49*** | 6 |
| Structural model | |||||||||
| 10. DE → PE → JSI | 537.03*** | 178 | 0.051 | 0.90 | 0.062 | 0.056–0.068 | |||
[i] Notes: SRMR: standardized root mean square residual; CFI: comparative fit index; RMSEA: root mean square error of approximation; best fitting model in italic; DE: dispositional employability; PE: perceived employability; JSI: job search intensity; OC = openness to changes at work; RE = work and career resilience; PRO = work and career proactivity; CM = career motivation; WI = work identity; ***p < 0.001.
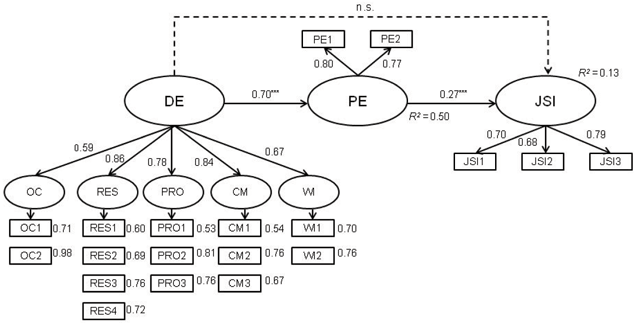
Figure 1
Structural model. Note: Control variables are omitted due to the clarity. All (standardized) factor loadings are statistically significant at p < .001; *** p < .001; DE = dispositional employability; PE = perceived employability; JSI = job search intensity; OC = openness to changes at work; RE = work and career resilience; PRO = work and career proactivity; CM = career motivation; WI = work identity.
Table 4
Results of the bootstrap analysis.
| Bootstrapping BC 95% CI | ||||||||
|---|---|---|---|---|---|---|---|---|
| Unstandardized estimates | Standardized estimates | Lower | Upper | |||||
| Total effect | ||||||||
| DE → JSI | 0.21*** | 0.19 | 0.10 | 0.28 | ||||
| Direct effects | ||||||||
| DE → PE | 0.53*** | 0.70 | 0.61 | 0.78 | ||||
| PE → JSI | 0.39*** | 0.27 | 0.15 | 0.38 | ||||
| DE → JSI | 0.00n.s. | 0.00 | 0.00 | 0.00 | ||||
| Indirect effect | ||||||||
| DE → PE → JSI | 0.21*** | 0.19 | 0.10 | 0.28 | ||||
[i] Notes: DE: dispositional employability; PE: perceived employability; JSI: job search intensity; ***p < 0.001.