
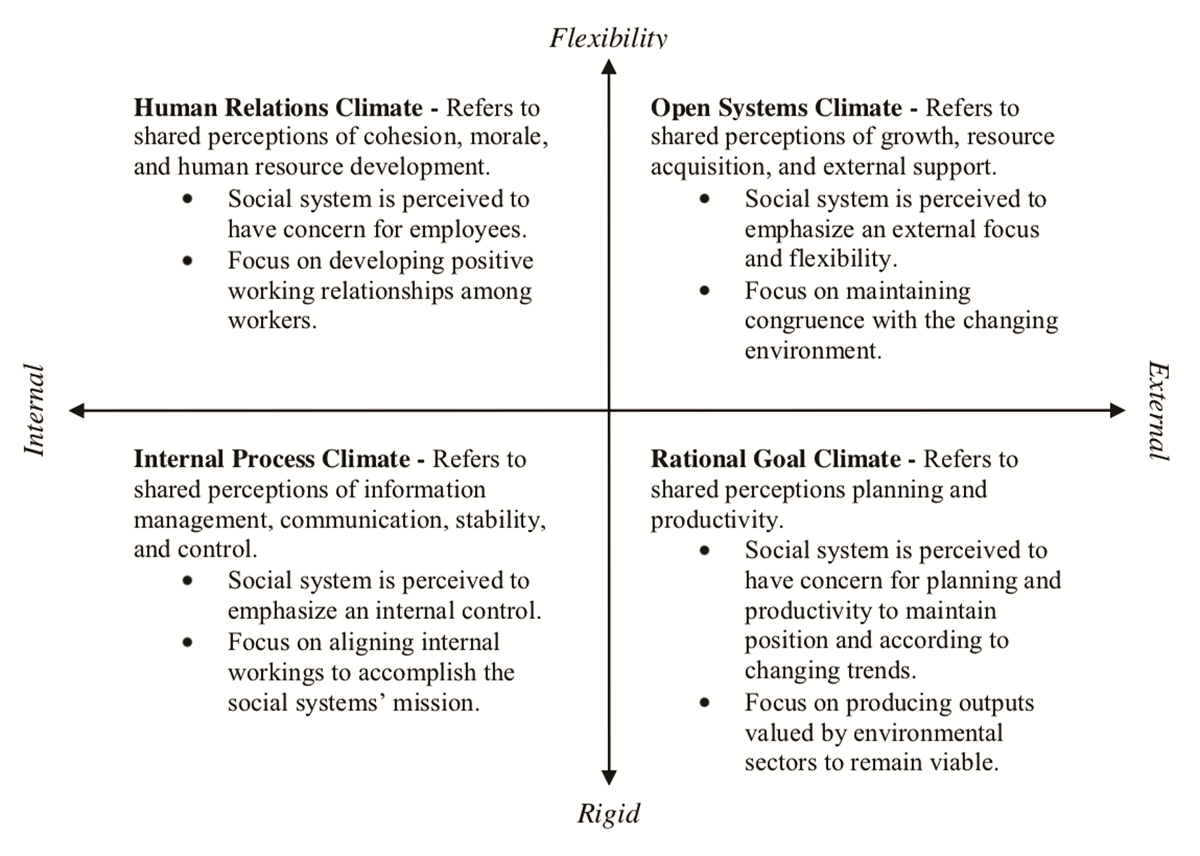
Figure 1
The four climate types of the competing value framework (after Goodman, Zammuto & Gifford, 2001: 60).
Table 1
Goodness of fit statistics for confirmatory factor analyses of measurement models.
| Scale | χ2 | df | CFI | RMSEA [90% CI] | SRMR | BIC | Comments |
|---|---|---|---|---|---|---|---|
| Readiness for change | |||||||
| Original model | 79.00*** | 9 | .942 | .093 [.075, .112] | .047 | 160.640 | |
| Modified model | 22.29*** | 5 | .984 | .062 [.037, .089] | .022 | 90.325 | Item 4 removed |
| Perceived organisational support | |||||||
| Original model | 365.56*** | 20 | .911 | .139 [.126, .151] | .054 | 474.417 | |
| Modified model 1 | 287.49*** | 14 | .922 | .147 [.133, .162] | .051 | 382.783 | Item 7 removed |
| Modified model 2 | 47.83*** | 9 | .987 | .069 [.051, .089] | .021 | 129.476 | Item 7 removed, item 5 and 6 parcelled |
| Human relations climate | |||||||
| Original model | 60.99*** | 9 | .979 | .080 [.062, .100] | .025 | 142.632 | |
| Modified model | 15.45** | 5 | .995 | .048 [.022, .076] | .015 | 83.482 | Item 2 and 3 parcelled |
[i] Note: N = 901; χ2 = chi-square; df = degrees of freedom; CFI = Comparative Fit Index; RMSEA = Root Mean Square Error of Approximation; SRMR = Standardized Root Mean Square; CI = Confidence Interval; BIC = Bayesian Information Criteria.
** p < .01; *** p < .001; Modified model, see comments.
Table 2
Goodness of fit statistics for confirmatory factor analyses of full measurement models.
| Measurement model | χ2 | df | CFI | RMSEA [90% CI] | SRMR | BIC |
|---|---|---|---|---|---|---|
| 1-factor model | 2479.98*** | 104 | .626 | .159 [.054, .165] | .135 | 2697.695 |
| 2-factor uncorrelated model | 1685.45*** | 104 | .751 | .130 [.125, .135] | .141 | 1903.160 |
| 2-factor correlated model | 1600.07*** | 103 | .764 | .127 [.122, .133] | .102 | 1824.582 |
| 3-factor uncorrelated model | 602.21*** | 104 | .922 | .073 [.067, .079] | .174 | 819.925 |
| 3-factor correlated model | 308.53*** | 101 | .967 | .048 [.042, .054] | .044 | 546.649 |
[i] Note: N = 901; χ2 = chi-square; df = degrees of freedom; CFI = Comparative Fit Index; RMSEA = Root Mean Square Error of Approximation; SRMR = Standardized Root Mean Square; CI = confidence interval; BIC = Bayesian Information Criteria.
*** p < .001.
Table 3
Descriptive statistics, reliability and bivariate correlations between main indices.
| Construct | Mean | SD | α | 1. | 2. |
|---|---|---|---|---|---|
| 1. Perceived organizational support | 3.434 | 0.718 | .895 | ||
| 2. Human relations climate | 4.037 | 0.606 | .879 | .505*** | |
| 3. Readiness for change¤ | 3.934 | 0.563 | .764 | .312*** | .231*** |
[i] Note: N = 901; α = Cronbach’s alpha; ¤ Item four removed. *** p < .001.
Table 4
Goodness of fit statistics for structural models with and without modified measurement models.
| Model | χ2 | df | CFI | RMSEA [90% CI] | SRMR | BIC |
|---|---|---|---|---|---|---|
| Original measurement models | ||||||
| Partially mediated model | 848.84*** | 167 | .916 | .067 [.063, .072] | .062 | 1141.385 |
| Fully mediated model | 850.42*** | 168 | .916 | .067 [.063, .072] | .062 | 1136.171 |
| Non-mediated model | 1055.17*** | 168 | .890 | .077 [.072, .081] | .148 | 1340.916 |
| Modified measurement models | ||||||
| Partially mediated model | 308.53*** | 101 | .967 | .048 [.042, .054] | .044 | 546.649 |
| Fully mediated model | 312.51*** | 102 | .967 | .048 [.042, .054] | .046 | 543.825 |
| Non-mediated model | 517.72*** | 102 | .935 | .067 [.062, .073] | .149 | 749.042 |
[i] Note: N = 901; χ2 = chi-square; df = degrees of freedom; CFI = Comparative Fit Index; RMSEA = Root Mean Square Error of Approximation; SRMR = Standardized Root Mean Square; CI = confidence interval. BIC = Bayesian Information Criteria.
*** p < .001
Table 5
Estimates of the direct and indirect effects between latent variables of the fully mediated model based on the original and modified measurement models respectively.
| Path estimate | b | SE | 95% CI | β |
|---|---|---|---|---|
| Original measurement model | ||||
| HR ➔ POS | .72*** | .053 | [.625, .832] | .51*** |
| POS ➔ RC | .18*** | .023 | [.135, .225] | .34*** |
| HR ➔ POS ➔ RC | .13*** | .020 | [.095, .172] | .17*** |
| Modified measurement model | ||||
| HR ➔ POS | .75*** | .054 | [.652, .861] | .56*** |
| POS ➔ RC | .17*** | .021 | [.133, .217] | .35*** |
| HR ➔ POS ➔ RC | .13*** | .019 | [.097, .172] | .18*** |
[i] Note: HR = human relations climate, POS = perceived organisational support, RC = readiness for change, b = unstandardized path coefficient, SE = standard error, CI = bias-corrected confidence interval (Unstandardized), β = standardized path coefficient.
*** p < .001.
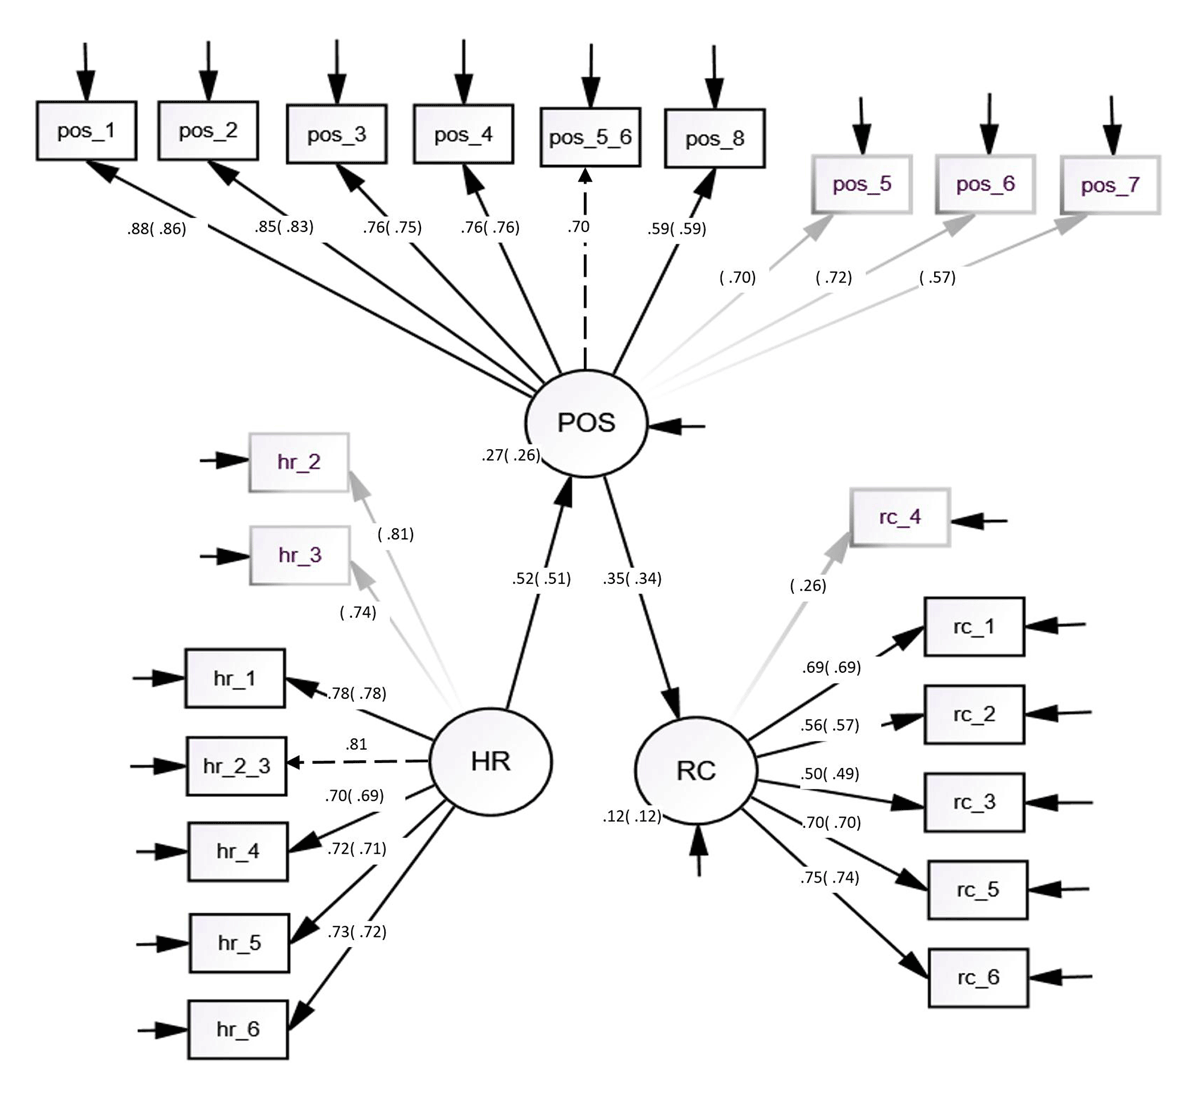
Figure 2
The final fully mediated model depicting structural relationships between the exogenous predictor variable, endogenous predictor variable, and criterion variable. Both original and modified measurement models are displayed.
Notes:
Exogenous predictor variable: HR = human relations climate; Endogenous predictor variable: POS = perceived organisational support, Criterion variable: RC = readiness for change.
Dotted arrows = Paths and items only present in the modified model. Greyed out arrows/items = Paths and items only present in the original model.
Numbers shown as standardized estimates. Estimates from the original model in parenthesis.
Paths constrained to zero and error terms are omitted to enhance readability.