
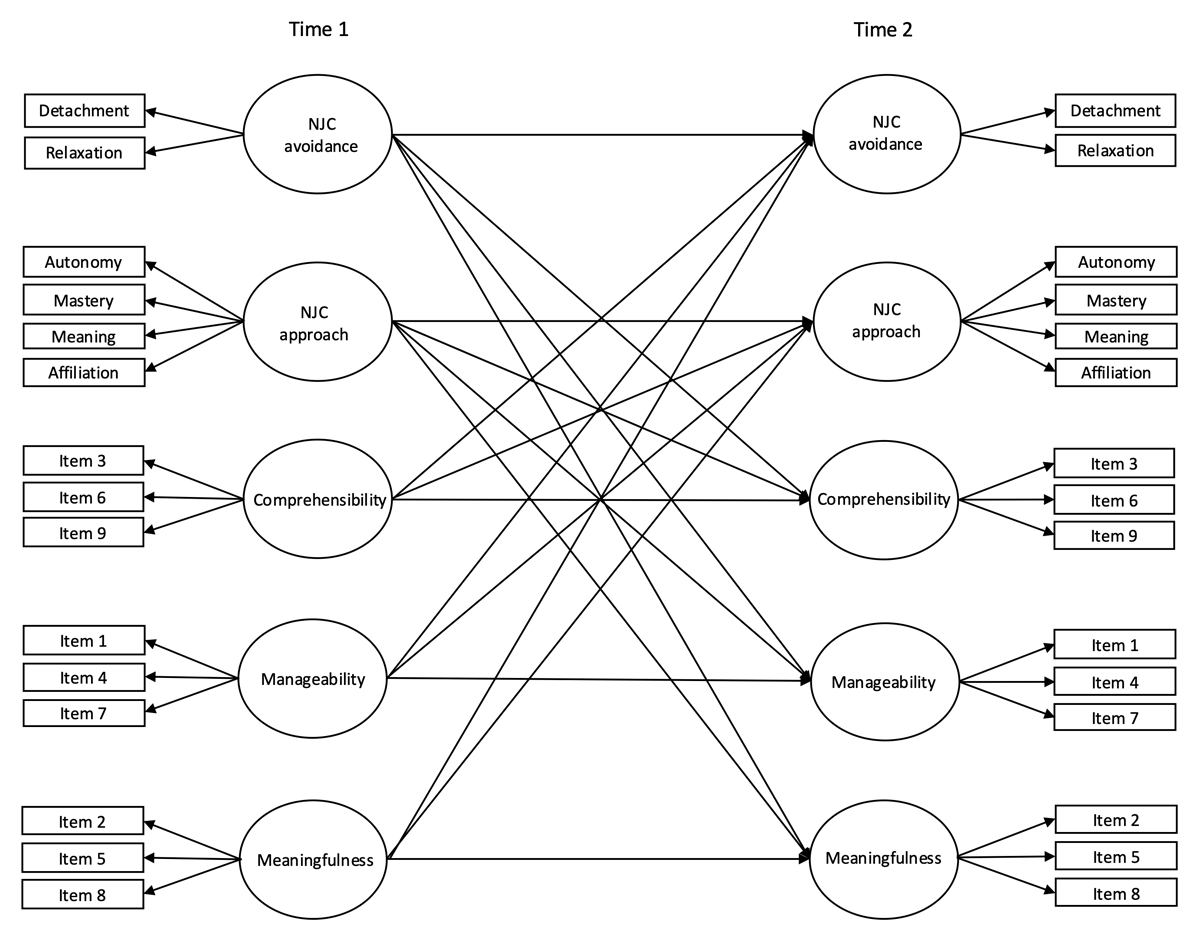
Figure 1
Hypothesized longitudinal model of reciprocal relationships between the NJC and work-SOC dimensions.
Table 1
Means, standard deviations, and zero-order correlations between the study variables.
| M | SD | 1 | 2 | 3 | 4 | 5 | 6 | 7 | 8 | 9 | 10 | |
|---|---|---|---|---|---|---|---|---|---|---|---|---|
| 1. Comprehensibility T1 | 4.99 | 1.16 | 1 | |||||||||
| 2. Manageability T1 | 4.61 | 1.38 | 0.64 | 1 | ||||||||
| 3. Meaningfulness T1 | 5.18 | 1.34 | 0.48 | 0.46 | 1 | |||||||
| 4. NJC avoidance T1 | 3.80 | 0.82 | 0.23 | 0.15 | 0.19 | 1 | ||||||
| 5. NJC approach T1 | 3.57 | 0.67 | 0.30 | 0.39 | 0.52 | 0.34 | 1 | |||||
| 6. Comprehensibility T2 | 5.05 | 1.09 | 0.64 | 0.49 | 0.41 | 0.25 | 0.34 | 1 | ||||
| 7. Manageability T2 | 4.70 | 1.34 | 0.45 | 0.65 | 0.35 | 0.17 | 0.39 | 0.64 | 1 | |||
| 8. Meaningfulness T2 | 5.08 | 1.32 | 0.38 | 0.38 | 0.74 | 0.21 | 0.51 | 0.45 | 0.40 | 1 | ||
| 9. NJC avoidance T2 | 3.75 | 0.87 | 0.22 | 0.19 | 0.12 | 0.57 | 0.21 | 0.26 | 0.24 | 0.13 | 1 | |
| 10. NJC approach T2 | 3.55 | 0.69 | 0.28 | 0.41 | 0.47 | 0.16 | 0.71 | 0.33 | 0.43 | 0.51 | 0.28 | 1 |
[i] Note. N = 924; all correlations are significant at p < 0.001.
Table 2
Longitudinal measurement invariance.
| MODEL | χ² | df | CFI | RMSEA | SRMR | Δχ² | Δdf | p | ΔCFI | ΔRMSEA | |
|---|---|---|---|---|---|---|---|---|---|---|---|
| NJC avoidance | Configural | 33.1 | 1 | 0.981 | 0.194 | 0.015 | |||||
| Metric | 33.1 | 2 | 0.981 | 0.135 | 0.015 | 0.0 | 1 | 0.986 | 0.000 | –0.059 | |
| Scalar | 33.7 | 4 | 0.982 | 0.094 | 0.017 | 0.7 | 2 | 0.709 | –0.001 | –0.041 | |
| NJC approach | Configural | 119.5 | 15 | 0.971 | 0.091 | 0.034 | |||||
| Metric | 140.5 | 18 | 0.966 | 0.090 | 0.046 | 21.0 | 3 | <0.001 | –0.005 | –0.001 | |
| Scalar | 151.0 | 22 | 0.964 | 0.083 | 0.047 | 10.5 | 4 | 0.032 | –0.002 | –0.007 | |
| Comprehensibility | Configural | 8.8 | 5 | 0.998 | 0.029 | 0.014 | |||||
| Metric | 9.4 | 7 | 0.999 | 0.019 | 0.015 | 0.6 | 2 | 0.725 | 0.001 | –0.010 | |
| Scalar | 13.5 | 10 | 0.998 | 0.019 | 0.019 | 4.1 | 3 | 0.256 | 0.000 | 0.000 | |
| Manageability | Configural | 15.9 | 5 | 0.994 | 0.049 | 0.018 | |||||
| Metric | 16.9 | 7 | 0.995 | 0.039 | 0.021 | 1.0 | 2 | 0.599 | –0.001 | –0.010 | |
| Scalar | 22.3 | 10 | 0.994 | 0.036 | 0.024 | 5.4 | 3 | 0.144 | 0.001 | –0.003 | |
| Meaningfulness | Configural | 8.9 | 5 | 0.999 | 0.029 | 0.008 | |||||
| Metric | 11.7 | 7 | 0.999 | 0.027 | 0.015 | 2.8 | 2 | 0.245 | 0.000 | –0.002 | |
| Scalar | 17.0 | 10 | 0.998 | 0.028 | 0.017 | 5.4 | 3 | 0.149 | 0.001 | 0.001 | |
| Full model | Configural | 1130.3 | 347 | 0.949 | 0.049 | 0.081 | |||||
| Metric | 1158.8 | 357 | 0.948 | 0.049 | 0.082 | 31.8 | 10 | 0.001 | 0.001 | 0.000 | |
| Scalar | 1187.3 | 372 | 0.947 | 0.049 | 0.083 | 28.8 | 15 | 0.019 | 0.001 | 0.000 |
Table 3
Model fit indices and model comparisons.
| MODEL | DESCRIPTION | χ² | df | CFI | RMSEA | SRMR | BIC | Δχ² | Δdf | p | ΔCFI | |
|---|---|---|---|---|---|---|---|---|---|---|---|---|
| M1 | Stability | 1251.4 | 376 | 0.943 | 0.050 | 0.088 | 61027.3 | – | – | – | – | – |
| M2 | Unidirectional: NJC → Work-SOC | 1209.3 | 370 | 0.946 | 0.050 | 0.089 | 61026.2 | M2 vs. M1 | 42.1 | 6 | <0.001 | 0.003 |
| M3 | Unidirectional: Work-SOC → NJC | 1209.8 | 370 | 0.946 | 0.050 | 0.082 | 61026.7 | M3 vs. M1 | 41.6 | 6 | <0.001 | 0.003 |
| M4 | Reciprocal: NJC ↔ Work-SOC | 1171.7 | 364 | 0.948 | 0.049 | 0.085 | 61029.5 | M4 vs. M2 | 37.6 | 6 | <0.001 | 0.002 |
[i] Note. Superior models are printed in bold.
Table 4
Path coefficients of the reciprocal model (M4).
| b | SE | z | p | β | H | |
|---|---|---|---|---|---|---|
| Autoregressive paths | ||||||
| NJC avoidance T1 → NJC avoidance T2 | 0.685 | 0.038 | 16.869 | <0.001 | 0.685 | |
| NJC approach T1 → NJC approach T2 | 0.639 | 0.045 | 14.736 | <0.001 | 0.639 | |
| Comprehensibility T1 → Comprehensibility T2 | 0.605 | 0.034 | 17.577 | <0.001 | 0.658 | |
| Manageability T1 → Manageability T2 | 0.639 | 0.037 | 17.272 | <0.001 | 0.668 | |
| Meaningfulness T1 → Meaningfulness T2 | 0.688 | 0.032 | 21.698 | <0.001 | 0.703 | |
| Cross-lagged paths | ||||||
| NJC avoidance T1 → Comprehensibility T2 | 0.080 | 0.052 | 1.556 | 0.120 | 0.077 | H1 |
| NJC avoidance T1 → Manageability T2 | 0.080 | 0.043 | 1.862 | 0.063 | 0.090 | H1 |
| NJC avoidance T1 → Meaningfulness T2 | 0.035 | 0.051 | 0.694 | 0.488 | 0.027 | H1 |
| NJC approach T1 → Comprehensibility T2 | 0.228 | 0.072 | 3.158 | 0.002 | 0.142 | H1 |
| NJC approach T1 → Manageability T2 | 0.190 | 0.064 | 2.943 | 0.003 | 0.137 | H1 |
| NJC approach T1 → Meaningfulness T2 | 0.333 | 0.083 | 4.006 | <0.001 | 0.166 | H1 |
| Comprehensibility T1 → NJC avoidance T2 | –0.032 | 0.078 | –0.415 | 0.678 | –0.039 | H2 |
| Comprehensibility T1 → NJC approach T2 | –0.200 | 0.058 | –3.460 | 0.001 | –0.341 | H2 |
| Manageability T1 → NJC avoidance T2 | 0.164 | 0.095 | 1.729 | 0.084 | 0.164 | H2 |
| Manageability T1 → NJC approach T2 | 0.306 | 0.072 | 4.248 | <0.001 | 0.431 | H2 |
| Meaningfulness T1 → NJC avoidance T2 | –0.055 | 0.029 | –1.898 | 0.058 | –0.077 | H2 |
| Meaningfulness T1 → NJC approach T2 | 0.048 | 0.021 | 2.268 | 0.023 | 0.095 | H2 |
[i] Note. Significant cross-lagged paths are printed in bold; T = Time, H = Hypothesis; R²NJC avoidance T2 = 0.497; R2 NJC approach T2 = 0.640; R2Comprehensibility T2 = 0.564; R2Manageability T2 = 0.600; R2Meaingfulness T2 = 0.660.