
Table 1
Descriptive statistics and bivariate correlations for sample 1 (2015, below diagonal) and sample 2 (2021, above diagonal).
| VARIABLE | 2015 | 2021 | 1 | 2 | 3 | 4 | 5 | 6 | 7 | 8 | 9 | 10 | 11 | 12 | 13 | 14 | 15 | 16 | 17 | ||
|---|---|---|---|---|---|---|---|---|---|---|---|---|---|---|---|---|---|---|---|---|---|
| M | SD | M | SD | ||||||||||||||||||
| 1 Age | 41.73 | 11.58 | 41.14 | 11.60 | – | .05** | –.03** | .02** | –.03** | .56** | .00 | –.04** | –.06** | –.22** | –.09** | –.06** | .02** | .04** | –.05** | ||
| 2 Gender | 0.52 | 0.49 | .02** | – | –.09** | .11** | .18** | .02** | .01 | –.03** | –.15** | .01** | –.00 | –.03** | .05** | –.10** | –.01 | ||||
| 3 Edu: upper-sec. | 0.50 | 0.36 | –.02** | –.04** | – | –.87** | .05** | .03** | –.03** | –.01** | .36** | .03** | .08** | .05** | .14** | .05** | –.10** | ||||
| 4 Edu: tertiary | 0.35 | 0.57 | –.04** | .09** | –.72** | – | –.07** | –.02** | .04** | .02** | –.47** | –.05** | –.11** | –.07** | –.20** | –.07** | .14** | ||||
| 5 Migration backgr.a | 1.14 | –.03** | .00 | –.04** | .01 | – | |||||||||||||||
| 6 Part–time work | 0.18 | 0.15 | –.00 | .22** | –.01 | –.05** | .05** | – | –.03** | .09** | .03** | .05** | .11** | .27** | .04** | .04** | –.02** | –.07** | |||
| 7 Job tenure | 9.45 | 9.48 | 10.41 | 9.51 | .54** | –.02** | –.02** | .03** | –.08** | –.11** | – | –.01** | –.04** | –.08** | –.19** | –.07** | –.09** | –.02** | .02** | –.00 | |
| 8 Regular 2nd job | 0.03 | 0.05 | .01 | .01* | –.03** | .05** | .02** | .05** | –.01* | – | –.04** | –.03** | .01** | –.01 | .00 | –.02** | –.01 | .00 | |||
| 9 Occasional 2nd job | 0.05 | 0.04 | –.05** | –.04** | –.02** | .03** | .02** | .03** | –.05** | –.04** | – | –.01 | .04** | .05** | .03** | .03** | –.01** | –.00 | |||
| 10 Status: blue collar | 0.31 | .05** | –.27** | .15** | –.38** | .04** | –.03** | –.04** | –.03** | –.00 | – | .08** | .12** | .11** | .20** | .07** | –.13** | ||||
| 11 Temporary contract | 0.14 | 0.14 | –.18** | .01 | .01 | –.04** | .05** | .12** | –.30** | .01 | .04** | .06** | – | .12** | .22** | .09** | .01** | –.02** | |||
| 12 Underemployment | 0.12 | 0.10 | –.07** | .05** | .00 | –.07** | .07** | .36** | –.13** | .01 | .06** | .05** | .14** | – | .08** | .12** | .02** | –.05** | |||
| 13 Low earningsa | 0.14 | –.07** | .17** | .04** | –.15** | .05** | .50** | –.18** | .05** | .03** | .04** | .15** | .32** | – | |||||||
| 14 Job insecurity | 2.11 | 1.30 | 1.86 | 1.22 | –.07** | –.02** | .05** | –.09** | .02** | .07** | –.19** | –.03** | .03** | .11** | .30** | .12** | .10** | – | .20** | –.13** | –.09** |
| 15 Financial stress | 3.23 | 1.27 | 2.59 | 1.25 | –.02** | .03** | .10** | –.23** | .01* | .04** | –.12** | –.05** | .02** | .19** | .13** | .13** | .14** | .24** | – | –.19** | –.13** |
| 16 Mental well–being | 4.42 | 1.00 | 4.23 | 1.02 | –.05** | –.05** | –.00 | .03** | –.03** | –.01* | –.01 | .00 | –.01* | –.04** | .00 | –.02** | –.02** | –.13** | –.20** | – | .05** |
| 17 Training part. | 0.80 | 0.88 | 1.01 | 0.83 | –.04** | .02** | –.13** | .25** | .00 | –.04** | .07** | .05** | .02** | –.21** | –.06** | –.05** | –.11** | –.10** | –.20** | .06** | – |
[i] Note. Sample 1 (2015): N = 34,410, sample 2 (2021): N = 60,410. Edu = education. Upper-sec. = upper-secondary. Migration backgr. = migration background. Training part. = Training participation. a not measured in 2021. * p < .05; ** p < .01.
Table 2
LCA of economic stressors in sample 1 (2015) and sample 2 (2021).
| k | AIC | aBIC | LMRT | VLMRT | BLRT | ENTROPY | AvePP | CLASS COUNTS/PROPORTIONS |
|---|---|---|---|---|---|---|---|---|
| 2015 | ||||||||
| 1 | 159657.32 | 159683.66 | – | – | – | – | – | 34408 (100%) |
| 2 | 154315.18 | 154373.13 | .000 | .000 | .000 | .487 | .80–.86 | 25751 (74.8%) / 8657 (25.2%) |
| 3 | 153160.25 | 153249.81 | .000 | .000 | .000 | .551 | .67–.87 | 4103 (11.9%) / 8851 (25.7%) / 21454 (62.4%) |
| 4 | 152999.86 | 153121.03 | .301 | .301 | .000 | .554 | .59–.83 | 1358 (4.0%) / 19140 (55.6%) / 3542 (10.3%) / 10368 (30.1%) |
| 5 | 152985.60 | 153138.37 | .001 | .001 | .000 | .688 | .66–.86 | 3334 (9.7%) / 909 (2.6%) / 6074 (17.7%) / 23269 (67.6%) / 822 (2.4%) |
| 2021 | ||||||||
| 1 | 180059.73 | 180083.07 | – | – | – | – | – | 100.0% (60679) |
| 2 | 176404.85 | 176457.37 | .000 | .000 | .000 | .447 | .79–.84 | 51988 (85.7%) / 8691 (14.32%) |
| 3 | 176239.84 | 176321.54 | .000 | .000 | .000 | .694 | .67–.93 | 3148 (5.2%) / 45865 (75.6%) / 11666 (19.2%) |
| 4 | 176240.19 | 176351.06 | .019 | .017 | .077 | .542 | .62–.79 | 38826 (64.0%) / 2467 (4.1%) / 15382 (25.3%) / 4004 (6.6%) |
| 5 | 176250.19 | 176390.24 | .445 | .445 | 1.000 | .463 | .00–.64 | 753 (1.3%) / 51960 (85.6%) / 6729 (11.1%) / 0 (0%) / 1237 (2.0%) |
[i] Note. Final selected solutions in boldface. k = number of latent classes. AIC = Akaike Information Criterion; aBIC = sample size-adjusted Bayesian Information Criterion; LMRT = Lo-Mendell likelihood ratio test; VLMRT = Vuong-Lo-Mendell likelihood ratio test; BLRT = Bootstrapped likelihood ratio test; AvePP, average latent class posterior probabilities.
Table 3
Distribution of the latent class indicators across classes in sample 1 (2015) and sample 2 (2021).
| 2015 | 2021 | |||||||
|---|---|---|---|---|---|---|---|---|
| 1) LOW ECONOMIC STRESSORS | 2) HIGH ECONOMIC STRESSORS | 3) SUBJECTIVE STRESSORS DOMINANT | DIFFERENCES BETWEEN CLASSESb | 1) LOW ECONOMIC STRESSORS | 2) HIGH ECONOMIC STRESSORS | 3) SUBJECTIVE STRESSORS DOMINANT | DIFFERENCES BETWEEN CLASSESb | |
| Probability of latent class indicatorsa | ||||||||
| Temporary contract | .04 | .40 | .29 | 1 < 2* 1 > 3* 2 > 3* | .08 | .40 | .24 | 1 < 2* 1 < 3* 2 > 3* |
| Underemployment | .05 | .55 | .06 | 1 < 2* 1 < 3* 2 > 3* | .06 | .44 | .00 | 1 < 2*c |
| Low earnings | .07 | .65 | .03 | 1 < 2* 1 > 3 ns 2 > 3 ns | – | – | – | – |
| Job insecurity: high | .10 | .57 | .79 | 1 < 2* 1 < 3* 2 < 3* | .04 | .54 | 1.00 | 1 > 2c |
| Financial stress: high | .30 | .67 | .59 | 1 < 2* 1 < 3* 2 > 3* | .16 | .50 | .32 | 1 < 2* 1 < 3* 2 > 3* |
[i] Note. a Because all latent class indicators were binary variables, the probability scores represent the relative likelihood to experience each economic stressor (i.e., the variable reaching the value 1). b Differences between classes are based on pairwise comparisons of odds ratios for each indicator variable across latent classes. The significance level was adjusted to p < .016 for three pairwise comparison per latent class indicator. c Due to perfect separation between class 3 (subjective stressors dominant) and the others on underemployment and job insecurity, respectively, no odds ratios could be calculated for pairwise comparisons with class 3 on these variables. * p < .016.
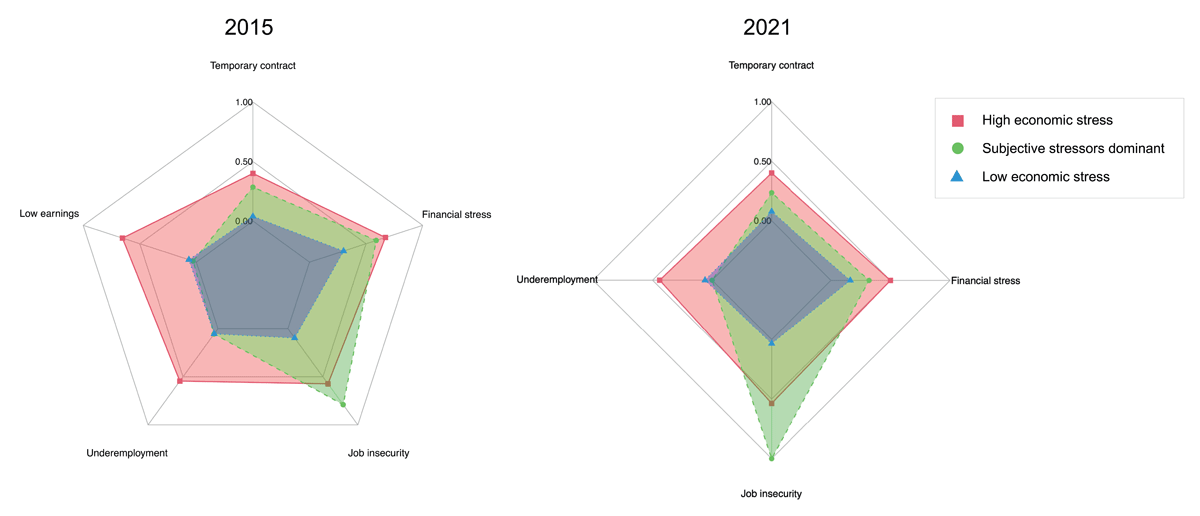
Figure 1
Profiles of economic stressors in 2015 (left) and 2021 (right). The y-axis depicts the likelihood of experiencing each economic stressor relative to not experiencing it.
Table 4
Determinants of latent class membership in sample 1 (2015) and sample 2 (2021).
| PREDICTOR | HIGH ECONOMIC STRESSORS | SUBJECTIVE STRESSORS DOMINANT | ||||
|---|---|---|---|---|---|---|
| M (SD) / % | OR | 95%-CI | M (SD) / % | OR | 95%-CI | |
| 2015 | ||||||
| Age | 38.69 (12.84) | 0.99** | [0.98; 1.00] | 41.02 (11.36) | 1.01*** | [1.01; 1.02] |
| Gender: woman | 65% | 1.49*** | [1.24; 1.79] | 47% | 0.96 | [0.87; 1.05] |
| Migration background | 19% | 1.17 | [0.95; 1.44] | 14% | 0.96 | [0.85; 1.09] |
| Education | ||||||
| Upper secondary | 53% | 0.37*** | [0.30; 0.47] | 52% | 0.92 | [0.80; 1.05] |
| Tertiary | 20% | 0.15*** | [0.12; 0.19] | 31% | 0.69*** | [0.59; 0.80] |
| Part-time employment | 63% | 28.62*** | [24.04; 34.07] | 10% | 0.22*** | [0.14; 0.35] |
| Job tenure | 4.50 (6.69) | 0.83*** | [0.80; 0.86] | 7.63 (8.91) | 0.92*** | [0.91; 0.92] |
| Multiple jobs | ||||||
| Regular 2nd job | 4% | 0.75 | [0.49; 1.12] | 2% | 0.52*** | [0.38; 0.73] |
| Occasional 2nd job | 8% | 2.41*** | [1.75; 3.33] | 5% | 1.18 | [0.97; 1.44] |
| Occ. status: blue collar | 38% | 1.81*** | [1.49; 2.22] | 36% | 1.59*** | [1.43; 1.77] |
| 2021 | ||||||
| Age | 36.94 (12.21) | 1.00 | [0.99; 1.00] | 40.74 (11.44) | 1.01*** | [1.01; 1.02] |
| Gender: woman | 51% | 0.64*** | [0.54; 0.76] | 46% | 0.91** | [0.85; 0.97] |
| Education | ||||||
| Upper secondary | 49% | 0.85 | [0.65; 1.11] | 39% | 1.02 | [0.88; 1.17] |
| Tertiary | 38% | 0.51*** | [0.39; 0.68] | 54% | 0.99 | [0.85; 1.14] |
| Part-time employment | 50% | 10.34*** | [8.74; 12.24] | 12% | 0.25*** | [0.18; 0.36] |
| Job tenure | 6.82 (7.32) | 0.93*** | [0.91; 0.94] | 9.16 (8.82) | 0.97*** | [0.97; 0.97] |
| Multiple jobs | ||||||
| Regular 2nd job | 4% | 0.48*** | [0.33; 0.70] | 5% | 1.16* | [1.00; 1.34] |
| Occasional 2nd job | 6% | 2.49*** | [1.85; 3.35] | 4% | 1.22* | [1.03; 1.46] |
| Occ. status: blue collar | 48% | 2.42*** | [2.05; 2.86] | 34% | 1.56*** | [1.44; 1.69] |
[i] Note. N = 32,456 for sample 1 (2015); N = 52,596 for sample 2 (2021) due to listwise deletion of missing values. Reference category: Low economic stressors. Occ. status = occupational status. * p < .05; ** p < .01; *** p < .001.
Table 5
Multilevel regression results with random slopes for latent class membership and cross-level interactions between latent class membership and country-level class membership in sample 1 (2015) and sample 2 (2021).
| PREDICTOR | 2015 | 2021 | ||||||
|---|---|---|---|---|---|---|---|---|
| MENTAL WELL-BEING | TRAINING PARTICIPATION | MENTAL WELL-BEING | TRAINING PARTICIPATION | |||||
| b | SE | b | SE | b | SE | b | SE | |
| Level 2: Country | ||||||||
| Prevalence high economic stressors | .01 | .65 | –.40 | .78 | 2.51 | 2.24 | –2.03 | 1.28 |
| Prevalence subjective stressors dominant | –.12 | .30 | –1.15** | .34 | .82 | .59 | –.71* | .33 |
| Level 1: Individual | ||||||||
| High economic stressors | –.22*** | .02 | –.30*** | .02 | –.16*** | .03 | –.22** | .03 |
| Subjective stressors dominant | –.22*** | .02 | –.08*** | .02 | –.30*** | .02 | –.15*** | .01 |
| Cross-level interactions | ||||||||
| Prevalence × high economic stressors | 1.31** | .45 | –.13 | .42 | 2.24† | 1.22 | 1.61 | 1.41 |
| Prevalence × subjective stressors dominant | .27 | .22 | .10 | .15 | .20 | .18 | .06 | .16 |
[i] Note. N = 34,339 for well-being and N = 34,267 for training participation in sample 1 (2015); N = 60,589 for well-being and N = 40,785 for training participation in sample 2 (2021). Reference category for latent class membership/prevalence: Low economic stressors. † p < .10; * p < .05; ** p < .01; *** p < .001.
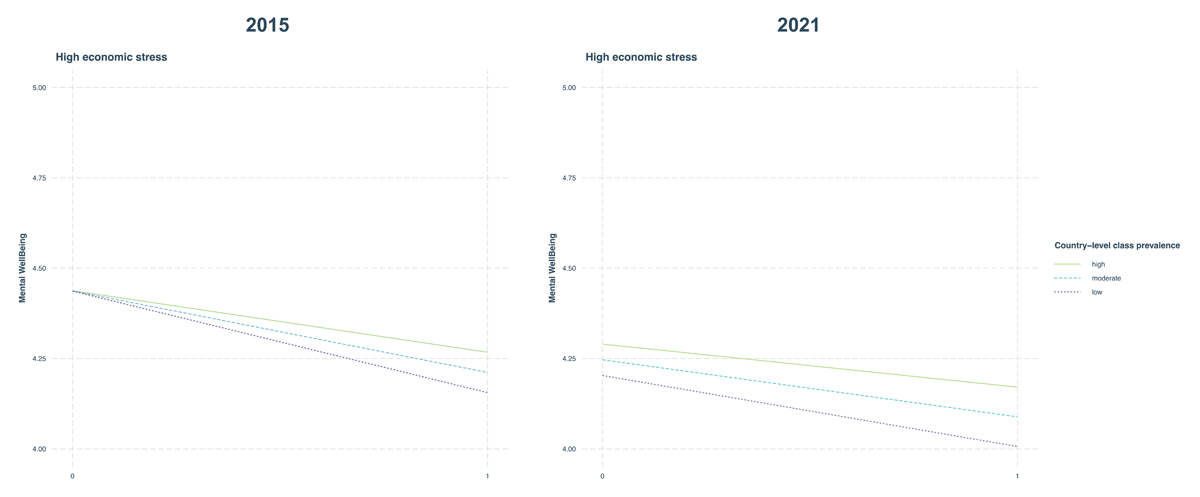
Figure 2
Cross-level interaction between country-level prevalence of high economic stressors and individual high economic stressors on mental well-being in 2015 (left) and 2021 (right). Scale on the y-axis is cropped to 4–5 for illustrative purposes (the full scale for mental well-being was 1–6).