
Introduction
Economic stress, characterized by instability and insecurity in income and/or employment relations (Probst 2005; Voydanoff 1990), has become a common feature of many workers’ everyday life in ever-changing, turbulent and polarized labor markets (Allan, Autin & Wilkins-Yel 2021; Biegert 2019; Kalleberg 2009). In 2021, 15% of workers in Europe perceived a high risk of losing their job and 26% struggled to make ends meet (Eurofound 2022). Such threats to economic security and, by consequence, to essential material and psychosocial resources, are a source of stress with detrimental consequences for well-being and behavior (Benach et al. 2014; Landsbergis, Grzywacz & LaMontagne 2014; Probst et al. 2017).
Economic stress is an umbrella term for several constructs relating to workers’ employment relationship or income situation, which can both be operationalized as subjective perceptions or objective indicators (Voydanoff 1990). Taking a closer look at these different aspects, some economic stressors have received more research attention and have been linked more clearly to well-being and behavior than others: For example, perceived job insecurity has been unequivocally established as a stressor with negative effects (De Witte et al. 2016; Jiang & Lavaysse 2018; Sverke et al. 2002), whereas the case is less clear for ‘objectively’ insecure jobs such as involuntary temporary employment (De Cuyper & De Witte 2009; Imhof & Andresen 2017). Moreover, workers do not experience different economic stressors in isolation, but in the context of their whole employment and financial situation, so that distinct combinations, reflecting qualitative differences in the overall experience of economic stress, may shape their reactions (Bazzoli, Probst & Tomas 2022). Although previous studies have typically examined isolated economic stressors, such as job insecurity or financial stress, workers’ experiences often involve multiple, co-occurring stressors that interact in complex ways (Probst 2005; Sinclair, Graham & Probst 2024). For example, some workers may feel financially strained despite job stability—such as those in low-paid but secure jobs—while others may enjoy high incomes but face instability due to short-term or precarious contracts. These scenarios represent qualitatively different experiences of economic stress within persons, which cannot be captured when focusing on single indicators. As such, we argue that analyzing patterns of economic stressors simultaneously, using a person-oriented approach, is conceptually necessary to fully understand the lived experience of economic insecurity. This approach makes it possible to uncover distinct constellations of stressors that reflect heterogeneity in individual contexts and are often overlooked in variable-centered analyses. A person-centered analysis thus offers a more grounded understanding of how people experience economic insecurity.
The first aim of this study was to capture the heterogeneity in the experience of economic stress by identifying subgroups of workers who share distinct patterns in a person-oriented approach (Bergman et al. 2003; M. Wang & Hanges 2011). We consider both employment-related and income-related, as well as objective and subjective indicators. Based on Voydanoff’s (1990) framework, we include temporary employment, low earnings, underemployment, perceived job insecurity and perceived financial stress as the most relevant stressors identified in the literature to cover the spectrum of economic stress (Probst 2005; Probst et al. 2017).
The second aim was to investigate whether different patterns of economic stress show differential relationships with well-being and behavior. Drawing on Conservation of Resources (COR) Theory (Hobfoll 1989; Hobfoll et al. 2018) and Fryer’s agency model (Fryer 1986; Fryer & Fagan 2003), we investigate mental well-being as a relevant stress outcome, as well as training participation. Work-related learning, including training, has not been investigated as an outcome of economic stress as often as health or performance, even though it may be particularly relevant: Workers dealing with economic stress may be in need of and benefit the most from acquiring new skills to improve or cope with their situation, but face more barriers to do so, due to limited opportunities and drained resources (Van Hootegem et al. 2023a). Fryer’s (1986) model is particularly useful in this context, as it highlights how objective material deprivation undermines individuals’ capacity for proactive behaviors such as training participation by restricting perceived agency and future planning capabilities.
Additionally, workers’ experience of economic stress does not occur in a vacuum but may be affected by the socio-economic context reflecting additional environmental resources or constraints in a given country (Jiang, Probst & Sinclair 2013; Klug et al. 2024). One important aspect in this regard is the prevalence and distribution of economic stressors: Knowing that many others are in a similar situation may either alleviate feelings of relative deprivation and hence effects of economic stress, or exacerbate stress reactions, because there are more others to compete with for scarce resources (Fullerton et al. 2020; Jiang & Probst 2017). Research on macrolevel moderators of individual economic stressors has been scarce and inconsistent as of yet (Probst et al. 2017). The third aim of this study was therefore to explore the prevalence of economic stress patterns at the country level as a moderator of individual reactions.
Our analyses are based on cross-sectional data in two independent, representative samples from the European Working Conditions Survey in 2015 and 2021, respectively. We contribute to the literature in the following ways: First, we extend previous variable-oriented research (i.e., studies looking at isolated effects of selected indicators) by identifying latent classes of a broad spectrum of economic stressors, thus providing a more holistic account of workers’ experience of economic stress. Building on previous person-oriented analyses (Bazzoli, Probst & Tomas 2022), we identify economic stressor classes in two independent, representative samples. Second, we contribute to a small, growing body of studies linking economic stressors to work-related learning by analyzing associations with training participation, an important, but overlooked outcome (Van Hootegem et al. 2019, 2023a). Third, by considering the country-level prevalence of economic stressor classes, we answer calls for more research on macrolevel contextual effects on economic stress to provide a more nuanced understanding of its consequences (Probst et al. 2017).
Conceptualizing Economic Stressors
Economic stressors, defined as ‘aspects of economic life that are potential stressors for individuals and families’ (Voydanoff 1990, p. 1102), refer to the broader employment relationship in terms of access to work and income. Four broad categories of economic stressors can be distinguished: employment-related and income-related stressors, each of which can be operationalized in objective versus subjective terms (Probst 2005; Voydanoff 1990). The framework of economic stress thus captures the core aspects of precarious employment in terms of insecurity and economic instability (Bazzoli, Probst & Tomas 2022; Creed et al. 2020), and maps onto Allan et al.’s (2021) framework that distinguishes objective precarious work characteristics from subjective experiences of work precarity.
Regarding employment as the source of stress, employment instability comprises objective conditions that limit access to work (Probst 2005; Voydanoff 1990). This includes underemployment, which has been defined as a discrepancy between ‘satisfactory employment’ (Kaufmann 1982) and current employment, wherein the latter is seen as inferior or of lower quality (Feldman 1996; Probst 2005). We focus on hours underemployment and temporary employment as forms of underemployment. Hours underemployment occurs when employees work fewer hours than they would prefer (Dooley 2003; McKee-Ryan & Harvey 2011). While temporary employment may be voluntary or involuntary depending on the context, workers in temporary positions typically have reduced access to employment benefits, protections, and long-term stability compared to those in permanent employment (De Cuyper et al. 2008; Imhof & Andresen 2017). Both hours underemployment and temporary employment thus often entail having insufficient access to work to maintain employment stability, either in the present or the future. On the subjective side, employment uncertainty refers to workers’ perceptions of their future job prospects, which is captured in the concept of job insecurity, that is, workers’ concerns about the future continuity of their job (Shoss 2017; Sverke & Hellgren 2002). Quantitative job insecurity (i.e., concerns about losing the job as such) can be distinguished from qualitative job insecurity (i.e., concerns about losing valued job features; Hellgren et al. 1999). We focus on quantitative job insecurity to emphasize perceptions of access to work and economic security.
Regarding income as a source of stress, objective economic deprivation refers to loss and insufficiency of financial resources (Probst 2005; Voydanoff 1990). There is little consensus about how financial deprivation should be defined and measured, but it requires some standard of what is ‘sufficient’ in a population (Klug, Gerlitz & Selenko 2023). We focus on low earnings, defined as earnings below 60% of a country’s median, as the established threshold in Europe (Eurostat 2023). Finally, economic strain refers to subjective perceptions of income adequacy and concerns about one’s financial situation (Probst 2005; Voydanoff 1990). In our study, we assess workers’ perceived ability to make ends meet as a cognitive evaluation of their income sufficiency (Sears 2008; Sinclair & Cheung 2016).
The economic stressors examined in this study—temporary employment, underemployment, job insecurity, low earnings, and financial stress—align closely with the conceptualization of precarious work as outlined by Allan et al. (2021). Specifically, Allan et al.’s framework defines precarious work as work that is unstable, insecure, and restricts workers’ power to advocate for change, distinguishing between three core dimensions: precarity of work (i.e., uncertainty related to job continuity), precarity at work (i.e., unpredictability in working conditions such as discrimination, harassment, and lack of protections), and precarity from work (i.e., uncertainty due to a job that does not provide sufficient income to meet basic needs). Because our study focuses on economic stressors, precarity at work is beyond the scope of our investigation, as it relates to workplace conditions such as social inclusion and discrimination, which are not direct indicators of economic stress. Unemployment, as another indicator of employment instability in the framework of economic stress (Probst 2005), is also outside the scope. Not only is unemployment as such an economic stressor, but a) unemployed persons also experience other economic stressors, specifically financial stress (McKee-Ryan et al. 2005), and b) repeated spells of unemployment in between unstable jobs reflect a common experience of precarity (Probst 2005; Rubery et al. 2018). However, our goal was to include as broad a range of both employment-related and income related stressors as people experience them simultaneously, which precludes unemployment (e.g., people cannot worry about losing jobs they currently do not have). We therefore focused on employees as our study population.
Altogether, the dimensions of precarity of work and precarity from work map onto our selected variables. Precarity of work is reflected in three of our economic stressors: temporary employment and underemployment (i.e., economic instability), as they often indicate limited and unpredictable access to work; job insecurity (i.e., employment uncertainty), as it represents workers’ concerns about future job continuity; and financial stress (i.e., economic strain), as it captures the subjective experience of financial hardship. In contrast, precarity from work is reflected in our measure of low income (i.e., economic deprivation), as it signifies an objective lack of sufficient earnings to ensure financial security. The overlap between the economic stressors included in this study and the precarious work framework of Allan et al., (2021) highlights how these economic stressors directly reflect the extent to which employees experience precariousness within the labor market.
A Person-Oriented Perspective on Economic Stressors
Work and organizational psychology has concentrated on employment-related economic stressors, the most commonly-researched concepts being unemployment, underemployment, temporary employment, and job insecurity (Bazzoli, Probst & Tomas 2022; Probst et al. 2018). When looking at the consequences, studies have typically focused on specific stressors with a variable-oriented approach and established a solid evidence base (Allan, Autin & Wilkins-Yel 2021; Probst et al. 2018). However, workers do not experience stressors such as job insecurity or low earnings in isolation, but in the context of other characteristics of their employment relationship. Economic stressors often co-occur due to the cyclical nature of resource loss, where initial losses can lead to further declines (Hobfoll et al. 2018). For instance, the perception of job insecurity frequently leads to concerns about potential financial resource depletion (Höge et al. 2015; Selenko & Batinic 2013; Vander Elst et al. 2016). Additionally, workers’ perceptions of job insecurity and financial stress are often a reflection of their actual unstable employment conditions or low income (De Witte & Näswall 2003; Klug, Selenko & Gerlitz 2021). In a comprehensive study, Probst et al. (2018) explored various objective and subjective indicators of economic stress, demonstrating that both employment-related and income-related stress simultaneously impact well-being. This finding underscores the necessity of considering the full spectrum of economic stressors when assessing their effects.
Conversely, moderate correlations observed between various indicators of economic stress suggest significant heterogeneity among workers, which could be more accurately captured through a person-oriented analysis. This approach acknowledges that distinct patterns of economic stressors may emerge, each reflecting qualitative differences in the underlying psychological processes (Bergman & Lundh 2015; M. Wang & Hanges 2011). For instance, holding a temporary contract may not be inherently stressful for someone with a stable income and promising long-term employment prospects. However, the situation could become problematic when high job insecurity is coupled with limited savings, leaving the individual vulnerable to unemployment between contracts (see Clinton et al. 2011; Klug, Drobnič & Brockmann 2019). Some workers may appear to have favorable employment conditions on paper, with few objective economic stressors, yet still experience high levels of stress due to concerns about job prospects in a volatile sector or the inability to keep pace with the cost of living in their area (see e.g., Hassard & Morris 2020 on managers in the US-automotive sector; or Waldron & Redmond 2017 on repercussions of the housing crisis on mortgagers in Ireland). Conversely, others might encounter minimal employment instability but suffer from significant financial stress, or vice versa. Identifying such patterns allows for a more nuanced understanding of workers’ experiences of economic stress, which aligns more closely with theoretical conceptions of precarity as a multifaceted construct (Allan, Autin & Wilkins-Yel 2021; Bazzoli, Probst & Tomas 2022; Van Aerden et al. 2014).
Given the exploratory nature of person-oriented methods such as latent class analysis (LCA) and limited previous research, it is difficult to hypothesize a specific number of patterns of economic stress. Van Aerden et al. (2014) combined objective economic stressors with other aspects of job quality and found, among others, a precarious and a non-precarious class. Similarly, Bazzoli et al. (2022) focused specifically on economic stress within a sample of US MTurk workers, identifying only two classes: precarious and non-precarious workers, distinguished by low versus high scores across all stressors. While we anticipate replicating at least these two patterns among European employees, our study, conducted in a different region with a larger, population-representative sample, also seeks to explore the possibility of additional, more heterogeneous classes, as previously discussed.
Research question: Can distinct classes of economic stressors be identified?
For a deeper understanding of the characteristics and circumstances of different economic stressor patterns, we also aim to gain insight into who typically experiences which pattern. Therefore, we explore the sociodemographic profile and employment situation of each class by investigating the following characteristics: age, gender, migration background, education, job tenure, part-time employment, multiple jobholding, and occupational status in terms of white-collar versus blue-collar work. It follows from our exploratory approach regarding the number and shape of economic stressor classes, that we could not hypothesize specific relationships with these predictors. However, we chose these characteristics as essential indicators of employees’ labor market position. Given prior research, we would expect those commonly characterized as labor market insiders to be more protected from critical patterns of economic stressors, that is, middle-aged workers, men, those without a migration background, with higher levels of education, with longer job tenure, full-time workers, with no second job and white-collar workers (see Autor 2011; Biemann, Zacher & Feldman 2012; Brouwer, Bakker & Schellekens 2015; Gallie 2000; Krings 2021; Landsbergis, Grzywacz & LaMontagne 2014; Sackmann 2001; Scott-Marshall, Tompa & Trevithick 2007).
Consequences of Economic Stress
Most theoretical explanations why economic stressors would have a negative impact boil down to insufficient resources, as reflected in COR theory (Hobfoll 1989; Probst et al. 2017). According to the theory, people strive to obtain and protect resources, that is, things they value. Stress occurs when people’s resources are threatened or lost (Hobfoll 1989; Hobfoll et al. 2018). Moreover, protecting and accumulating resources requires investing resources, but this becomes more difficult in a state of stress when resources are already drained (Hobfoll 2001; Hobfoll et al. 2018). Consequently, economic stressors, reflecting a lack or threat of essential resources accessed through work, undermine health, well-being, and agentic behavior via stress (Meuris & Leana 2015; Probst et al. 2017).
More specific approaches stem from unemployment research but have also been applied to economic stressors among workers. Jahoda’s (1982) latent deprivation model can be used to specify the financial and psychosocial resources in terms of manifest (i.e., money) and latent benefits (e.g., time structure, collective purpose, or status) which are threatened or lost under economic stress. Accordingly, threat to manifest and latent benefits of work have been shown to mediate the effects of job insecurity on well-being (Höge et al. 2015; Selenko & Batinic 2013; Vander Elst et al. 2016).
Compared to other approaches such as Jahoda (1982), Fryer (1986, 1994) puts greater emphasis on objective material deprivation, arguing that insufficient monetary resources restrict people’s personal agency, which is in line with Hobfoll’s (2001) prediction that resource loss begets further loss and hinders the proactive mobilization and accumulation of resources. Supporting this argument, low earnings and financial strain have been shown to reduce workers’ sense of control (Jachimowicz et al. 2021; Klug, Selenko & Gerlitz 2021). More specifically, Fryer’s agency model (1986, 1994) suggests that economic deprivation constrains an individual’s perceived ability to act, reducing motivation and proactive behavior. This view is strongly supported by research showing that financial scarcity taxes cognitive capacity and undermines higher-order reasoning, thus limiting the capacity for forward-looking behaviors such as skill investment (Mani et al. 2013). In the context of work and career development, this implies that individuals experiencing economic stress may have fewer cognitive resources available for forward-looking behaviors, such as planning for learning activities or engaging in skill development. As a result, participation in training may be substantially lower among those facing acute financial stress. In the context of economic stressors, combining the theoretical lenses of Fryer (1986) and Hobfoll (2001) is thus fruitful for understanding why financially constrained workers may struggle not only with well-being but also with mobilizing resources for long-term skill development or labor market mobility.
Several studies show stressful consequences of economic stressors, although the evidence is more consistent for subjective than for objective operationalizations: Several meta-analyses have shown unequivocally that perceived job insecurity is associated with lower mental health (Cheng & Chan 2008; Jiang & Lavaysse 2018; Kim & von dem Knesebeck 2016; Llosa et al. 2018; Sverke et al. 2002). Perceived financial stress has also been linked quite consistently to lower mental health (see Guan et al. 2022, and Sinclair & Cheung 2016 for systematic reviews).
On the objective side, there is a robust association of income in general, as well as poverty, with mental well-being (Adler & Ostrove 1999; Martikainen et al. 2003; see Thomson et al. 2022 for meta-analytic evidence). Underemployment has generally been linked to mental well-being (Dooley 2003; Lee et al. 2021; McKee-Ryan & Harvey 2011), but some studies also failed to establish robust effects for hours underemployment in comparison to other types, such as income underemployment (Friedland & Price 2003; Scott-Marshall, Tompa & Trevithick 2007). As for temporary employment, some studies report negative effects (e.g., Aronsson, Gustafsson & Dallner 2002), some have found positive effects (e.g., Mauno et al. 2005), and others found no mental health differences between temporary and permanent employees (e.g., Bardasi & Francesconi 2004; see De Cuyper et al. 2008, and Imhof & Andresen 2017 for systematic reviews). It is possible that individual differences in how temporary employment is experienced—such as whether it is entered into voluntarily or not—may partly explain some of these mixed results. However, these inconsistencies may also suggest that effects depend on the overall context of economic stress as captured in latent classes, for example whether underemployment and temporary employment are coupled with financial stress or job insecurity. We hypothesize from the overall state of research that workers who accumulate more economic stressors altogether will also report lower mental health.
Hypothesis 1: Classes of economic stressors differ in mental well-being such that employees with more economic stress will report lower well-being.
In contrast to well-being, research on the effects of economic stressors on workplace learning and development is rather scarce. However, learning activities such as training participation seem particularly relevant in the context of economic stressors as improving their skills may help workers cope with or improve their situation by strengthening their position with their employer or in the external labor market (Raemdonck et al. 2012; Van Hootegem et al. 2019). For example, longitudinal evidence suggests that early-career work-related learning reduces later unemployment among low-qualified workers (Knipprath & De Rick 2014). At the same time, the work environment of precarious workers typically offers fewer development opportunities while participating in training requires time, cognitive effort and sometimes money, to identify opportunities, sign up and complete a curriculum (see Decius et al. 2024). This type of agentic resource mobilization and investment will be more difficult for someone in a state of resource threat or drain, or with fewer resources to begin with, according to COR theory (Hobfoll 2001). In line with Fryer’s (1994) agency hypothesis, reduced self-efficacy has been shown to mediate negative effects of job insecurity on workplace learning (Van Hootegem, Sverke & De Witte 2021). Studies investigating effects of perceived job insecurity on training illustrate this duality: Workers seem to feel more in need of and willing to participate in training when they are job-insecure, but they also perceive fewer opportunities to do so and actually participate less (Van Hootegem et al. 2019, 2023a, 2023b). According to a mixed-method study, the anticipation of financial benefits after attending a training such as a bonus or promotion can foster low-qualified employee’s learning intentions, but not at the expense of a fulfilling job after promotion (Kyndt et al. 2013).
Job-insecure employees work more often in unstable labor markets (Allan, Autin & Wilkins-Yel 2021) or in organizations that provide fewer training opportunities and limited HR practices (Carbery & Garavan 2005; Guest, Isaksson & De Witte 2010). Job insecurity has been shown to be associated with perceiving fewer opportunities to learn from colleagues and supervisors (Van Hootegem et al. 2021). Research also suggests that those in precarious employment are less likely to benefit from employer-sponsored training and more often bear the costs of their own development than those in more secure positions (Blumenfeld 2011; Lewchuk et al. 2015).
Others have argued that financial pressures also restrict learning and skill acquisition due to drained cognitive resources (Meuris & Leana 2015). Again in line with the agency argument, financial stress has been linked to lower levels of long-term goal striving and proactive behavior such as extra-role performance (Jawahar, Mohammed & Schreurs 2022; Y. R. Wang & Ford 2020). One study suggests that even if economically stressed workers manage to mobilize resources and improve their skills, it can still result in long-term resource depletion: Lebel et al. (2022) showed that fear resulting from financial stress led to proactive skill-building, but this, in turn, led to burnout later in time.
Looking to objective economic stressors, studies show that low-skilled, low-paid jobs offer fewer opportunities for training and development, while the workers who typically do these jobs face additional barriers to participation due to lower education (Anselmann 2022; Bassanini et al. 2007; Decius, Schaper & Seifert 2021)—unless they work in a small company led by an engaged business owner (McPherson & Wang 2014). Part-time (i.e., potentially underemployed) and temporary employees are typically located in the periphery of an organization’s workforce, where employers invest less and offer fewer training than for core employees (Backes-Gellner, Oswald & Tuor Sartore 2014; Bassanini et al. 2007; Cropanzano et al. 2022; Kauhanen & Nätti 2015). From the existing evidence, we expect workers who experience more economic stress to participate in training less than those with fewer economic stressors.
Hypothesis 2: Classes of economic stressors differ in training participation, such that employees with more economic stress will report lower training participation.
Prevalence of Economic Stressor Profiles: Additional Constraint or Buffer?
Employment relationships are embedded in the socio-economic and political context of a country that may shape workers’ responses to economic insecurity, for example due to differences in protective labor legislation, the social safety net, or the current economic climate (see Klug et al. 2024; Probst et al. 2017). Additionally, people engage in social comparison and evaluate their circumstances relative to those of others (Brand 2015). How certain constellations of economic stressors affect workers’ well-being and behavior may thus depend on how common their situation is in their country.
The literature indeed provides some evidence for macrolevel contextual moderators on individual reactions to economic stressors, but studies are scarce, findings are mixed, and competing theoretical predictions can be made (Probst et al. 2017). On the one hand, scholars have drawn on relative deprivation theory (Folger & Martin 1986) to argue that economic stressors have a more negative impact on individuals in more positive environments (i.e., more affluent, with fewer people experiencing economic stress). In such environments, people affected by economic stress would perceive a greater social distance to their economically secure peers, whereas they would react less strongly and internalize less blame for their circumstances when they perceive more people being in the same boat as themselves (Brand 2015). Accordingly, Fullerton et al. (2020) showed that the relationship between perceived job insecurity and health was strongest when the country-level variation in job insecurity was low, that is, when most people felt similarly (in-)secure (see also Höge et al. 2015).
On the other hand, and this is the perspective we take in this article, a high prevalence of economic stressors in a country can be seen as an additional environmental constraint based on COR theory (Hobfoll 2001; Jiang & Probst 2017). When the prevalence of a given stressor pattern is high (e.g., particularly unstable employment, predominant financial pressures), this suggests a labor market where access to resources is unequally distributed and generally scarce for many individuals (Jiang, Probst & Sinclair 2013; Probst et al. 2017). Such an environment increases the pressure to compete for well-paid, stable jobs as well as perceptions of unfairness, which may exacerbate stress reactions (see Jiang & Probst 2017). While competition may perhaps motivate workers to gain an advantage through training, an economically insecure environment may reduce instrumentality, that is, the perception that the training will result in the desired improvement of one’s situation—such perceptions of contingency between effort and outcome are key to personal agency (Rotter 1966; see also Tharenou 2001).
Supporting the resource-based argument, studies have shown that regional unemployment (Otto et al. 2016), as well as income inequality (Jiang & Probst 2017) can exacerbate negative well-being effects of job insecurity. A literature review suggests that the relationship between financial stress and depressive symptoms is stronger in less affluent countries (Guan et al. 2022). Reporting more mixed findings, Probst et al. (2018) have found in the US that favorable county-level population health determinants (including employment rates and income) buffered negative effects of income-related stress, but exacerbated effects of employment-related stress. Therefore, contextual effects may also differ depending on the specific patterning of economic stressors. Based on the resource perspective, we generally expect the stress associated with experiencing a given pattern of economic stress to be worse when its prevalence is high.
Hypothesis 3: The prevalence of latent classes characterized by more economic stressors at the country level exacerbates the relationship of individual class membership with a) mental well-being and b) training participation.
Methods
Sample and Procedure
To answer our research question and test hypotheses, we analyzed archival data from the European Working Conditions Survey (EWCS), a repeated cross-sectional survey of workers across Europe conducted approximately every five years by the European Foundation for the Improvement of Working and Living Conditions (Eurofound). The EWCS contains randomly drawn, representative samples of individuals in employment aged 15 or older, residing in private households in the participating countries. We used the most recent waves of 2015 and 2021, respectively, to see if similar economic stressor classes, as well as relationships with outcomes and moderators, would appear in two independent samples at different time points. The 2015 data collection included 43,850 persons in 35 countries and was conducted via face-to-face interviews (Eurofound 2017). The 2021 data collection included 71,758 persons in 37 countries and was conducted via telephone due to the Covid-19 pandemic (Eurofound 2022). We restricted our analyses to adult employees of working age (18–64 years) and excluded the self-employed, because they are typically not covered by the same social protection as employees and may experience economic stressors such as job insecurity differently than employees (see e.g., Klandermans, Klein Hesselink & van Vuuren 2010).
It should be noted that the two samples do not allow an exact replication of latent classes, because they do not contain an identical set of variables (earnings were only measured in 2015; but not in 2021). We have nevertheless analyzed both EWCS waves to examine whether qualitatively similar stressor configurations emerge under markedly different macro-economic conditions—pre-pandemic stability versus immediate post-pandemic volatility. Such conceptual replication speaks to ecological validity. A formal similarity test or latent transition analysis (Morin et al. 2016) was not feasible due to the cross-sectional nature of the EWCS and the lack of the earnings indicator in 2021. Rather than deleting earnings from 2015 or imputing it for 2021—both of which would introduce their own biases—we chose to test whether the broader pattern of classes would nonetheless reappear.
Sample 1: 2015
In 2015, a sample of N = 34,410 employees met our selection criteria. Respondents were on average 42 years old (SD = 11.58), 52% were women and 14% had a migration background. About a third (34%) had completed tertiary education, 50% had an upper-secondary degree, and 16% had completed lower secondary education or less. The majority (82%) worked full-time with an average of 38 hours per week (SD = 11.31) and had an average job tenure of 10 years (SD = 9.48). A minority of 8% held more than one job (3% reported working regularly, and 5% reported occasionally working a second job), and 14% held a temporary contract in their main job. About a third of the respondents (31%) worked in blue-collar jobs.
Sample 2: 2021
In 2021, N = 60,410 employees met our selection criteria. Respondents were on average 41 years old (SD = 11.60), 49.3% were women, 50.4% men and 0.3% diverse. About a third (36%) had completed tertiary education, 57% had an upper-secondary degree, and 7% had completed lower secondary education or less. The majority (85%) worked full-time with an average of 40 hours per week (SD = 11.8) and had an average job tenure of 10 years (SD = 9.51). A minority of 9% reported having more than one job: 5% reported working regularly, and 4% reported occasionally working a second job, though only 10% of all respondents reported valid information on this variable in 2021. Also in this sample, 14% held a temporary contract in their main job. Just over a quarter of the respondents (27%) worked in blue-collar jobs.
Measures
The measures were identical across both samples, unless indicated otherwise.
Economic stressors. Objective indicators of economic stress included underemployment (0 = no, 1 = yes if respondents worked fewer hours than preferred), having a temporary contract (0 = no, 1 = yes), and low earnings (0 = no, 1 = yes if earnings were at or below 60% of the respondents’ country’s median earnings). Earnings were measured in 2015 only, and not included in the 2021 sample.
Subjective indicators of economic stress included perceived job insecurity and financial stress. Perceived job insecurity was measured with a single item (‘I might lose my job in the next six months’) rated on a 5-point scale from 1 = strongly agree to 5 = strongly disagree (reverse-coded and dichotomized at values ≥3 such that 0 = low job insecurity, 1 = high job insecurity). Assessing the perceived likelihood of losing one’s job, the item captures a cognitive evaluation of job insecurity (Chirumbolo, Urbini & Callea 2020). Comparable single items have been successfully validated in previous research (Matthews, Pineault & Hong 2022). Financial stress was measured with a single item (‘Thinking of your households’ total monthly income, is your household able to make ends meet…?’) on a 6-point scale from 1 = very easily to 6 = with great difficulty (dichotomized at values ≥4 such that 0 = low financial stress, 1 = high financial stress). Analogous to the job insecurity measure, the item captures a cognitive evaluation of employees’ income sufficiency (Sinclair & Cheung 2016), and has been successfully used in previous studies (Kahn & Pearlin 2006). Both perceived job insecurity and financial stress were dichotomized so that all indicators included in the LCA were on the same scale.
Mental well-being. Mental well-being was measured with the WHO-5 Well-Being Index (WHO 1998). The scale consists of five items asking respondents to rate the frequency of positive moods in the past two weeks on a 6-point scale (e.g., ‘I have felt cheerful and in good spirits’, rated from 1 = all of the time to 6 = at no time, reverse-coded so that higher scores indicated better well-being). The WHO-5 Well-Being Index is a widely used measure of subjective well-being, has been validated as a screening tool for depression, and previous research has supported metric invariance across countries (Sischka et al. 2020; Topp et al. 2015). The scale had a good internal consistency in both samples (α = .88 in 2015; α = .81 in 2021).
Training participation. To capture training participation, we created a sum score from three items asking respondents whether or not they had participated in 1) training provided by their employer, 2) training paid for on their own, and/or 3) on-the-job training provided by co-workers or supervisors (0 = no, 1 = yes), such that higher scores reflected more formal learning activities (see Decius et al. 2024). These categories are broadly in line with the typology of workplace learning by Jacobs and Park (2009) that distinguishes on-the-job from off-the-job training, and divides the activity of the organizational facilitator for learning in active (e.g., in the case of employer-paid training), and passive (e.g., in the case of self-paid training). Because the sum score reflects a formative index rather than a reflective construct, we refrained from calculating internal consistency for this measure.
Predictors of class membership. To assess who is more or less likely to experience which economic stressor pattern (as captured in the latent classes), we included the following socio-demographic and work-related measures: Age in years, gender (0 = man, 1 = woman), education (0 = lower-secondary or less, 1 = upper-secondary, 2 = tertiary), migration background (0 = no, 1 = yes if either respondents or one of their parents were born in a different country than the country of residence; only available in 2015), part-time employment (0 = no, 1 = yes), job tenure in years, having a regular second job (0 = no, 1 = yes) having an occasional second job (0 = no, 1 = yes), and occupational status (0 = white collar, 1 = blue collar).
Class prevalence. The prevalence of economic stressor classes as a moderator at the country level was calculated as the percentage of the sample in a given country that was assigned to a particular class (calculated as the country’s mean of the classes’ binary dummy variables, thus ranging from 0 to 1).
Table 1 shows descriptive statistics and bivariate correlations for all study variables in the two samples.
Table 1
Descriptive statistics and bivariate correlations for sample 1 (2015, below diagonal) and sample 2 (2021, above diagonal).
| VARIABLE | 2015 | 2021 | 1 | 2 | 3 | 4 | 5 | 6 | 7 | 8 | 9 | 10 | 11 | 12 | 13 | 14 | 15 | 16 | 17 | ||
|---|---|---|---|---|---|---|---|---|---|---|---|---|---|---|---|---|---|---|---|---|---|
| M | SD | M | SD | ||||||||||||||||||
| 1 Age | 41.73 | 11.58 | 41.14 | 11.60 | – | .05** | –.03** | .02** | –.03** | .56** | .00 | –.04** | –.06** | –.22** | –.09** | –.06** | .02** | .04** | –.05** | ||
| 2 Gender | 0.52 | 0.49 | .02** | – | –.09** | .11** | .18** | .02** | .01 | –.03** | –.15** | .01** | –.00 | –.03** | .05** | –.10** | –.01 | ||||
| 3 Edu: upper-sec. | 0.50 | 0.36 | –.02** | –.04** | – | –.87** | .05** | .03** | –.03** | –.01** | .36** | .03** | .08** | .05** | .14** | .05** | –.10** | ||||
| 4 Edu: tertiary | 0.35 | 0.57 | –.04** | .09** | –.72** | – | –.07** | –.02** | .04** | .02** | –.47** | –.05** | –.11** | –.07** | –.20** | –.07** | .14** | ||||
| 5 Migration backgr.a | 1.14 | –.03** | .00 | –.04** | .01 | – | |||||||||||||||
| 6 Part–time work | 0.18 | 0.15 | –.00 | .22** | –.01 | –.05** | .05** | – | –.03** | .09** | .03** | .05** | .11** | .27** | .04** | .04** | –.02** | –.07** | |||
| 7 Job tenure | 9.45 | 9.48 | 10.41 | 9.51 | .54** | –.02** | –.02** | .03** | –.08** | –.11** | – | –.01** | –.04** | –.08** | –.19** | –.07** | –.09** | –.02** | .02** | –.00 | |
| 8 Regular 2nd job | 0.03 | 0.05 | .01 | .01* | –.03** | .05** | .02** | .05** | –.01* | – | –.04** | –.03** | .01** | –.01 | .00 | –.02** | –.01 | .00 | |||
| 9 Occasional 2nd job | 0.05 | 0.04 | –.05** | –.04** | –.02** | .03** | .02** | .03** | –.05** | –.04** | – | –.01 | .04** | .05** | .03** | .03** | –.01** | –.00 | |||
| 10 Status: blue collar | 0.31 | .05** | –.27** | .15** | –.38** | .04** | –.03** | –.04** | –.03** | –.00 | – | .08** | .12** | .11** | .20** | .07** | –.13** | ||||
| 11 Temporary contract | 0.14 | 0.14 | –.18** | .01 | .01 | –.04** | .05** | .12** | –.30** | .01 | .04** | .06** | – | .12** | .22** | .09** | .01** | –.02** | |||
| 12 Underemployment | 0.12 | 0.10 | –.07** | .05** | .00 | –.07** | .07** | .36** | –.13** | .01 | .06** | .05** | .14** | – | .08** | .12** | .02** | –.05** | |||
| 13 Low earningsa | 0.14 | –.07** | .17** | .04** | –.15** | .05** | .50** | –.18** | .05** | .03** | .04** | .15** | .32** | – | |||||||
| 14 Job insecurity | 2.11 | 1.30 | 1.86 | 1.22 | –.07** | –.02** | .05** | –.09** | .02** | .07** | –.19** | –.03** | .03** | .11** | .30** | .12** | .10** | – | .20** | –.13** | –.09** |
| 15 Financial stress | 3.23 | 1.27 | 2.59 | 1.25 | –.02** | .03** | .10** | –.23** | .01* | .04** | –.12** | –.05** | .02** | .19** | .13** | .13** | .14** | .24** | – | –.19** | –.13** |
| 16 Mental well–being | 4.42 | 1.00 | 4.23 | 1.02 | –.05** | –.05** | –.00 | .03** | –.03** | –.01* | –.01 | .00 | –.01* | –.04** | .00 | –.02** | –.02** | –.13** | –.20** | – | .05** |
| 17 Training part. | 0.80 | 0.88 | 1.01 | 0.83 | –.04** | .02** | –.13** | .25** | .00 | –.04** | .07** | .05** | .02** | –.21** | –.06** | –.05** | –.11** | –.10** | –.20** | .06** | – |
[i] Note. Sample 1 (2015): N = 34,410, sample 2 (2021): N = 60,410. Edu = education. Upper-sec. = upper-secondary. Migration backgr. = migration background. Training part. = Training participation. a not measured in 2021. * p < .05; ** p < .01.
Analysis
The code for all analyses is available at https://osf.io/3d6sj/. Data preparation and descriptive statistics were calculated in R (R Development Core Team 2023). To identify constellations of economic stressors, we calculated a LCA with MPlus 8.1 (Muthén & Muthén 1998–2018), using a maximum likelihood estimator with robust standard errors (MLR) and full-information maximum likelihood (FIML) to compensate for missing values (see Enders 2001). We calculated the latent classes based on the objective and subjective indicators of economic stressors, specifically: having a temporary contract, underemployment, low earnings (only in 2015), perceived job insecurity, and financial stress. To facilitate estimation, all variables were treated as dichotomous, so that all indicators were on the same scale. Thus, the variables were treated as categorical and thresholds for the response categories were calculated. We considered the following criteria to determine the number of latent classes (Jung & Wickrama 2008; Nylund, Asparouhov & Muthén 2007): (1) successful model convergence and replication, (2) Akaike’s Information Criterion (AIC), the adjusted Bayesian Information Criterion (aBIC), and likelihood ratio tests (LMRT, VLMRT and BLRT) as indicators of model fit; (3) entropy and average latent class posterior probabilities (AvePP) as indicators of classification quality; (4) the prevalence of classes (at least 1% of the sample in a single class), and (4) clarity and interpretability of the classes. In terms of model fit, lower values for both AIC and BIC indicate better model fit and should ideally be minimized by one solution. A significant likelihood ratio test indicates that compared to a solution with k-1 latent classes, adding a latent class improves the fit. Higher entropy values indicate better classification quality (Celeux & Soromenho 1996). The AvePP indicates the certainty of assigning an observation to a given class based on posterior probabilities and should be at least 0.70 to be acceptable (Nagin 2005).
To describe the subpopulations of the latent classes in terms of their sociodemographic and work-related characteristics, we used MPlus’ R3STEP approach, which calculates a multinomial regression with the latent classes as dependent variables, while taking into account classification uncertainty (Asparouhov & Muthén 2014a). To test the relationship between economic stressor classes and outcomes, we tested differences between latent classes in mental well-being and training participation using the BCH method implemented in MPlus. The BCH procedure is a weighted multiple group comparison between the latent classes that takes into account the measurement error of the latent class variable (Asparouhov & Muthén 2014b). To test cross-level interaction effects between country-level class prevalence and individual class membership, we calculated multilevel regression models with the R-package lme4 (Bates et al. 2015), using dummy-variables for the different classes as manifest categorical variables.
Results
Latent Classes of Economic Stressors
Table 2 shows the results of the LCA, comparing the solutions for one up to five latent classes (six or more latent classes led to convergence problems and were therefore not considered). In terms of model fit, the LMRT and VLMRT favored the model with three latent classes in sample 1 (2015), indicating that a fourth latent class would not significantly improve the model fit (the BLRT was not informative, as it was significant for all models). Although the AIC decreased with every additional latent class, the decrease became considerably smaller after the three-class model, whereas the BIC reached a minimum at four classes. Considering the overall picture of selection criteria, we selected the model with three latent classes for further analysis, thus opting for the more parsimonious model that also showed acceptable classification quality based on entropy, the AvePP values and the distribution of cases across the latent classes.
Table 2
LCA of economic stressors in sample 1 (2015) and sample 2 (2021).
| k | AIC | aBIC | LMRT | VLMRT | BLRT | ENTROPY | AvePP | CLASS COUNTS/PROPORTIONS |
|---|---|---|---|---|---|---|---|---|
| 2015 | ||||||||
| 1 | 159657.32 | 159683.66 | – | – | – | – | – | 34408 (100%) |
| 2 | 154315.18 | 154373.13 | .000 | .000 | .000 | .487 | .80–.86 | 25751 (74.8%) / 8657 (25.2%) |
| 3 | 153160.25 | 153249.81 | .000 | .000 | .000 | .551 | .67–.87 | 4103 (11.9%) / 8851 (25.7%) / 21454 (62.4%) |
| 4 | 152999.86 | 153121.03 | .301 | .301 | .000 | .554 | .59–.83 | 1358 (4.0%) / 19140 (55.6%) / 3542 (10.3%) / 10368 (30.1%) |
| 5 | 152985.60 | 153138.37 | .001 | .001 | .000 | .688 | .66–.86 | 3334 (9.7%) / 909 (2.6%) / 6074 (17.7%) / 23269 (67.6%) / 822 (2.4%) |
| 2021 | ||||||||
| 1 | 180059.73 | 180083.07 | – | – | – | – | – | 100.0% (60679) |
| 2 | 176404.85 | 176457.37 | .000 | .000 | .000 | .447 | .79–.84 | 51988 (85.7%) / 8691 (14.32%) |
| 3 | 176239.84 | 176321.54 | .000 | .000 | .000 | .694 | .67–.93 | 3148 (5.2%) / 45865 (75.6%) / 11666 (19.2%) |
| 4 | 176240.19 | 176351.06 | .019 | .017 | .077 | .542 | .62–.79 | 38826 (64.0%) / 2467 (4.1%) / 15382 (25.3%) / 4004 (6.6%) |
| 5 | 176250.19 | 176390.24 | .445 | .445 | 1.000 | .463 | .00–.64 | 753 (1.3%) / 51960 (85.6%) / 6729 (11.1%) / 0 (0%) / 1237 (2.0%) |
[i] Note. Final selected solutions in boldface. k = number of latent classes. AIC = Akaike Information Criterion; aBIC = sample size-adjusted Bayesian Information Criterion; LMRT = Lo-Mendell likelihood ratio test; VLMRT = Vuong-Lo-Mendell likelihood ratio test; BLRT = Bootstrapped likelihood ratio test; AvePP, average latent class posterior probabilities.
A clearer picture emerged for sample 2 (2021): The three-class model minimized both the AIC and aBIC, and the BLRT suggested that adding a fourth class would not significantly improve the model fit (the LMRT and VLMRT were still significant with four classes but also showed notable increases in their p-values). In terms of classification quality, the three-class model also had the highest entropy, AvePPs ranging from just under acceptable, to acceptable values, and sufficient distribution of cases across classes. Therefore, we selected the three-class model for further analysis also in sample 2.
Figure 1 illustrates the constellations of economic stressors, and Table 3 shows the distribution of economic stressors across the latent classes in both samples. Note that all variables were dichotomous, so both the y-axes in the figure, as well as the values in the table depict the estimated probability for a given category within the classes as estimated in the LCA. In 2015, over half of the respondents (62%, n = 21,454) were in a class characterized by an overall low likelihood to experience any economic stressor (an exception being slightly heightened financial stress compared to the other indicators), which we labeled low economic stressors. By contrast, a minority of respondents (12%, n = 4,103) had a comparably high likelihood to experience all economic stressors at once and a moderate likelihood to work on a temporary contract, therefore labeled high economic stressors. The third group included about a quarter of respondents (26%, n = 8,851) and was characterized by a low likelihood to have low earnings or be underemployed, a moderate likelihood to have a temporary contract, but comparably high probabilities for perceived job insecurity and financial stress. We labeled this group subjective stressors dominant.
Table 3
Distribution of the latent class indicators across classes in sample 1 (2015) and sample 2 (2021).
| 2015 | 2021 | |||||||
|---|---|---|---|---|---|---|---|---|
| 1) LOW ECONOMIC STRESSORS | 2) HIGH ECONOMIC STRESSORS | 3) SUBJECTIVE STRESSORS DOMINANT | DIFFERENCES BETWEEN CLASSESb | 1) LOW ECONOMIC STRESSORS | 2) HIGH ECONOMIC STRESSORS | 3) SUBJECTIVE STRESSORS DOMINANT | DIFFERENCES BETWEEN CLASSESb | |
| Probability of latent class indicatorsa | ||||||||
| Temporary contract | .04 | .40 | .29 | 1 < 2* 1 > 3* 2 > 3* | .08 | .40 | .24 | 1 < 2* 1 < 3* 2 > 3* |
| Underemployment | .05 | .55 | .06 | 1 < 2* 1 < 3* 2 > 3* | .06 | .44 | .00 | 1 < 2*c |
| Low earnings | .07 | .65 | .03 | 1 < 2* 1 > 3 ns 2 > 3 ns | – | – | – | – |
| Job insecurity: high | .10 | .57 | .79 | 1 < 2* 1 < 3* 2 < 3* | .04 | .54 | 1.00 | 1 > 2c |
| Financial stress: high | .30 | .67 | .59 | 1 < 2* 1 < 3* 2 > 3* | .16 | .50 | .32 | 1 < 2* 1 < 3* 2 > 3* |
[i] Note. a Because all latent class indicators were binary variables, the probability scores represent the relative likelihood to experience each economic stressor (i.e., the variable reaching the value 1). b Differences between classes are based on pairwise comparisons of odds ratios for each indicator variable across latent classes. The significance level was adjusted to p < .016 for three pairwise comparison per latent class indicator. c Due to perfect separation between class 3 (subjective stressors dominant) and the others on underemployment and job insecurity, respectively, no odds ratios could be calculated for pairwise comparisons with class 3 on these variables. * p < .016.
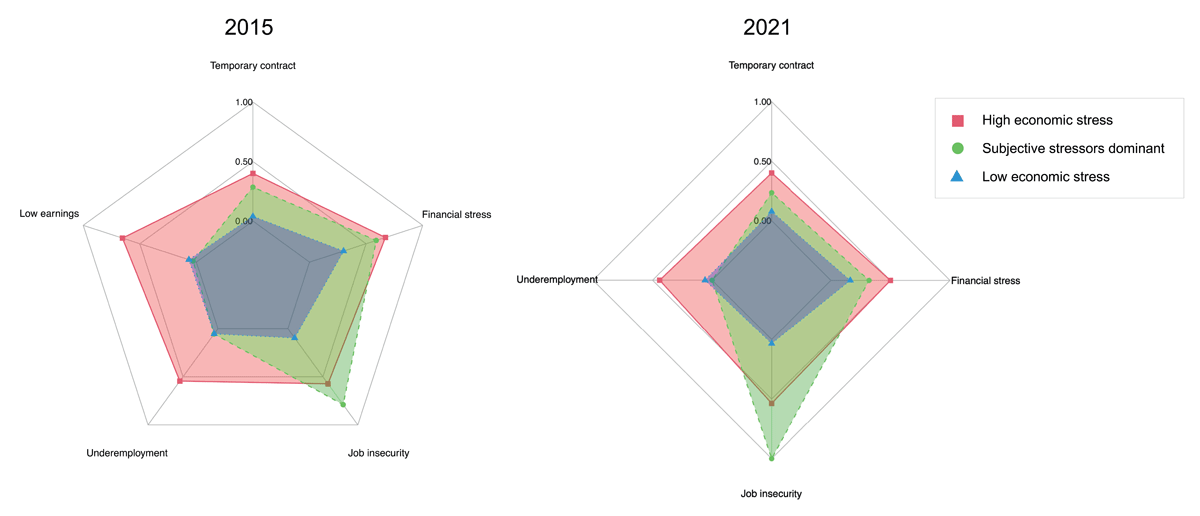
Figure 1
Profiles of economic stressors in 2015 (left) and 2021 (right). The y-axis depicts the likelihood of experiencing each economic stressor relative to not experiencing it.
In 2021 (note that low earnings were not included in the survey that year), a similar pattern emerged: That is, one class characterized by overall low economic stressors, one by overall high economic stressors, and one that could also be labeled subjective stressors dominant, since especially perceived job insecurity was highly likely for this class, to a lesser extent financial stress, whereas the risk for objective economic stressors was low. The low economic stressors class had a higher prevalence in 2021 (75%, n = 45,865), whereas the high economic stressors class was less prevalent (5%, n = 3,148), as was the subjective stressors dominant class (20%, n = 11,666). Regarding our research question, three latent classes reflecting distinct patterns of economic stressors could be identified and were highly similar across the two samples.
Table 3 also includes pairwise comparisons between the latent classes on the economic stressor variables based on odds ratios of a given category within the classes (we adjusted the significance level to p < .016 for three comparisons on each indicator). Almost all class differences were significant, with the following exceptions: In 2015, the subjective stressors dominant class did not differ from the other two on the likelihood of low earnings. In 2021, due to perfect separation in the subjective stressors dominant class on underemployment and job insecurity, respectively, odds ratios could not be calculated, and this class could not be compared to the other two (note the relative likelihood of .00 for underemployment and 1.00 for job insecurity). Altogether, the results suggests that the LCA produced meaningful patterns based on groups of respondents who were similar to one another, while different from the other groups in their scorings on economic stressors.
Although similar three-class solutions emerged in 2015 and 2021, we further want to emphasize that this conceptual replication must be interpreted with caution. The 2021 latent-class model did not contain the earnings indicator that formed part of the 2015 solution. Consequently, class boundaries in 2021 may under-represent income-related economic stress, particularly within the high-economic-stressors class. We therefore treat the two solutions as conceptually similar—but not measurement-identical—representations of economic stress profiles.
Predicting Latent Class Membership
Using the R3STEP procedure, we calculated the respective odds of belonging to the high economic stressors class and to the subjective stressors dominant class relative to the low economic stressors class based on age, gender, migration background, part-time employment, education, multiple job holding and occupational status via multinomial regression (see Table 4). In 2015, employees in the reference class of low economic stressors were on average 43 years old (M = 42.61, SD = 11.29), just over half of them were women (52%, 48% men), 13% had a migration background, most had completed upper secondary (48%) or tertiary education (39%), 14% worked part-time, very few had multiple jobs (3% had a regular second job, 4% an occasional second job), and 27% were blue-collar workers. The sociodemographic profile was similar in 2021: Employees in the low economic stressors class were on average 42 years old (M = 41.70, SD = 11.47), half of them were women (50%), 14% worked part-time, a minority had multiple jobs (5% had a regular second job, 3% an occasional second job) and 24% were blue-collar workers. Only with regards to education, more employees in the 2021 low economic stressors class had completed tertiary education (60%) compared to 2015 (34% upper secondary, 6% primary or none).
Table 4
Determinants of latent class membership in sample 1 (2015) and sample 2 (2021).
| PREDICTOR | HIGH ECONOMIC STRESSORS | SUBJECTIVE STRESSORS DOMINANT | ||||
|---|---|---|---|---|---|---|
| M (SD) / % | OR | 95%-CI | M (SD) / % | OR | 95%-CI | |
| 2015 | ||||||
| Age | 38.69 (12.84) | 0.99** | [0.98; 1.00] | 41.02 (11.36) | 1.01*** | [1.01; 1.02] |
| Gender: woman | 65% | 1.49*** | [1.24; 1.79] | 47% | 0.96 | [0.87; 1.05] |
| Migration background | 19% | 1.17 | [0.95; 1.44] | 14% | 0.96 | [0.85; 1.09] |
| Education | ||||||
| Upper secondary | 53% | 0.37*** | [0.30; 0.47] | 52% | 0.92 | [0.80; 1.05] |
| Tertiary | 20% | 0.15*** | [0.12; 0.19] | 31% | 0.69*** | [0.59; 0.80] |
| Part-time employment | 63% | 28.62*** | [24.04; 34.07] | 10% | 0.22*** | [0.14; 0.35] |
| Job tenure | 4.50 (6.69) | 0.83*** | [0.80; 0.86] | 7.63 (8.91) | 0.92*** | [0.91; 0.92] |
| Multiple jobs | ||||||
| Regular 2nd job | 4% | 0.75 | [0.49; 1.12] | 2% | 0.52*** | [0.38; 0.73] |
| Occasional 2nd job | 8% | 2.41*** | [1.75; 3.33] | 5% | 1.18 | [0.97; 1.44] |
| Occ. status: blue collar | 38% | 1.81*** | [1.49; 2.22] | 36% | 1.59*** | [1.43; 1.77] |
| 2021 | ||||||
| Age | 36.94 (12.21) | 1.00 | [0.99; 1.00] | 40.74 (11.44) | 1.01*** | [1.01; 1.02] |
| Gender: woman | 51% | 0.64*** | [0.54; 0.76] | 46% | 0.91** | [0.85; 0.97] |
| Education | ||||||
| Upper secondary | 49% | 0.85 | [0.65; 1.11] | 39% | 1.02 | [0.88; 1.17] |
| Tertiary | 38% | 0.51*** | [0.39; 0.68] | 54% | 0.99 | [0.85; 1.14] |
| Part-time employment | 50% | 10.34*** | [8.74; 12.24] | 12% | 0.25*** | [0.18; 0.36] |
| Job tenure | 6.82 (7.32) | 0.93*** | [0.91; 0.94] | 9.16 (8.82) | 0.97*** | [0.97; 0.97] |
| Multiple jobs | ||||||
| Regular 2nd job | 4% | 0.48*** | [0.33; 0.70] | 5% | 1.16* | [1.00; 1.34] |
| Occasional 2nd job | 6% | 2.49*** | [1.85; 3.35] | 4% | 1.22* | [1.03; 1.46] |
| Occ. status: blue collar | 48% | 2.42*** | [2.05; 2.86] | 34% | 1.56*** | [1.44; 1.69] |
[i] Note. N = 32,456 for sample 1 (2015); N = 52,596 for sample 2 (2021) due to listwise deletion of missing values. Reference category: Low economic stressors. Occ. status = occupational status. * p < .05; ** p < .01; *** p < .001.
Table 4 shows descriptive statistics and odds ratios for the other two latent classes of high economic stressors and subjective stressors dominant, respectively. In 2015, by comparison to low economic stressors, employees in the high economic stressors class were younger (OR = 0.99, 95% CI [0.98; 0.997], p = .009), more often women (OR = 1.49, 95% CI [1.24; 1.79], p < .001), were less likely to have upper secondary (OR = 0.37, 95% CI [0.30; 0.47], p < .001) or tertiary education (OR = 0.15, 95% CI [0.12; 0.19], p < .001), worked more often part-time (OR = 28.62, 95% CI [24.04; 34.07], p < .001), in occasional second jobs (OR = 2.41, 95% CI [1.75; 3.33], p < .001), in blue-collar jobs (OR = 1.81, 95% CI [1.49; 2.22], p < .001), and had shorter job tenure (OR = 0.88, 95% CI [0.80; 0.86], p < .001).
In 2021, employees in the high economic stressors class were also less likely to have tertiary education (OR = 0.51, 95% CI [0.39; 0.68], p < .001), worked more often part-time (OR = 10.34, 95% CI [8.74; 12.24], p < .001), had occasional second jobs (OR = 2.49, 95% CI [1.85; 3.35], p < .001), more often blue-collar jobs (OR = 2.42, 95% CI [2.05; 2.86], p < .001), and shorter job tenure (OR = 0.93, 95% CI [0.91; 0.94], p = .002) than those with low economic stressors. In contrast to 2015, women were less likely in the high economic stressors class, and employees worked less often in regular second jobs (OR = 0.48, 95% CI [0.33; 0.70], p < .001).
Regarding the subjective stressors dominant latent class, employees belonging this group in 2015 were slightly older (OR = 1.01, 95% CI [1.01; 1.02], p < .001), less likely to have tertiary education (OR = 0.69, 95% CI [0.59; 0.80], p < .001), to work part-time (OR = 0.22, 95% CI [0.14; 0.35], p < .001), to have regular second jobs (OR = 0.52, 95% CI [0.38; 0.73], p < .001), more likely to have blue-collar jobs (OR = 1.59, 95% CI [1.43; 1.77], p < .001), as well as shorter job tenure (OR = 0.91, 95% CI [0.91; 0.92], p < .001) than the low economic stressors group.
Similarly, in 2021, employees in the subjective stressors dominant class were slightly older (OR = 1.01, 95% CI [1.01; 1.02], p < .001), less likely women (OR = 0.91, 95% CI [0.85; 0.97], p = .006) and less likely to have a tertiary degree (OR = 0.25, 95% CI [0.18; 0.36], p < .001). They were also less likely part-time workers (OR = 0.25, 95% CI [0.18; 0.36], p < .001), more likely blue-collar workers (OR = 1.56, 95% CI [1.44; 1.69], p < .001) and had a shorter job tenure (OR = 0.97, 95% CI [0.97; 0.97], p < .001) than those with low economic stressors. In contrast to 2015, employees in this group were more likely to work in both regular (OR = 1.16, 95% CI [1.00; 1.34], p = .049) and occasional (OR = 1.22, 95% CI [1.03; 1.46], p = .025) second jobs. However, differences regarding multiple jobs should be interpreted very carefully in both samples due to very low base rates.
Differences Between Economic Stressor Classes in Well-being and Training Participation
Using the BCH procedure, we compared the respective means of mental well-being and training participation across the three latent classes. Both in 2015 and 2021, the low economic stressors class reported the highest mental well-being (M2015 = 4.54, SE = 0.08; M2021 = 4.29, SE = 0.01), followed by the high economic stressors class (M2015 = 4.29, SE = 0.23; M2021 = 4.15, SE = 0.02), whereas the subjective stressors dominant class reported the lowest scores (M2015 = 4.22, SE = 0.17; M2021 = 3.93, SE = 0.02). The overall χ2 tests indicated that the three latent classes differed significantly from one another (χ22015 = 312.34, p < .001; χ22021 = 569.55, p < .001). Furthermore, the pairwise group comparisons indicated that all three latent classes differed significantly from each other (low vs. high economic stressors: χ22015 = 103.32, p < .001, d2015 = .20,1 χ22021 = 31.47, p < .001, d2021 = .11; low economic stressors vs. subjective stressors dominant: χ22015 = 224.38, p < .001, d2015 = .20, χ22021 = 448.72, p < .001, d2021 = .27; high economic stressors vs. subjective stressors dominant: χ22015 = 4.25, p = .039, d2015 = .01, χ22021 = 42.39, p < .001, d2021 = .15). The results partially support Hypothesis 1: As expected, experiencing high economic stressors was associated with lower mental well-being than low economic stressors. Effect sizes for class differences were mostly in the small range. The high economic stressors class and the subjective stressors dominant class also had relatively similar well-being scores, particularly in 2015, even though the former experienced altogether more economic stress than the latter. Although statistically significant, the differences between these two groups were very small in magnitude, in 2015 even close to zero, and should be interpreted with great caution regarding their practical significance.
The results for training participation were also similar in both samples: The low economic stressors class reported the highest level of training participation (M2015 = 0.92, SE = 0.01; M2021 = 1.08, SE = 0.01), followed by the subjective stressors dominant class (M2015 = 0.71, SE = 0.01; M2021 = 0.89, SE = 0.02), whereas the high economic stressors class reported the lowest training participation (M2015 = 0.46, SE = 0.02; M2021 = 0.78, SE = 0.02). The overall χ2 test for mean differences was significant (χ22015 = 689.25, p < .001; χ22021 = 382.16, p < .001), as were all specific group comparisons (low vs. high economic stressors: χ22015 = 618.01, p < .001, d2015 = .34, χ22021 = 159.49, p < .001, d2021 = .34; low economic stressors vs. subjective stressors dominant: χ22015 = 137.86, p < .001, d2015 = .15, χ22021 = 134.85, p < .001, d2021 = .15; high economic stressors vs. subjective stressors dominant: χ22015 = 103.68, p < .001, d2015 = .19, χ22021 = 11.93, p < .001, d2021 = .19). Hypothesis 2 was supported such that the more economic stressors characterized the latent classes, the lesser employees participated in training. Effect sizes suggested that the group differences were rather small in magnitude.
Class Prevalence as a Moderator
Finally, we calculated a multilevel regression analysis of well-being and training participation on individual-level class membership, country-level class prevalence, as well as their cross-level interactions. We proceeded as follows (see Aguinis et al. 2013): First, we estimated null models to assess the share of outcome variance attributable to the country level. Intraclass coefficients indicated that 2–5% of the variance in well-being and 5–9% of the variance in training participation could be attributed to the country level (Well-being: ICC2015 = .02, p = .134; ICC2021 = .05, p < .001; Training participation: ICC2015 = .09, p < .001; ICC2021 = .03, p = .002). Thus, a small share of variance in the outcomes occurs between countries, which justifies multilevel analysis (Bliese, Maltarich & Hendricks 2018).
Second, we estimated fixed-effects models with high economic stressors and subjective stressors dominant as dummy variables on both levels, thus making low economic stressors the reference category to compare the others to. Country-level class prevalences of both high economic stressors and subjective stressors dominant were entered as continuous predictors and centered at the grand mean, thus reflecting to which extent each class was more or less common in a given country compared to the other countries. For individual latent class membership, we used binary dummy variables which were not centered (see Nezlek 2012), thus simply reflecting whether a person experienced a given pattern of economic stress or not.
Third, we added random slopes for both the high economic stressors dummy variable and the subjective stressors dominant dummy variable to test whether there was significant variation in the relationships between latent class membership and outcomes on the individual level. This is an important precondition for examining cross-level interactions (i.e., there should be some variation in the Level 1 effect to be explained by a Level 2-moderator; Aguinis et al. 2013; Heisig & Schaeffer 2019). On mental well-being, we found significant variation in the individual slopes for subjective stressors dominant (σ22015 = .01, p < .001; σ22021 = .002, p = .019), as well as a tendency of p < .10 for high economic stressors (σ22015 = .01, p = .058; σ22021 = .01, p = .096) in both samples. On training participation, there was significant slope variation for high economic stressors in 2015 and 2021 (σ22015 = .01, p = .002; σ22021 = .01, p = .001) and subjective stressors dominant in 2015 (σ22015 = .003, p < .001), but not in 2021. The preconditions for testing cross-level interactions were thus partly fulfilled (Heisig & Schaeffer 2019).
Fourth, we added the interaction terms between country-level class prevalence and individual-level class membership. Table 5 shows the final models. Regarding the main effects, the results on the individual level replicate the BCH procedure such that employees in the high economic stressors class and those in the subjective stressors dominant class each reported lower mental well-being and lower training participation relative to low economic stressors, both in 2015 and 2021. That is, employees with these patterns reported lower well-being and training participation than those with low economic stress. On the country level, a higher prevalence of the subjective stressors dominant class was associated with overall lower training participation in 2015 (b = –1.15, SE = .34, p = .003) and in 2021 (b = -.71, SE = .33, p = .048). That is, in countries where this pattern was more common, people participated on average in fewer training activities compared to countries where subjective stressors dominant were less prevalent.
Table 5
Multilevel regression results with random slopes for latent class membership and cross-level interactions between latent class membership and country-level class membership in sample 1 (2015) and sample 2 (2021).
| PREDICTOR | 2015 | 2021 | ||||||
|---|---|---|---|---|---|---|---|---|
| MENTAL WELL-BEING | TRAINING PARTICIPATION | MENTAL WELL-BEING | TRAINING PARTICIPATION | |||||
| b | SE | b | SE | b | SE | b | SE | |
| Level 2: Country | ||||||||
| Prevalence high economic stressors | .01 | .65 | –.40 | .78 | 2.51 | 2.24 | –2.03 | 1.28 |
| Prevalence subjective stressors dominant | –.12 | .30 | –1.15** | .34 | .82 | .59 | –.71* | .33 |
| Level 1: Individual | ||||||||
| High economic stressors | –.22*** | .02 | –.30*** | .02 | –.16*** | .03 | –.22** | .03 |
| Subjective stressors dominant | –.22*** | .02 | –.08*** | .02 | –.30*** | .02 | –.15*** | .01 |
| Cross-level interactions | ||||||||
| Prevalence × high economic stressors | 1.31** | .45 | –.13 | .42 | 2.24† | 1.22 | 1.61 | 1.41 |
| Prevalence × subjective stressors dominant | .27 | .22 | .10 | .15 | .20 | .18 | .06 | .16 |
[i] Note. N = 34,339 for well-being and N = 34,267 for training participation in sample 1 (2015); N = 60,589 for well-being and N = 40,785 for training participation in sample 2 (2021). Reference category for latent class membership/prevalence: Low economic stressors. † p < .10; * p < .05; ** p < .01; *** p < .001.
As can be seen in Table 5, the only significant interaction occurred between the country prevalence of the high economic stressors class and individual membership in this class on mental well-being in 2015 (b = 1.31, SE = .45, p = .001). This effect was replicated in 2021, but only at p < .10 (b = 2.24, SE = 1.22, p = .070), whereas country-level prevalence did not moderate any other effects of individual-level class membership. Figure 2 illustrates the interaction between individually belonging to the high economic stress class and a high prevalence of this class in terms of simple slopes: Contrary to our expectations, the negative relationship between individually experiencing high economic stressors on mental well-being was slightly weaker (instead of stronger), the more common this class was in a country. Note, however, that this effect was very small (we cropped the range on the y-axis in the figure to 4–5 to make differences between the slopes visible; the full range of mental well-being was 1–6). Hypothesis 3 was not supported.
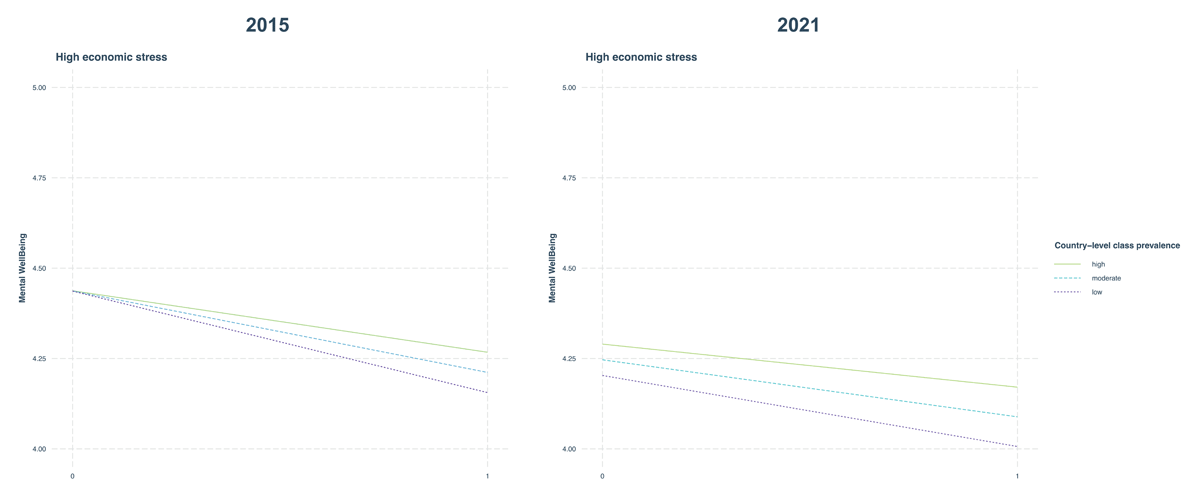
Figure 2
Cross-level interaction between country-level prevalence of high economic stressors and individual high economic stressors on mental well-being in 2015 (left) and 2021 (right). Scale on the y-axis is cropped to 4–5 for illustrative purposes (the full scale for mental well-being was 1–6).
It should be noted that random slope variances near zero led to estimation problems in some instances. Specifically, when testing the preconditions of cross-level interactions, the main effects model with a random slope for subjective stressors dominant failed to converge. However, the final models with interactions in Table 5 converged successfully. The final model on well-being in 2015 (Table 5) led to singular model fit. We therefore checked that estimating separate models with only one cross-level interaction at a time led to the same pattern of results, without singularity problems. Nevertheless, the results of the multilevel regressions should be interpreted with great caution, because there was very little variance in the random slopes to be explained by the country-level moderators.
Discussion
The aim of this study was to take a holistic view on economic stressors and how they relate to employee well-being and behavior by identifying latent classes of economic stressors, linking them to mental health and training participation, and considering class prevalence as a moderator. Our findings contribute to a growing body of literature that moves from considering specific aspects such as job insecurity to the whole spectrum of economic stress (Bazzoli, Probst & Lee, 2021; Bazzoli, Probst & Tomas 2022; Probst 2005; Probst et al. 2018), as well as understudied outcomes related to learning and development (Van Hootegem et al. 2019, 2023a, 2023c). Looking at the impact of class prevalence delivers novel insights on macrolevel contextual effects in the relationship between economic stress and individual outcomes (Fullerton et al. 2020; Probst et al. 2018; Sinclair et al. 2010).
Contributions and Suggestions for Future Research
Regarding our first research question, we identified three latent classes of economic stressors: low economic stressors, high economic stressors, and subjective stressors dominant. These classes were associated with characteristic sociodemographic profiles as well as distinctive relationships with mental well-being and training participation, which underscores that they capture meaningful heterogeneity among workers in terms of qualitative differences in how they experience economic stress (Bergman & Lundh 2015; M. Wang et al. 2013). We took an exploratory approach to identifying the latent classes, as neither theory nor empirical evidence suggested a priori hypotheses about a specific number and pattern of economic stressors. Our study was thus not strictly theory-driven, as has been recommended for the application of latent class analysis (Spurk et al. 2020). However, the collection of economic stressors included in the analysis reflect the full spectrum, and map onto the theoretical framework of economic stressors (Probst 2005; Voydanoff 1990), as well as conceptualizations of work precarity (Allan, Autin & Wilkins-Yel 2021). Therefore, our analysis was theory-driven to the extent that the class indicators reflected theoretically related, yet distinct concepts that justified expecting heterogenous patterns in the population (see Spurk et al. 2020).
In both 2015 and 2021, most employees across Europe experienced overall low economic stressors: They faced a low risk of objective economic instability and, accordingly, perceived less job insecurity and financial stress compared to other classes. Examining their sociodemographic profile, this group largely represents those identified in the literature as labor market insiders (see Biegert 2019; Gallie 2000), that is, middle-aged, qualified employees, most of whom worked full-time in stable jobs. The smallest class in both samples experienced consistently high economic stressors: Compared to the other two classes, these workers faced the highest risks of all objective economic stressors, the highest levels of financial stress, and the second-highest levels of job insecurity in both samples. In contrast to those with low economic stressors, this class comprised people typically in outsider positions, such as younger employees, those with low education, part-time workers, with shorter tenure, blue-collar workers and individuals holding multiple jobs (see Autor 2011; Biegert 2019; Biemann, Zacher & Feldman 2012; Gallie 2000; Landsbergis, Grzywacz & LaMontagne 2014; Scherer 2001). These first two classes replicate earlier person-oriented research (Bazzoli, Probst & Tomas 2022; Van Aerden et al. 2014) and support theoretical accounts of the dualization of labor markets into a well-protected core of insiders and a smaller share of precarious outsiders at the periphery (see King & Rueda 2008).
Extending the duality between precarious and non-precarious workers, we also identified a third class, subjective stressors dominant, characterized by objectively low but subjectively high perceptions of economic stressors, particularly in terms of financial stress and job insecurity. In contrast to the low economic stressors class, this group was less qualified, had shorter job tenure, and more frequently held multiple jobs. They were also slightly older, more often men (but only in 2021), more often blue-collar workers and more likely to work full-time than those in the low economic stressors class. The emergence of this class could be interpreted as reflecting accounts of declining middle-paid, routine jobs and deteriorating working conditions among lower-skilled men who no longer earn family wages (Autor 2011; Gerlitz 2023; Goos, Manning & Salomons 2009). Although they may be (just) above the cutoffs on objective indicators of economic instability, they may experience a high degree of stress and fear related to economic decline. More detailed analyses, preferably with a qualitative approach would be needed to confirm such an interpretation of this pattern. In general, this pattern reflects the heterogeneous and multidimensional nature of precarity, supporting theoretical distinctions between objectively precarious work and subjective experiences of precarity (Allan, Autin & Wilkins-Yel 2021). While the odds ratios suggested that older employees were more likely to fall into this group, the actual differences in average age were small (e.g., 37 vs. 41 years in 2021). This suggests that the age pattern may reflect subtle differences in perceived stress rather than meaningful differences tied to age or career progression.
Gender differences between the three classes were rather inconsistent: Women were more likely than men to experience high economic stressors in 2015, but less likely in 2021. Men were more likely to experience the subjective stressors dominant pattern, but only in 2021 (this pattern did not differ between the genders in 2015). On the descriptive level, the gender distribution among those with low economic stressors was fairly even. One reason for these inconsistencies may be that labor market and career disadvantages for women are typically tied to motherhood (Benard & Correll 2010; Budig & England 2001; Hipp 2020), and our analysis did not include employees’ parental status. A more differentiated analysis might reveal a higher risk of economic stress specifically for mothers compared to men and childless women (see Klug, Drobnič & Brockmann 2019; Klug & Drobnič 2025).
While greater economic stress was generally associated with lower mental well-being, as expected (Hypothesis 1), the high economic stressors and subjective stressors dominant classes reported similar well-being levels in 2015, with an effect size close to zero. In 2021, the subjective stressors dominant class reported lower mental well-being than the high economic stressors class and the difference was more pronounced than in 2015. Still, the effect size was below the threshold of being considered practically significant. In sum, these two classes did not really differ from one another, even though the high economic stressors class had accumulated more stressors altogether (i.e., both objective and subjective). This pattern suggests that subjective stressors can be just as important as objective stressors, which aligns with stress-theoretical approaches that emphasize subjective appraisals (e.g., Lazarus & Folkman 1984), as well as previous research highlighting consistent negative health effects of subjective economic stress (De Witte & Näswall 2003; Helbling & Kanji 2018; Klandermans, Klein Hesselink & van Vuuren, 2010; Klug 2020; Sora et al. 2019).
This finding may also reflect stronger experiences of relative deprivation in the subjective stressors dominant class. For low-earning, underemployed, temporary, or part-time employees, experiencing high financial stress and job insecurity may seem like expected reactions to their objective situation, or more of a ‘normative experience’ (see Brand 2015). In contrast, perceived financial stress or job insecurity may feel even more unjust to those who put in full-time hours and earn average wages. Future research could further explore potential discrepancies between objective and subjective economic stressors and examine competing theoretical mechanisms, such as resource deprivation versus justice-based mechanisms (see Griep et al. 2021).
The findings regarding training participation were more straightforward, indicating that the greater the economic stress reflected in the latent classes, the lower the participation in training (Hypothesis 2). The high economic stressors group reported the lowest levels, likely due to both fewer opportunities for training in precarious jobs and psychological mechanisms that hinder work-related learning and development (Bassanini et al. 2007; Van Hootegem et al. 2023a). The findings are in line with the agency perspective (Fryer 1994), as well as COR theory’s prediction that resource loss complicates the proactive mobilization and accumulation of resources (Hobfoll 2001; Hobfoll et al. 2018). Fryer’s agency approach thereby adds a motivational dimension to COR theory, explaining why workers under economic pressure may engage less in future-oriented activities such as workplace learning, even if they recognize its importance. Our findings further emphasize the importance of exploring how economic stress may impact learning and development at work—outcomes that have received little research attention so far. Inability to keep one’s skills up to date may contribute to further loss spirals, which can exacerbate economic stress (Knipprath & De Rick 2014; Van Hootegem et al. 2019).
Regarding contextual effects, we found rather weak evidence of the prevalence of economic stress patterns moderating individual effects (Hypothesis 3). Opposite to what we expected, the only interaction we found was for high economic stressors on mental well-being, and such that a high prevalence of high economic stressors buffered rather than exacerbated the individual-level association with mental well-being. This pattern supports the relative deprivation perspective over the resource-based argument of environmental constraints (see Probst et al. 2017 for a review of theoretical perspectives). However, this result should be interpreted with great caution, as the effect was non-significant in 2021, and the practical relevance of its small magnitude may be questionable. Nevertheless, there was a little variation in the association between class membership and outcomes that warrants further exploration. Future research could investigate other macro-level moderators that might be more pertinent, such as the economic climate, policies, or measures that reflect inequality in the distribution of economic stressors (see Fullerton et al. 2020; Otto et al. 2016; Probst & Jiang 2017).
In addition to examining longitudinal dynamics, future research could aim to validate the identified economic stressor classes across different national contexts and over time, to assess their stability and generalizability. Cross-national validation efforts could reveal whether certain class structures are universal or context-specific, and whether structural labor market characteristics or welfare regimes coincide with how stressors cluster. Moreover, the use of longitudinal person-centered designs could allow researchers to explore transitions between classes, identifying which workers are at greater risk of accumulating stressors over time and what factors help buffer such transitions.
Future research could also examine how policy measures, such as the social safety net, shape both the distribution and consequences of economic stressor classes. The social safety net refers to labor market regulations and social security systems that provide income continuity or access to essential services during periods of unemployment, illness, disability, parenting, or retirement (Debus et al. 2012). While much policy and research attention has focused on unemployment, other forms of economic stress, such as underemployment or job insecurity, receive considerably less support (Probst 2005). This uneven focus reflects a broader trend of prioritizing short-term fixes over long-term prevention, with limited infrastructure to support workers facing chronic instability (Probst 2005). Still, prior studies suggest that generous social protection may buffer negative responses to job insecurity (Debus et al. 2012; Sjöberg 2010; Sverke et al. 2019). Building on these findings, future research could explore how both objective and perceived policy supports influence the experience of economic stress more broadly.
Strengths and Limitations
This study has some limitations to keep in mind, but these are accompanied by several strengths. First, the cross-sectional analysis does not allow conclusions about causal effects of economic stressors on mental well-being and training participation. Reverse causality in terms of poor mental health or lack of skill development leading to selection into precarious jobs is certainly plausible (Benach et al. 2016; Rönnblad et al. 2019). However, our main aim in the logic of the person-oriented approach was not to establish causality, but to capture robust and meaningful patterns of heterogeneity in workers’ experience of economic stress (see Bergman & Lundh 2015). Cross-sectional data is also less of a problem for moderation analysis, where our main aim was to test whether the strength of the association between latent class membership and outcomes varies according to class prevalence (see Spector 2019). The fact that our results, both regarding the patterns of economic stressors and their relations with outcomes, replicate across two samples in different time periods (pre- and post-pandemic) is a clear strength supporting the robustness of our findings. Nevertheless, future research could apply longitudinal designs which, in addition to addressing causality, could also delve into the temporal dynamics of stressor-outcome relations and patterns of accumulation of economic stress over time (see Kinnunen et al. 2014; Klug, Drobnič & Brockmann, 2019; Van Hootegem et al. 2021).
The second limitation concerns the measurement of relevant constructs, which were all based on employees’ self-reports and, in the case of job insecurity and financial stress, single items. This is not a problem for the objective economic stressors but may introduce common method variance (Podsakoff et al. 2003) and reduce the reliability of perceived job insecurity and financial stress. Moreover, information on earnings were not available in the 2021 EWCS, so that the two latent class analyses were not based on identical sets of variables. Earnings constitute a key objective marker of income deprivation; their omission means that the 2021 classes rest on a narrower indicator set than the 2015 classes. We thus cannot rule out subtle shifts in class composition, as the number and quality of observed indicators largely influence latent class enumeration and parameter estimation accuracy, underscoring the need for replication in an independent cohort when indicators change (Sinha, Calfee & Delucchi, 2021; Wurpts & Geiser 2014). Readers should therefore interpret any cross-wave comparison of prevalence or class-specific effects with appropriate caution, recognizing the potential under-representation of income-related stress in the later wave. However, previous research has successfully used and validated single items of job insecurity and financial stress (Kahn & Pearlin 2006; Klug, Selenko & Gerlitz, 2021; Matthews, Pineault & Hong 2022). The positive bivariate correlations with objective economic stressors in our study further support the validity of these items. On the other hand, the broad range of economic stressors, both objective and subjective, is a strength of the study design which allowed us to cover the full theoretical framework of economic stress (Voydanoff 1990), thus presenting a holistic picture of workers’ experience.
A third limitation is that our study population was restricted to employees, even though unemployment is also an important economic stressor and unemployed persons experience other stressors such as financial hardship (e.g., McKee-Ryan et al. 2005). Moreover, cycling between precarious work and unemployment is a common precarity experience that our analysis was unable to capture (see Probst 2005; Rubery et al. 2018). Our goal was to account for as wide a range of economic stressors as possible, specifically, to include both the income-related dimension and different aspects of the employment-related dimension. Including aspects of the employment relationship, such as temporary contracts or perceived job insecurity precluded a simultaneous inclusion of unemployment in a cross-sectional approach. As a result, we may even have underestimated the prevalence and severity of economic stressors, as well as their relationship with well-being. More dynamic, longitudinal analyses over longer periods of time would allow broadening the population from employees to all adults of working age and accounting for unemployment experiences as well (see Klug, Drobnič & Brockmann 2019; Klug & Drobnič 2025).
A fourth limitation concerns the multilevel analysis, as both the country-level sample size and the random slope variation across countries were rather small. Statistical power may thus be part of the reason why we did not detect strong and consistent contextual effects despite the large individual-level samples (see Mathieu et al. 2012). Nevertheless, the country-representative random samples remain a notable strength of the study, allowing us to explore contextual effects and to generalize our findings across different cultures and welfare regimes within Europe.
A final limitation relates to our inability to distinguish between voluntary and involuntary forms of temporary employment. While temporary work is often associated with reduced access to employment protections and long-term stability, some individuals may opt for such contracts due to preferences for flexibility, variety, or skill development. The inability to account for this heterogeneity in employment motivation may have obscured differences in how temporary employment relates to well-being and training participation. Future studies could address this by including measures that differentiate between voluntary and involuntary contract arrangements.
Practical Implications
This study illustrates the heterogeneous experience of economic stress among European workers and underscores the need to address consequences for their mental well-being and professional development. Our latent class analysis suggested that typical labor market outsiders, such as women, part-time- and low-qualified workers (Biegert 2019; Biemann, Zacher & Feldman, 2012; Landsbergis, Grzywacz & LaMontagne 2014) are vulnerable to economic stress. But low-qualified, male, full-time blue-collar workers (e.g., those in routine industrial jobs) also appeared as an important target group susceptible to perceptions of economic stress, especially in terms of job insecurity (see Gerlitz 2023; Goos, Manning & Salomons 2009).
To tackle the root causes, primary prevention efforts would be required from policy makers and organizations to reduce economic stress among workers by improving access to resources, for example, by setting standards on living wages and on protections for temporary workers, preventing underemployment, or offering subsidies to buffer economic crises (see Sinclair et al. 2010; Smith 2015). At the organizational level, employee participation can reduce job insecurity perceptions (Abildgaard, Nielsen & Sverke 2018), whereas fringe benefits (e.g., subsidizing childcare, transportation, or meals) may alleviate financial stress. Such measures could be flanked by secondary prevention efforts to help employees cope with economic stressors, for example with a focus on career development or financial counseling (see Sinclair et al. 2010).
Training should be a particular focus, as workers experiencing economic stress could greatly benefit from it, yet they face both structural and individual barriers to participation. First, organizations should increase the availability of training opportunities and raise awareness among economically stressed workers about these opportunities, actively encouraging their participation (Van Hootegem et al. 2023a). Governments can also play a role by sponsoring or subsidizing external training for labor market outsiders whose employers invest less in their development, thereby strengthening their position. Second, organizations can provide informal learning opportunities and create stimulating working conditions to enhance employees’ self-efficacy and employability, particularly for those with limited educational credentials who may be hesitant due to negative experiences in the formal education system (Decius et al. 2021; Decius, Knappstein & Klug 2024; Kyndt et al. 2013; Proost, van Ruysseveldt & van Dijke 2012; Sanders et al. 2011; Van Hootegem et al. 2023a).
Conclusion
Taking a comprehensive perspective on economic stressors, this study extends the duality of precarious versus non-precarious employment by uncovering three distinct patterns of economic stressors among European employees: Low economic stressors, high economic stressors and subjective stressors dominant. The results suggest that these patterns are not only associated with impaired mental well-being but also reduced training participation. Concerted efforts from governments and organizations to target vulnerable groups and foster both structural and psychosocial resources would be required to protect worker well-being and encourage professional development, thereby helping workers to cope with economic stress, but also preventing loss spirals and the solidification of precarity.
Notes
Competing Interests
The authors have no competing interests to declare.
Author contributions
All three authors collaboratively developed the research question and hypotheses. Katharina Klug conducted the analysis, while the analytical strategy and interpretation of results was discussed and decided collaboratively among the three authors. Katharina Klug produced the first draft of the manuscript; Julian Decius and Anahí Van Hootegem both contributed to revising the manuscript.