
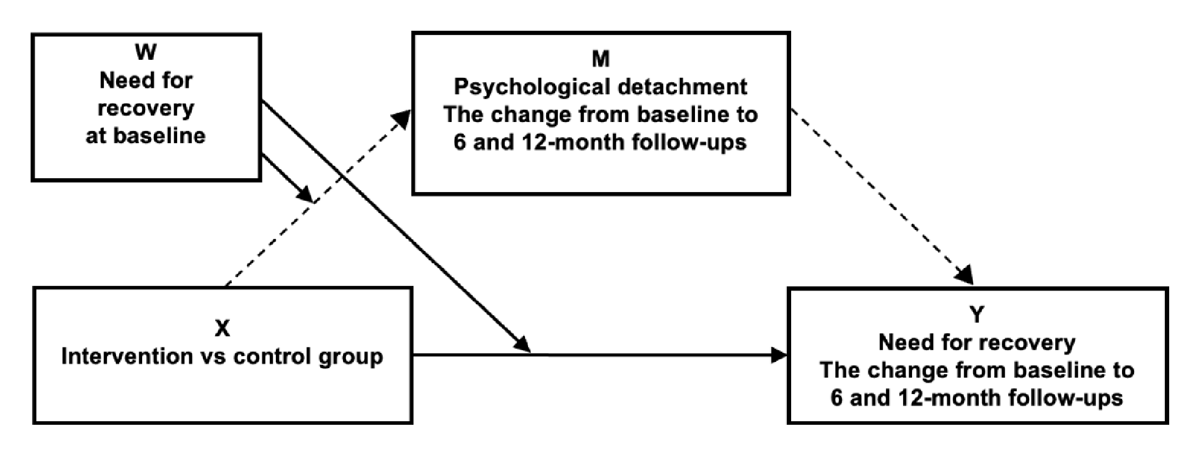
Figure 1
Conceptual illustration of the moderated mediation model addressed in hypotheses 1–2. Hypothesis 1 refers to the indirect effect of the intervention (X) on need for recovery (Y) through psychological detachment (M) at 6- and 12-month follow-ups. Hypothesis 2 refers to a moderation by need for recovery at baseline (W) of the indirect effects of the intervention on need for recovery at 6- and 12-month follow-ups.
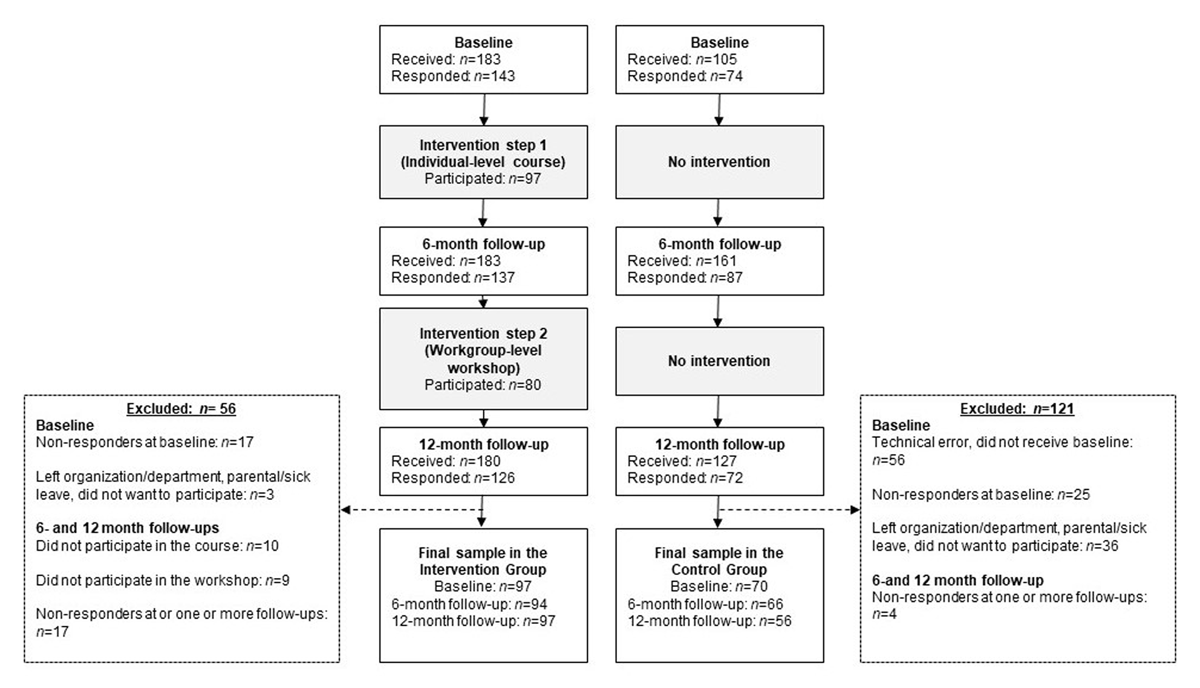
Figure 2
Flowchart illustrating the participants in the intervention and control groups who were included in the analysis after meeting the inclusion criteria (i.e., responding to the baseline questionnaire and at least one follow-up).
Table 1
Descriptive statistics of the NFR and psychological detachment variables at baseline, 6-month follow-up, and 12-month follow-up in the intervention and control groups.
| BASELINE | 6-MONTH FOLLOW-UP | 12-MONTH FOLLOW-UP | Δ 6 MONTHS | Δ 12 MONTHS | ||||
|---|---|---|---|---|---|---|---|---|
| GROUP | VARIABLES | SCALE | n | MEAN (SD) | MEAN (SD) | MEAN (SD) | MEAN (SD) | MEAN (SD) |
| Intervention group | ||||||||
| Total | NFR | 0–100 | 97 | 36.2 (26) | 36.8 (28) | 36.8 (26) | 0.6 (21) | 0.3 (21) |
| Low NFR | NFR | <54.5 | 68 | 21.7 (13) | 26.7 (22) | 27.7 (22) | 4.8 (19) | 5.8 (19) |
| High NFR | NFR | >54.5 | 29 | 70.2 (11) | 60.4 (26) | 57.7 (24) | –9.4 (25) | –12.5 (21) |
| Total | PD | 0–4 | 97 | 2.6 (1) | 2.7 (1) | 2.6 (1) | 0.08 (1) | –0.02 (1) |
| Low NFR | PD | 0–4 | 68 | 2.9 (1) | 2.9 (1) | 2.8 (1) | –0.008 (1) | –0.2 (1) |
| High NFR | PD | 0–4 | 29 | 1.9 (1) | 2.2 (1) | 2.2 (1) | 0.3 (0.9) | 0.3 (1) |
| Control group | ||||||||
| Total | NFR | 0–100 | 69 | 34.3 (22) | 34.3 (27) | 32.8 (23) | 1.3 (15) | 1.2 (17) |
| Low NFR | NFR | <54.5 | 52 | 24.1 (13) | 23.6 (18) | 26.3 (19) | 0.2 (14) | 2 (16) |
| High NFR | NFR | >54.5 | 17 | 65.2 (12) | 69.8 (21) | 62.7 (17) | 4.5 (20) | –2.7 (20) |
| Total | PD | 0–4 | 69 | 2.4 (1) | 2.5 (1) | 2.5 (1) | 0.1 (1) | 0.02 (1) |
| Low NFR | PD | 0–4 | 52 | 2.7 (14) | 2.9 (1) | 2.8 (1) | 0.1 (1) | 0.1 (1) |
| High NFR | PD | 0–4 | 17 | 1.6 (1) | 1.8 (1) | 1.5 (1) | 0.2 (1) | –0.3 (1) |
[i] Note: NFR = Need for recovery, PD = Psychological detachment, Δ 6 months = The change score from baseline to 6-month follow-up (after the course), Δ 12 months = The change score from baseline to 12-month follow-up (after the course and the workshop). Baseline values are based on all participants, while follow-up values and change scores are based on those with data at each time point.
Table 2
Total, direct, and indirect intervention effects on the NFR, with estimates for the simple mediation model and the moderated mediation model at 6-month follow-up.
| MODEL 1 | MODEL 2 | |||||||||
|---|---|---|---|---|---|---|---|---|---|---|
| n = 159 | n = 152 | |||||||||
| SIMPLE MEDIATION MODEL | B | β | t | p | CI (95%) | B | β | t | p | CI (95%) |
| Intervention → PD (a) | –0.06 | –0.08 | –0.51 | 0.61 | –0.30 to 0.18 | –0.08 | –0.11 | –0.66 | 0.51 | –1.12 to 0.67 |
| PD → NFR (b) | –6.92* | –0.27 | –3.55 | <0.001 | –10.77 to –3.07 | –6.34* | –0.25 | –3.24 | <0.001 | –10.21 to –2.47 |
| Constant | 1.94 | – | 0.38 | 0.71 | –8.23 to 12.10 | 0.12 | – | 0.01 | 0.99 | –20.93 to 21.16 |
| Total effect: Intervention → PD → NFR (c) | –0.68 | –0.04 | –0.22 | 0.83 | –6.78 to 5.43 | 1.83 | 0.10 | 1.59 | 0.56 | –4.33 to 7.98 |
| Direct effect: Intervention → NFR (c’) | –1.11 | –0.06 | –0.37 | 0.71 | –7.00 to 4.79 | 1.29 | 0.07 | 0.43 | 0.67 | –4.68 to 7.26 |
| Indirect effect: Intervention → PD → NFR (ab) | 0.43 | 0.02 | – | – | –1.31 to 2.17 | 0.54 | 0.03 | – | – | –0.95 to 2.37 |
| MODERATED MEDIATION MODEL | B | β | t | p | CI (95%) | B | β | t | p | CI (95%) |
| Intervention → PD (a) | –0.12 | – | –0.87 | 0.39 | –0.22 to 0.70 | –0.11 | – | –0.76 | 0.45 | –0.41 to 0.18 |
| PD → NFR (b) | –6.19* | – | –3.22 | 0.002 | –9.98 to 2.39 | –6.20* | – | –3.20 | 0.002 | –10.03 to –2.37 |
| Moderated direct effect (W1) | –17.44* | – | –2.64 | 0.009 | –30.49 to –4.40 | –15.24* | – | –2.29 | 0.02 | –28.41 to –2.09 |
| Low Baseline NFR: Intervention → NFR | 3.87 | – | 1.14 | 0.26 | –2.86 to 10.61 | 5.25 | – | 1.52 | 0.13 | –1.57 to 12.07 |
| High Baseline NFR: Intervention → NFR | –13.57* | – | –2.40 | 0.02 | –24.74 to –2.41 | –10.01 | – | –1.74 | 0.08 | –21.40 to 31.38 |
| Index of moderated indirect effect (W2) | –1.15 | – | – | – | –5.51 to 1.65 | –0.68 | – | – | – | –5.29 to 2.29 |
| Baseline NFR x Intervention → PD (interaction) | 0.19 | – | 0.67 | 0.50 | –0.36 to 0.73 | 0.11 | – | 0.38 | 0.71 | –0.46 to 0.68 |
| Low Baseline NFR: Intervention → PD → NFR | 0.76 | – | – | – | –0.86 to 2.90 | 0.70 | – | – | – | –1.02 to 3.09 |
| High Baseline NFR: Intervention → PD → NFR | –0.39 | – | – | – | –3.94 to 2.05 | 0.02 | – | – | – | –3.45 to 2.60 |
[i] Note: PD = Psychological detachment, NFR = Need for recovery, w = moderator (i.e., low/high NFR at baseline). Unstandardized (B) and standardized (β) intervention effects are reported (when they were accessible in the output) with 95% confidence intervals. Model 1 shows unadjusted values and Model 2 shows effects adjusted for age, gender, children at home, quantitative demands, work pace, and baseline NFR. A negative B indicates a decrease, and a positive B indicates an increase in the NFR and psychological detachment, respectively, in the intervention group compared to the control group. Statistically significant results (p < 0.05) are marked with *.
Table 3
Total, direct, and indirect intervention effects on the NFR, with estimates for the simple mediation model and the moderated mediation model at 12-month follow-up.
| MODEL 1 | MODEL 2 | |||||||||
|---|---|---|---|---|---|---|---|---|---|---|
| n = 151 | n = 143 | |||||||||
| SIMPLE MEDIATION MODEL | B | β | t | p | CI (95%) | B | β | t | p | CI (95%) |
| Intervention → PD (a) | –0.04 | –0.05 | 0.30 | 0.77 | –0.36 to 0.49 | –0.10 | –0.14 | –0.77 | 0.44 | –0.37 to 0.16 |
| PD → NFR (b) | –7.94* | –0.30 | –3.89 | <0.001 | –11.97 to –3.91 | –7.16* | –0.27 | –3.53 | <0.001 | –11.18 to –3.15 |
| Constant | 2.03 | – | 0.36 | 0.72 | –9.12 to 13.18 | 12.50 | – | 1.16 | 0.25 | –8.75 to 22.76 |
| Total effect: Intervention → PD → NFR (c) | –0.87 | –0.04 | –0.26 | 0.79 | –7.42 to 5.67 | 1.23 | –0.06 | 0.37 | 0.71 | –5.35 to 0.63 |
| Direct effect: Intervention → NFR (c’) | –1.19 | –0.06 | –0.38 | 0.71 | –7.44 to 5.07 | 0.50 | –0.09 | 0.16 | 0.88 | –5.85 to 6.85 |
| Indirect effect: Intervention → PD → NFR (ab) | 0.32 | 0.02 | – | – | –1.60 to 2.33 | 0.74 | 0.03 | – | – | –0.93 to 2.98 |
| MODERATED MEDIATION MODEL | B | β | t | p | CI (95%) | B | β | t | p | CI (95%) |
| Intervention → PD (a) | –0.26 | – | –1.81 | 0.07 | –0.53 to 0.02 | –0.28 | – | –1.90 | 0.06 | –0.58 to 0.01 |
| PD → NFR (b) | –6.59* | – | –3.27 | 0.001 | –10.58 to –2.60 | –6.83* | – | –3.28 | 0.001 | –10.94 to –2.71 |
| Intervention → NFR (c’) | 2.13 | – | 0.61 | 0.54 | –4.76 to 9.02 | 1.85 | – | 0.51 | 0.61 | –5.37 to 9.07 |
| Moderated direct effect (W1) | –7.78 | – | –1.02 | 0.31 | –26.31 to 26.61 | –4.72 | – | –0.60 | 0.55 | –20.16 to 10.72 |
| Low Baseline NFR: Intervention → NFR | 2.13 | – | 0.61 | 0.54 | –4.76 to 9.02 | 1.85 | – | 0.51 | 0.61 | –5.37 to 9.07 |
| High Baseline NFR: Intervention → NFR | –5.65 | – | –0.85 | 0.40 | –18.85 to 7.56 | –2.87 | – | –0.42 | 0.68 | –16.48 to 10.74 |
| Index of moderated indirect effect (W2) | –5.85* | – | – | – | –12.81 to –0.67 | –5.62* | – | – | – | –12.12 to –0.72 |
| Baseline NFR x Intervention → PD (interaction) | 0.89* | – | 2.93 | 0.004 | 0.29 to 1.49 | 0.82* | – | 2.60 | 0.01 | 0.20 to 1.45 |
| Low Baseline NFR: Intervention → PD → NFR | 1.68* | – | – | – | 0.02 to 4.20 | 1.93* | – | – | – | 0.04 to 4.78 |
| High Baseline NFR: Intervention → PD → NFR | –4.17* | – | – | – | –9.94 to –0.15 | –3.69 | – | – | – | –9.01 to 0.06 |
[i] Note: PD = Psychological detachment, NFR = Need for recovery, w = moderator (i.e., low/high NFR at baseline). Unstandardized (B) and standardized (β) intervention effects are reported (when they were accessible in the output) with 95% confidence intervals. Model 1 shows unadjusted values and Model 2 shows the effects adjusted for age, gender, children at home, quantitative demands, work pace, and baseline NFR. A negative B indicates a decrease, and a positive B indicates an increase in the NFR and psychological detachment, respectively, in the intervention group compared to the control group. Statistically significant results (p < 0.05) are marked with.
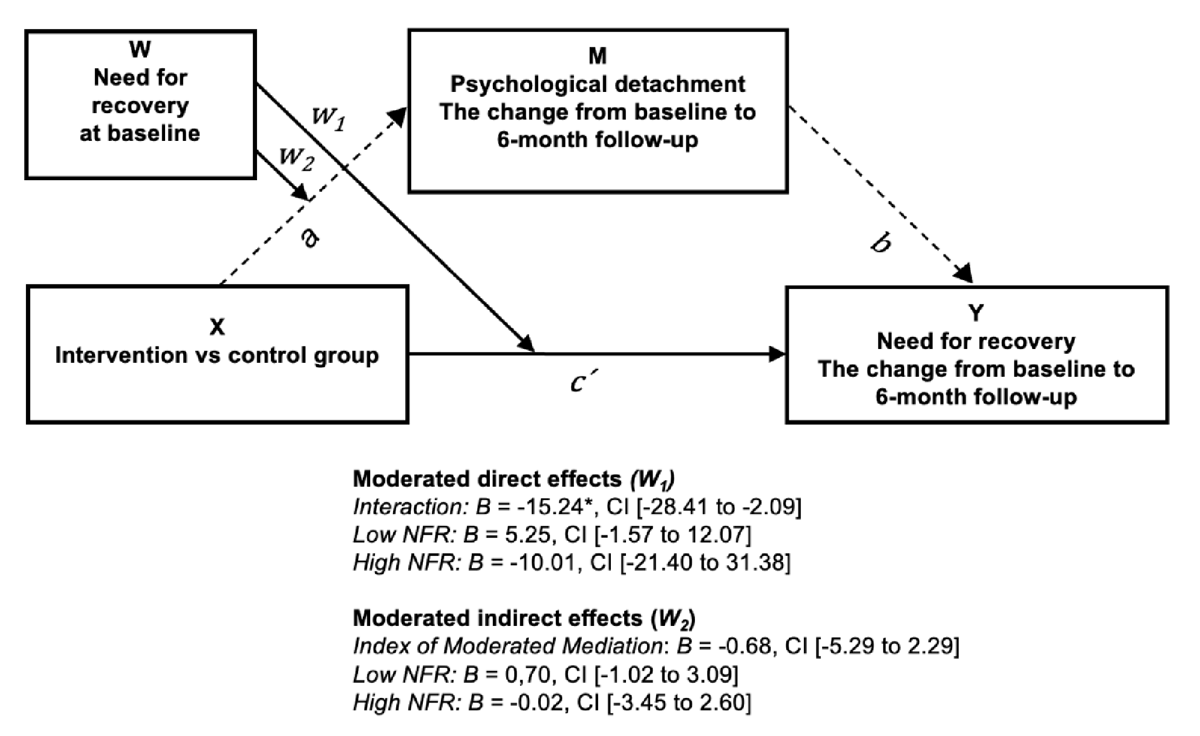
Figure 3
Results from the moderated mediation model for the test of hypothesis 2a (n = 152) on the change in need for recovery (NFR) at the 6-month follow-up. The figure shows estimates (unstandardized B coefficients) with 95% confidence intervals for the moderated direct effects of the intervention on NFR, as well as the moderated indirect effects on NFR through psychological detachment. A negative B means a decrease, and a positive B means an increase in the need for recovery and psychological detachment, respectively, in the intervention group compared to the control group. Statistically significant results with 95% CIs are marked with *. Values are adjusted for age, gender, children at home, quantitative demands, work pace, and baseline NFR.
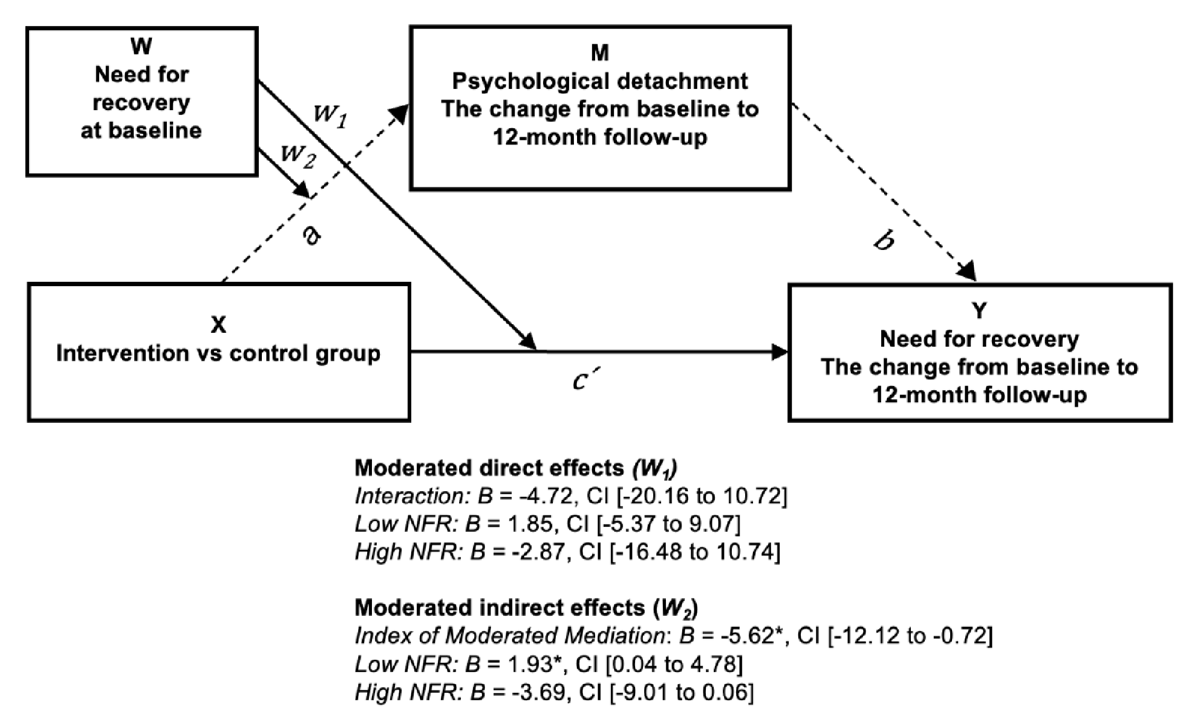
Figure 4
Results from the moderated mediation model for the test of hypothesis 2b (n = 143) on the change in need for recovery (NFR) at the 12-month follow-up. The figure shows estimates (unstandardized B coefficients) with 95% confidence intervals for the moderated direct effects of the intervention on NFR, as well as the moderated indirect effects on NFR through psychological detachment. A negative B means a decrease, and a positive B means an increase in the need for recovery and psychological detachment, respectively, in the intervention group compared to the control group. Statistically significant results with 95% CIs are marked with *. Values are adjusted for age, gender, children at home, quantitative demands, work pace, and baseline NFR.