
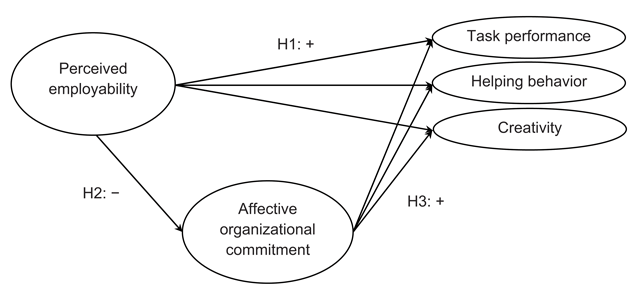
Figure 1
Theoretical model with the two hypothesized paths from perceived employability to job performance, task performance, helping behavior, and creativity in particular: a direct positive path and an indirect negative path through affective organizational commitment. Note. H1: Hypothesis 1; H2: Hypothesis 2; H3: Hypothesis 3.
Table 1
Means, Standard Deviations, and Correlations Between the Study Variables.
| Mean | SD | 1 | 2 | 3 | 4 | 5 | 6 | 7 | 8 | 9 | 10 | |
|---|---|---|---|---|---|---|---|---|---|---|---|---|
| 1. PE T1 (1‑5) | 3.07 | 1.03 | (0.95) | |||||||||
| 2. PE T2 (1‑5) | 3.02 | 1.03 | 0.77*** | (0.95) | ||||||||
| 3. AOC T1 (1‑5) | 3.33 | 0.77 | 0.03 | 0.04 | (0.81) | |||||||
| 4. AOC T2 (1‑5) | 3.28 | 0.84 | –0.02 | 0.03 | 0.76*** | (0.85) | ||||||
| 5. T‑Perf T1 (1‑5) | 3.78 | 0.59 | 0.11** | 0.08* | 0.33*** | 0.30*** | (0.88) | |||||
| 6. T‑Perf T2 (1‑5) | 3.74 | 0.62 | 0.10** | 0.14*** | 0.29*** | 0.33*** | 0.56*** | (0.89) | ||||
| 7. Help T1 (1‑5) | 2.98 | 0.75 | 0.01 | 0.00 | 0.17*** | 0.14*** | 0.31*** | 0.25*** | (0.74) | |||
| 8. Help T2 (1‑5) | 3.01 | 0.73 | 0.03 | 0.06 | 0.20*** | 0.22*** | 0.30*** | 0.31*** | 0.62*** | (0.72) | ||
| 9. Cr T1 (1‑5) | 3.03 | 0.79 | 0.10** | 0.13*** | 0.21*** | 0.21*** | 0.34*** | 0.29*** | 0.45*** | 0.36*** | (0.82) | |
| 10. Cr T2 (1‑5) | 3.00 | 0.79 | 0.10** | 0.16*** | 0.25*** | 0.29*** | 0.31*** | 0.40*** | 0.33*** | 0.45*** | 0.67*** | (0.82) |
[i] Note. Scale reliabilities are indicated between brackets on the diagonal. PE: perceived employability; AOC: affective organizational commitment; T-Perf: task performance; Help: helping behavior; Cr: creativity.
*p < 0.05, **p < 0.01, ***p < 0.001.
Table 2
Fit Indices for the Measurement and Structural Models.
| Model | χ2 | df | CFI | TLI | AIC | aBIC | RMSEA | SRMR | Δ Model | Δ χ² | Δ df | |
|---|---|---|---|---|---|---|---|---|---|---|---|---|
| Fit indices for the measurement models | ||||||||||||
| Time 1 | ||||||||||||
| M1 | 5 factors | 680.21 | 160 | 0.94 | 0.93 | 34,005.34 | 34,080.23 | 0.06 | 0.04 | |||
| M1b | 5 factors | 474.07 | 159 | 0.96 | 0.96 | 33,801.20 | 33,877.59 | 0.05 | 0.04 | M1–M1b | 206.14*** | 1 |
| M2 | 4 factors | 1,429.99 | 163 | 0.85 | 0.83 | 34,749.12 | 34,819.52 | 0.10 | 0.11 | M2–M1b | 955.92*** | 4 |
| M3 | 3 factors | 1,752.20 | 166 | 0.81 | 0.79 | 35,065.33 | 35,131.23 | 0.11 | 0.09 | M3–M1b | 1,278.10*** | 7 |
| M4 | 2 factors | 2,434.08 | 168 | 0.73 | 0.70 | 35,743.21 | 35,806.12 | 0.13 | 0.11 | M4–M1b | 1,960.00*** | 9 |
| M5 | 1 factor | 4,850.59 | 169 | 0.45 | 0.38 | 38,157.72 | 38,219.13 | 0.19 | 0.23 | M5–M1b | 4,376.50*** | 10 |
| Time 2 | ||||||||||||
| M1 | 5 factors | 658.66 | 160 | 0.95 | 0.94 | 33,533.92 | 33,608.81 | 0.06 | 0.05 | |||
| M1b | 5 factors | 488.28 | 159 | 0.97 | 0.96 | 33,365.54 | 33,441.92 | 0.05 | 0.05 | M1–M1b | 170.38*** | 1 |
| M2 | 4 factors | 1,761.16 | 163 | 0.83 | 0.80 | 34,630.42 | 34,700.81 | 0.11 | 0.13 | M2–M1b | 1,272.90*** | 4 |
| M3 | 3 factors | 1,705.19 | 166 | 0.84 | 0.81 | 34,568.44 | 34,634.35 | 0.11 | 0.09 | M3–M1b | 1,216.90*** | 7 |
| M4 | 2 factors | 2,648.89 | 168 | 0.73 | 0.70 | 35,508.15 | 35,571.06 | 0.14 | 0.11 | M4–M1b | 2,160.60*** | 9 |
| M5 | 1 factor | 5,324.86 | 169 | 0.45 | 0.38 | 38,182.12 | 38,243.53 | 0.20 | 0.24 | M5–M1b | 4,836.60*** | 10 |
| Cross-lagged relationships between perceived employability and job performance | ||||||||||||
| S1 Stability | 966.04 | 505 | 0.97 | 0.97 | 54,366.72 | 54,501.52 | 0.03 | 0.05 | ||||
| S2 Normal caus. | 964.42 | 502 | 0.97 | 0.97 | 54,371.11 | 54,510.40 | 0.03 | 0.05 | S1–S2 | 1.61 | 3 | |
| S3 Reversed caus. | 958.20 | 502 | 0.97 | 0.97 | 54,364.89 | 54,504.18 | 0.03 | 0.05 | S1–S3 | 7.84* | 3 | |
| S4 Recip. caus. | 956.58 | 499 | 0.97 | 0.97 | 54,369.27 | 54,513.05 | 0.03 | 0.05 | S3–S4 | 1.62 | 3 | |
| Cross-lagged relationships between perceived employability and affective organizational commitment | ||||||||||||
| S1 Stability | 183.06 | 71 | 0.99 | 0.99 | 21,960.31 | 22,011.23 | 0.05 | 0.04 | ||||
| S2 Normal caus. | 179.16 | 70 | 0.99 | 0.99 | 21,958.40 | 22,010.83 | 0.04 | 0.04 | S1–S2 | 3.90* | 1 | |
| S3 Reversed caus. | 182.03 | 70 | 0.99 | 0.99 | 21,961.27 | 22,013.70 | 0.05 | 0.04 | S1–S3 | 1.03 | 1 | |
| S4 Recip. caus. | 178.15 | 69 | 0.99 | 0.99 | 21,959.40 | 22,013.32 | 0.05 | 0.04 | S2–S4 | 1.01 | 1 | |
| Cross-lagged relationships between affective organizational commitment and job performance | ||||||||||||
| S1 Stability | 1,009.13 | 442 | 0.96 | 0.95 | 51,981.09 | 52,109.90 | 0.04 | 0.06 | ||||
| S2 Normal caus. | 990.12 | 439 | 0.96 | 0.95 | 51,968.09 | 52,101.39 | 0.04 | 0.05 | S1–S2 | 19.00*** | 3 | |
| S3 Reversed caus. | 1,006.11 | 439 | 0.96 | 0.95 | 51,984.07 | 52,117.38 | 0.04 | 0.06 | S1–S3 | 3.02 | 3 | |
| S4 Recip. caus. | 987.30 | 436 | 0.96 | 0.95 | 51,971.27 | 52,109.06 | 0.04 | 0.05 | S2–S4 | 2.82 | 3 | |
[i] Note. CFI and TLI values above 0.90 indicate a good fit, values equal to or higher than 0.95 an excellent fit; RMSEA values below or equal to 0.08 indicate a good fit, values lower than 0.05 an excellent fit; SRMR values below 0.09 indicate an excellent fit (Weston and Gore, 2006). For AIC and aBIC, the following rule holds: the smaller the value, the better the fit.
Caus.: causation; Recip.: reciprocal.
*p < 0.05, **p < 0.01, ***p < 0.001.
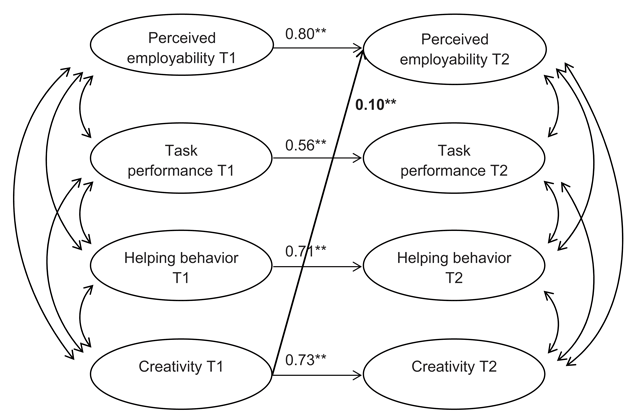
Figure 2
Final structural model with the cross-lagged relationships (in bold) between perceived employability, and task performance, helping behavior, and creativity. *p < 0.05, **p < 0.01, ***p < 0.001.
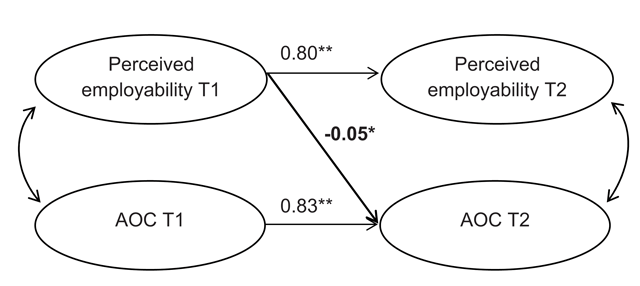
Figure 3
Final structural model with the cross-lagged relationship (in bold) between perceived employability and affective organizational commitment. Note. AOC: affective organizational commitment. *p < 0.05, **p < 0.01, ***p < 0.001.
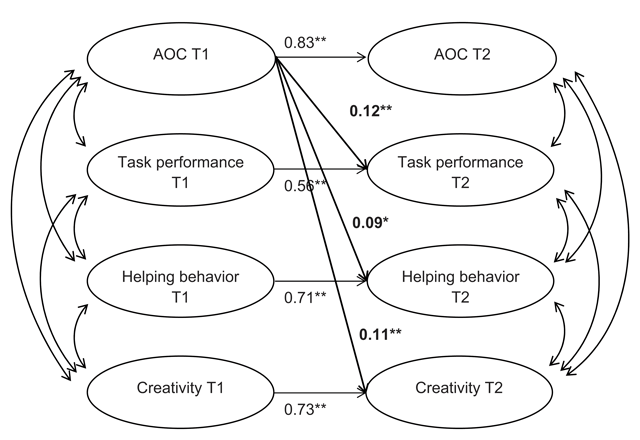
Figure 4
Final structural model with the cross-lagged relationships (in bold) between affective organizational commitment, and task performance, helping behavior, and creativity. Note. AOC: affective organizational commitment. *p < 0.05, **p < 0.01, ***p < 0.001.