
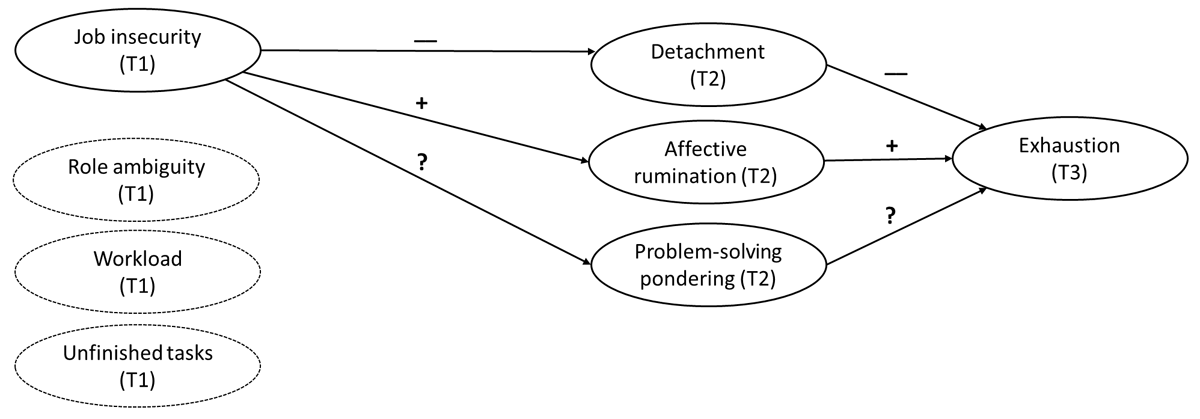
Figure 1
Conceptual model linking job insecurity to exhaustion.
Table 1
Descriptive statistics and correlation coefficients for all measures used.
| VARIABLE | M | SD | 1 | 2 | 3 | 4 | 5 | 6 | 7 | 8 | 9 | 10 | 11 |
|---|---|---|---|---|---|---|---|---|---|---|---|---|---|
| T1 measures | |||||||||||||
| 1. Job insecurity | 2.15 | 1.05 | . | ||||||||||
| 2. Role ambiguity | 2.60 | 1.14 | 26** | ||||||||||
| 3. Workload | 3.33 | 0.86 | .05 | .11 | |||||||||
| 4. Unfinished tasks | 2.59 | 1.09 | .003 | .24** | .58** | ||||||||
| 5. Psych. detachment | 3.13 | 0.98 | –.15 | –.20** | –.46** | –.48** | |||||||
| 6. Affective rumination | 2.57 | 0.86 | .25** | .33** | .38** | .44** | –.54** | ||||||
| 7. PS pondering | 2.98 | 0.76 | .11 | .14 | .42** | .51** | –.56** | .40** | |||||
| 8. Exhaustion | 3.21 | 0.91 | .07 | .26** | .39** | .38** | –.40** | .61** | .30** | ||||
| T2 measures | |||||||||||||
| 9. Psych. detachment | 3.26 | 0.93 | –.18* | –.28** | –.50** | –.56** | .84** | –.58** | –.56** | –.43** | |||
| 10. Affective rumination | 2.55 | 0.86 | .32** | .31** | .37** | .37** | –.41** | .80** | .28** | .52** | –.52** | ||
| 11. PS pondering | 2.98 | 0.71 | .12 | .14 | .43** | .55** | –.57** | .39** | .81** | .28** | –.64** | .36** | |
| T3 measures | |||||||||||||
| 12. Exhaustion | 3.02 | 0.93 | .16* | .21** | .23** | .30** | –.26** | .58** | .21** | .69** | –.38** | .54** | .22** |
[i] Note. Response options varied across measures, but high scores always indicate strong support for the construct. PS pondering = Problem-solving pondering. **p < .01, * p < .05 (two-tailed).
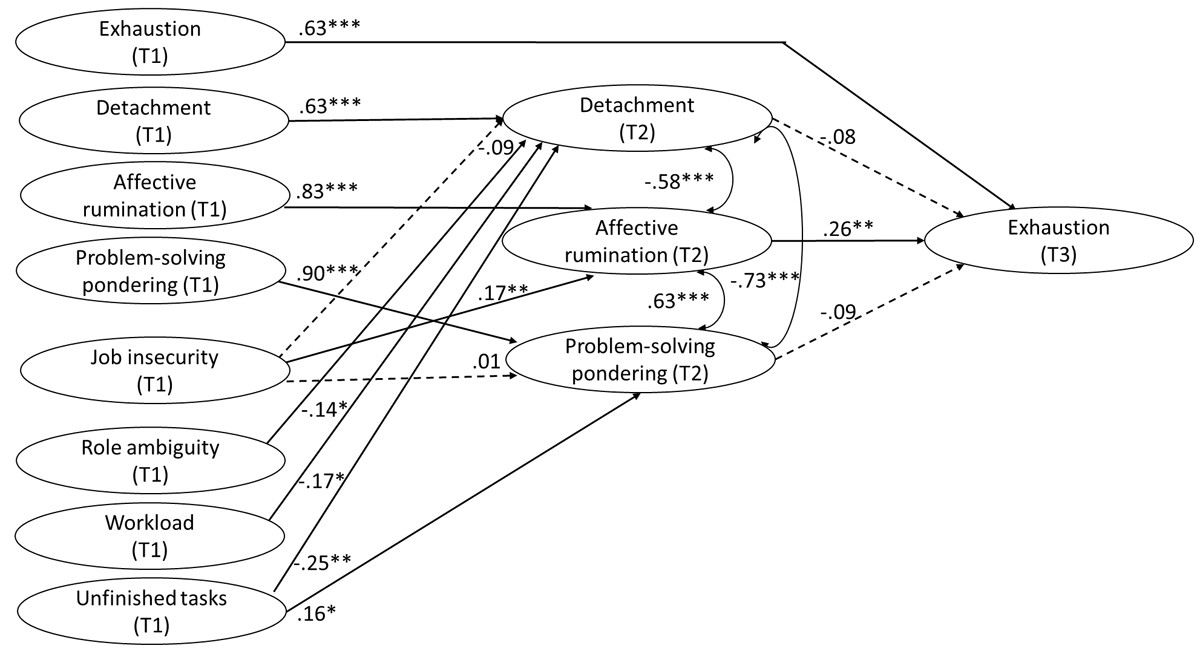
Figure 2
Illustrated are the standardized regression weights for the latent structural equation model. Solid lines indicate significant paths, dashed lines indicate non-significant paths. For the sake of parsimony, the effects of other stressors as job insecurity are only shown in case of significance.
*p < .05; **p < .01; ***p < .001.