
Table 1
Pearson’s correlation coefficients, descriptive statistics and Cronbach’s coefficient alpha between the variables in the study (n = 436).
| 1 | 2 | 3 | 4 | 5 | 6 | 7 | M | SD | α | |
|---|---|---|---|---|---|---|---|---|---|---|
| 1. Satisfaction with work conditions | 3.14 | .74 | .740 | |||||||
| 2. Job autonomy | .43* | 3.83 | .73 | .835 | ||||||
| 3. Perceived co-worker support | .14* | .25* | 4.19 | .62 | .855 | |||||
| 4. Perceived supervisor support | .36* | .32* | .43* | 3.84 | .77 | .859 | ||||
| 5. Workgroup identification | .14* | .29* | .52* | .34* | 3.84 | .76 | .782 | |||
| 6. Organizational identification | .24* | .18* | .07 | .25* | .23* | 2.92 | .77 | .752 | ||
| 7. Workgroup pride | .22* | .37* | .49* | .40* | .57* | .17* | 4.17 | .64 | .868 | |
| 8. Organizational pride | .41* | .32* | .08 | .32* | .13* | .57* | .30* | 3.10 | .85 | .900 |
[i] Note. *p < 0.001 level.
Table 2
Confirmatory factor analysis of the measurement model (n = 436).
| Model | df | χ2 | ΔModel | Δdf | χ2Δ | RMSEA | CFI | AGFI | GFI |
|---|---|---|---|---|---|---|---|---|---|
| 1 | 77 | 1602.32* | .213 | .513 | .383 | .547 | |||
| 2 | 77 | 619.68* | 1 v.2 | 982.64* | .127 | .827 | .787 | .844 | |
| 3 | 77 | 553.61* | 2 v.3 | 66.07* | .119 | .824 | .760 | .848 | |
| 4 | 75 | 244.82* | 3 v.4 | 2 | 308.79* | .072 | .946 | .896 | .925 |
[i] Note. * = p < .001, RMSEA = Root Mean Squared Error of Approximation, CFI = Comparative Fit Index, AGFI = Adjusted Goodness of Fit Index, and GFI = Goodness-of-Fit Index.
Table 3
Standardized regression coefficients (β), R2 Change (ΔR2) and adjusted R2 regarding study variables predicting workgroup pride.
| Model | 1 | 2 | 3 |
|---|---|---|---|
| Step 1 Control factors | |||
| Gender | –.14** | –.09* | –.12** |
| Age | –.08 | –.05 | –.04 |
| Number of years in organization | .03 | .02 | .01 |
| Number of years in workgroup | .09 | .07 | .04 |
| Satisfaction with work conditions | .03 | .04 | .06 |
| Job autonomy | .26*** | .19*** | .15*** |
| Perceived supervisor support | .30*** | .16*** | .15*** |
| Organizational identification | .05 | .07 | .00 |
| Step 2 | |||
| Perceived co-worker support | .35*** | .18*** | |
| Step 3 | |||
| Workgroup identification | .36*** | ||
| ΔR 2 | .26*** | .10*** | .08*** |
| Adjusted R2 | .24 | .34 | .42 |
[i] Note. * = p < .05, ** = p < .01, *** = p < .001. Predictors: gender (women = 1), age, number of years employed by the organization, number of years in the workgroup, satisfaction with work conditions, job autonomy, perceived supervisor support, organizational identification, perceived co-worker support, workgroup identification.
Table 4
Standardized regression coefficients (β), R2 Change (ΔR2) and adjusted R2 regarding study variables predicting organizational pride.
| Model | 1 | 2 | 3 |
|---|---|---|---|
| Step 1 Control factors | |||
| Gender | –.12** | –.20* | –.14** |
| Age | .15** | .08 | .06 |
| Number of years in organization | .02 | .06 | .05 |
| Number of years in workgroup | –.06 | –.04 | –.03 |
| Perceived co-worker support | .03 | –.11 | –.01 |
| Workgroup identification | .11 | .03 | –.09* |
| Step 2 | |||
| Job autonomy | .11* | .08* | |
| Perceived supervisor support | .23*** | .14*** | |
| Satisfaction with work conditions | .32*** | .25*** | |
| Step 3 | |||
| Organizational identification | .48*** | ||
| ΔR 2 | .04** | .22*** | .19*** |
| Adjusted R2 | .04 | .26 | .46 |
[i] Note. * = p < .05, ** = p < .01, *** = p < .001. Predictors: gender (women = 1), age, number of years employed by the organization, number of years in the workgroup, perceived co-worker support, workgroup identification, satisfaction with work conditions, job autonomy, perceived supervisor support, organizational identification.
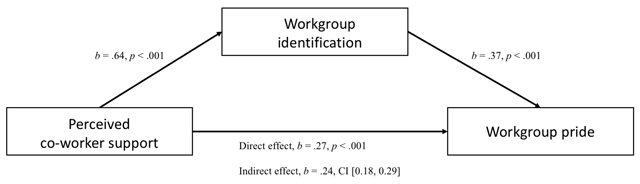
Figure 1
Model of perceived co-worker support as a predictor of workgroup pride, partially mediated by workgroup identification.
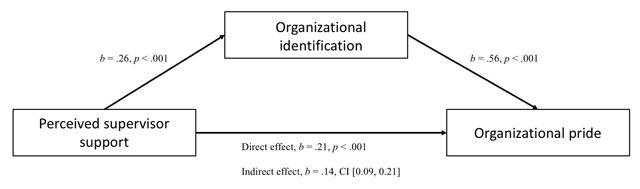
Figure 2
Model of perceived supervisor support as a predictor of organizational pride, partially mediated by organizational identification.
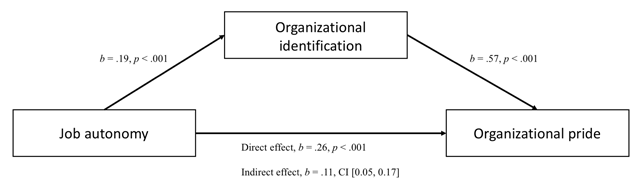
Figure 3
Model of job autonomy as a predictor of organizational pride, partially mediated by organizational identification.
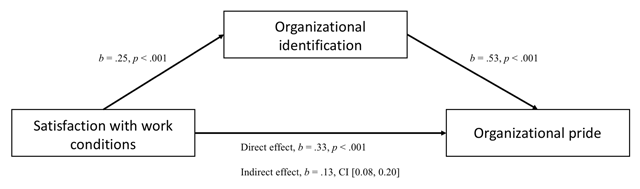
Figure 4
Model of satisfaction with work conditions as a predictor of organizational pride, partially mediated by organizational identification.