
Table 1
Mean, Standard Deviations, and Correlations among Study Variables (N = 4378).
| Variables | M | SD | 1 | 2 | 3 | 4 | 5 |
|---|---|---|---|---|---|---|---|
| 1. Vigour | 4.73 | 1.03 | |||||
| 2. Dedication | 4.92 | 1.05 | .74* | ||||
| 3. Absorption | 4.54 | 1.09 | .58* | .71* | |||
| 4. Work-home facilitation | 3.17 | 0.60 | .31* | .37* | .27* | ||
| 5. Work-home conflict | 3.11 | 0.85 | –.32* | –.26* | –.12* | –.21* | |
| 6. Gender | .33* | .10 | .00 | .06* | .06* | ||
| 7. Age | .12* | .08* | .01 | –.02* | –.07* |
[i] *p < .05, two-tailed.
Note. Gender was dummy coded with 1 = females, 0 = males.
Table 2
Study Variables’ Internal Consistency and Convergent Validity.
| Variables | Loading | D.G rho | AVE |
|---|---|---|---|
| 1. Vigour | 0.92 | 0.79 | |
| UWES1 | 0.90 | ||
| UWES2 | 0.91 | ||
| UWES3 | 0.86 | ||
| 2. Dedication | 0.93 | 0.82 | |
| UWES4 | 0.93 | ||
| UWES5 | 0.94 | ||
| UWES6 | 0.85 | ||
| 3. Absorption | 0.90 | 0.75 | |
| UWES7 | 0.90 | ||
| UWES8 | 0.88 | ||
| UWES9 | 0.80 | ||
| 4. Work-home facilitation | 0.82 | 0.61 | |
| WHF1 | 0.78 | ||
| WHF2 | 0.81 | ||
| WHF4 | 0.74 | ||
| 5. Work-home conflict | 0.87 | 0.62 | |
| WHC1 | 0.72 | ||
| WHC2 | 0.82 | ||
| WHC3 | 0.79 | ||
| WHC4 | 0.81 |
Table 3
Discriminant Validity Test of Study Variables.
| Variables | 1 | 2 | 3 | 4 | 5 |
|---|---|---|---|---|---|
| 1. Vigour | 0.79 | ||||
| 2. Dedication | 0.57 | 0.82 | |||
| 3. Absorption | 0.38 | 0.57 | 0.75 | ||
| 4. Work-home facilitation | 0.12 | 0.15 | 0.08 | 0.61 | |
| 5. Work-home conflict | 0.10 | 0.07 | 0.02 | 0.08 | 0.62 |
[i] Note. The squared correlations are below the diagonal, while the diagonal elements (in bold) are the AVE estimates.
Table 4
Main Effects of Exogenous Variables on Work-Home Facilitation and Conflict.
| Bootstrap Confidence Intervals | |||
|---|---|---|---|
| Variables | Value | Lower bound (95%) | Upper bound (95%) |
| 1. Work-home facilitation | |||
| Vigour | .117** | 0.069 | 0.162 |
| Dedication | .309** | 0.258 | 0.364 |
| Absorption | –.011 | –0.056 | 0.035 |
| Gender | .079** | 0.051 | 0.109 |
| Age | –.010 | –0.036 | 0.019 |
| 2. Work-home conflict | |||
| Vigour | –.287** | –0.331 | –0.244 |
| Dedication | –.167** | –0.221 | –0.118 |
| Absorption | .139** | 0.097 | 0.182 |
| Gender | .130** | 0.101 | 0.157 |
| Age | –.051** | –0.080 | –0.022 |
[i] WHF: R2 = .166, WHC: R2 = .137.
Note. **p < .01, two-tailed.
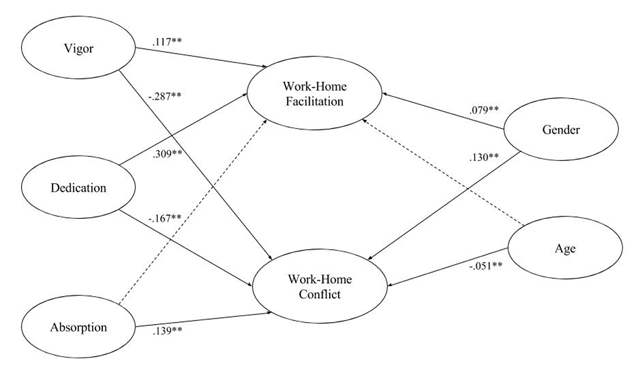
Figure 1
Displays the significant effects of the PLS-SEM analysis. The gender variable was dummy coded with 0 = males and 1 = females.
**p < .01, two-tailed; ---p > .05, two-tailed.