
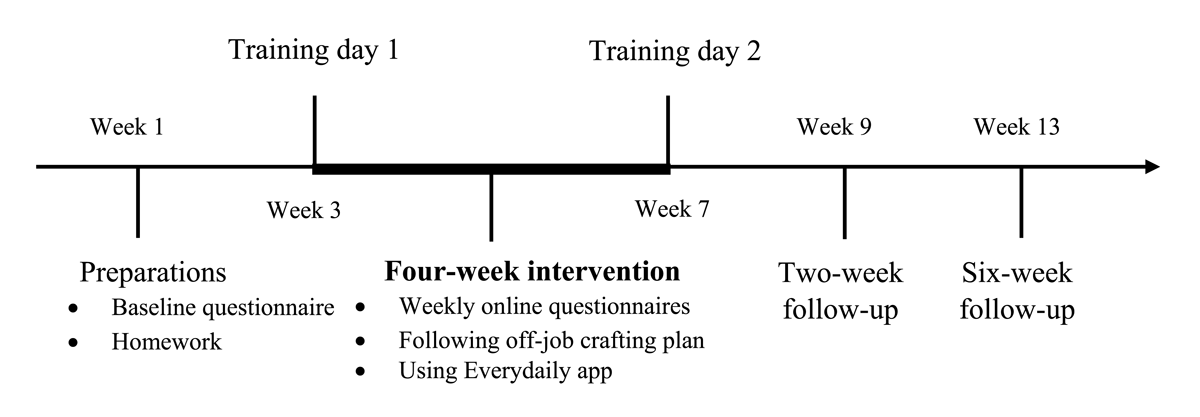
Figure 1
Off-job Crafting Intervention Timeline.
Table 1
Means, Standard Deviations and Zero-Order Correlations Between Study Variables.
| VARIABLE | M | SD | 1. | 2. | 3. | 4. |
|---|---|---|---|---|---|---|
| 1. Off-job crafting | 3.54 | 0.56 | .68*** | .56*** | .36*** | |
| 2. Needs satisfaction | 3.60 | 0.48 | .68*** | .62*** | .45*** | |
| 3. Subjective vitality | 3.25 | 0.69 | .56*** | .64*** | .70*** | |
| 4. Work engagement | 3.57 | 0.97 | .38*** | .47*** | .79*** |
[i] Notes: Correlations below the diagonal are between-person level correlations (person means aggregated over the repeated observations; N = 85–86), correlations above the diagonal are within-person correlations (N = 399–408). * p < 0.05. ** p < 0.01. *** p < 0.001.
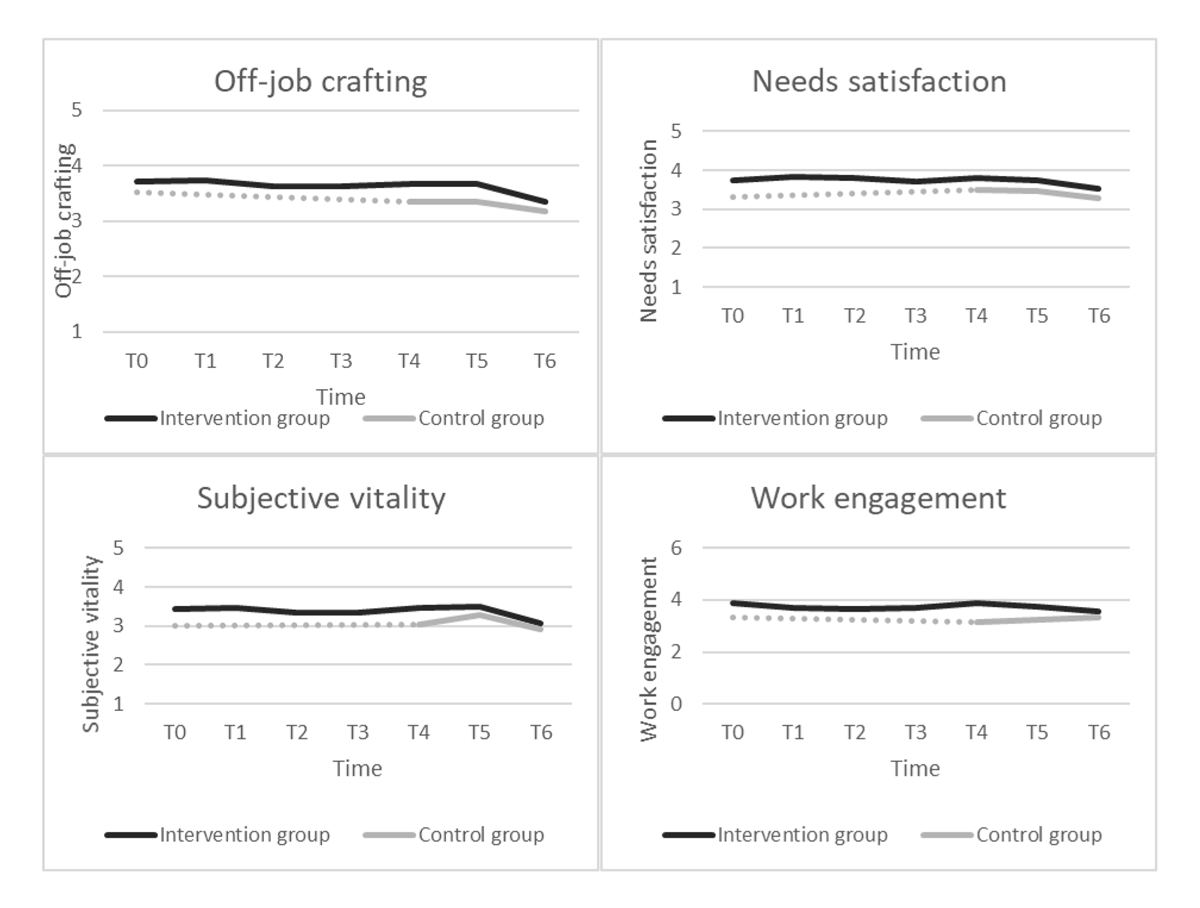
Figure 2
Changes in Focal Variables in Intervention and Control Groups across the Study Period (T0 to T6).
Notes: Intervention group n = 32–51, control group n = 21–33. T0: baseline, T1: week 1, T2: week 2, T3: week 3, T4: week 4/post-intervention, T5: two weeks after the intervention, T6: six weeks after the intervention. Control group did not participate in measurements at T1–T3.
Table 2
Background and Work Characteristics for the Intervention and Control Groups.
| VARIABLE | INTERVENTION GROUP | CONTROL GROUP | DIFFERENCE (X2/t) |
|---|---|---|---|
| Age in years | 44.1 (9.3) | 48.6 (8.5) | t (84) = 2.31, p = .012* |
| Women (%) | 90.2 | 74.3 | X2(1, 86) = 3.86, p = .050* |
| Education (%) | X2(3, 86) = 1.91, p = .590 | ||
| High school level | 5.9 | 11.4 | |
| Bachelor’s degree | 23.5 | 28.6 | |
| Master’s degree | 68.6 | 60.0 | |
| Doctoral degree | 2.0 | 0.0 | |
| Living arrangement (%) | X2(4, 86) = 4.78, p = .311 | ||
| Alone | 21.6 | 8.6 | |
| With a spouse | 29.4 | 37.1 | |
| With a spouse and children | 41.2 | 45.7 | |
| With children | 3.9 | 8.6 | |
| Permanent contract (%) | 94.1 | 91.4 | X2(2, 86) = 1.47, p = .478 |
| White collar position (%) | 98 | 100 | X2(3, 86) = 5.84, p = .120 |
| Weekly work hours | 40.0 (3.4) | 40.0 (4.3) | t (78) = 0.01, p = .990 |
| Tenure in organization in years | 9.5 (8.0) | 11.1 (8.1) | t (84) = 0.93, p = .357 |
| Tenure in current position in years | 6.5 (7.3) | 6.67(6.9) | t (83) = 0.08, p = .940 |
| Overall OJC | 3.7 (0.7) | 3.5 (0.6) | t (81) = –1.27, p = .208 |
| Overall NS | 3.7 (0.5) | 3.3 (0.6) | t (82) = –3.44, p < .001*** |
| Subjective vitality | 3.4 (0.9) | 3.0 (0.9) | t (82) = –2.17, p = .016* |
| Work engagement | 3.9 (1.1) | 3.3 (1.3) | t (82) = –2.20, p = .015* |
[i] Notes: OJC = off-job crafting, NS = need satisfaction. * p < 0.05. *** p < 0.001.
Table 3
Overview of the Process Evaluation Elements.
| ELEMENT | ITEM | RESPONSE SCALE | N | M (SD) |
|---|---|---|---|---|
| Support from the app | Did you feel that Everydaily app supported you in satisfying your psychological needs? | 1 (completely disagree) – 5 (completely agree) | 39 | 2.9 (1.2) |
| Effort invested in participation | How much effort did you invest to follow the intervention? | 1 (none at all) – 5 (a great deal) | 39 | 2.7 (0.5) |
| Level of time-consumption | How time consuming did you perceive this intervention to be? | 1 (not at all time-consuming) – 5 (very time-consuming) | 39 | 2.1 (0.8) |
| Perceived levels of fun | How much fun was the intervention? | 1 (not fun at all) – 5 (a great deal of fun) | 39 | 3.3 (0.7) |
| Relevance of the intervention content | How relevant was the intervention content to you? | 1 (not relevant at all) – 5 (extremely relevant) | 39 | 3.5 (1.0) |
| New skills and knowledge | How much new knowledge and skills have you gained during the intervention period to enhance your well-being and performance? | 1 (none at all) – 5 (a great deal) | 39 | 3.1 (0.8) |
| Satisfaction with the trainers | How satisfied were you with the trainers? | 1 (extremely dissatisfied) – 5 (extremely satisfied) | 38 | 4.1 (1.1) |
| Overall satisfaction with the intervention | How satisfied were you with the intervention as a whole? | 1 (extremely dissatisfied) – 5 (extremely satisfied) | 39 | 4.0 (0.8) |
Table 4
Overview of Psychological Needs Selected by the Participants to Work with During the Intervention (N = 42).
| NEED SELECTED | n | % OF N | AVERAGE GOAL PROGRESS IN % |
|---|---|---|---|
| Detachment | 17 | 40.5 | 58.7 (9–100) |
| Relaxation | 12 | 28.6 | 59.3 (10–99) |
| Autonomy | 2 | 4.8 | 56.0 (30–82) |
| Mastery | 5 | 11.9 | 46.0 (19–71) |
| Meaning | 5 | 11.9 | 41.8 (7–91) |
| Affiliation | 1 | 2.4 | 50.0 |
Table 5
Multilevel Models Predicting Overall Off-Job Crafting, Overall Needs Satisfaction, Subjective Vitality and Work Engagement.
| OFF-JOB CRAFTING | NEEDS SATISFACTION | |||||||
|---|---|---|---|---|---|---|---|---|
| EST | SE | t | EST | SE | t | |||
| Level 2 (between person) | ||||||||
| Intercept | 3.39 | 0.10 | 35.40 | 3.39 | 0.08 | 42.35 | ||
| Group | 0.22 | 0.12 | 1.80 | † | 0.34 | 0.10 | 3.33 | ** |
| Level 1 (within person) | ||||||||
| Time linear | –0.03 | 0.01 | –2.17 | * | 0.01 | 0.01 | 0.68 | |
| Cross-level interaction | ||||||||
| Time linear x group | 0.00 | 0.02 | 0.04 | –0.02 | 0.01 | –1.66 | † | |
| Deviance (df) | –349.90 (9) | –274.64 (9) | ||||||
| AIC | 717.80 | 567.28 | ||||||
| BIC | 753.88 | 603.33 | ||||||
| SUBJECTIVE VITALITY | WORK ENGAGEMENT | |||||||
| EST | SE | t | EST | SE | t | |||
| Level 2 (between person) | ||||||||
| Intercept | 3.07 | 0.12 | 26.00 | 3.30 | 0.16 | 20.64 | ||
| Group | 0.27 | 0.15 | 1.76 | † | 0.42 | 0.21 | 2.05 | * |
| Level 1 (within person) | ||||||||
| Time linear | –0.00 | 0.01 | –0.27 | –0.01 | 0.01 | –0.76 | ||
| Cross-level interaction | ||||||||
| Time linear × group | –0.02 | 0.02 | –1.20 | –0.00 | 0.02 | –0.37 | ||
| Deviance (df) | –407.62 (8) | –430.21 (8) | ||||||
| AIC | 831.24 | 876.41 | ||||||
| BIC | 863.33 | 908.32 | ||||||
[i] Notes: SE = standard error. df = degrees of freedom. Deviance = (–2 Residual Log Likelihood). N = 399–408 observations nested in 85–86 persons. Group was coded as 0 = control group, 1 = intervention group. † p < 0.10. * p < 0.05. ** p < 0.01. *** p < 0.001.
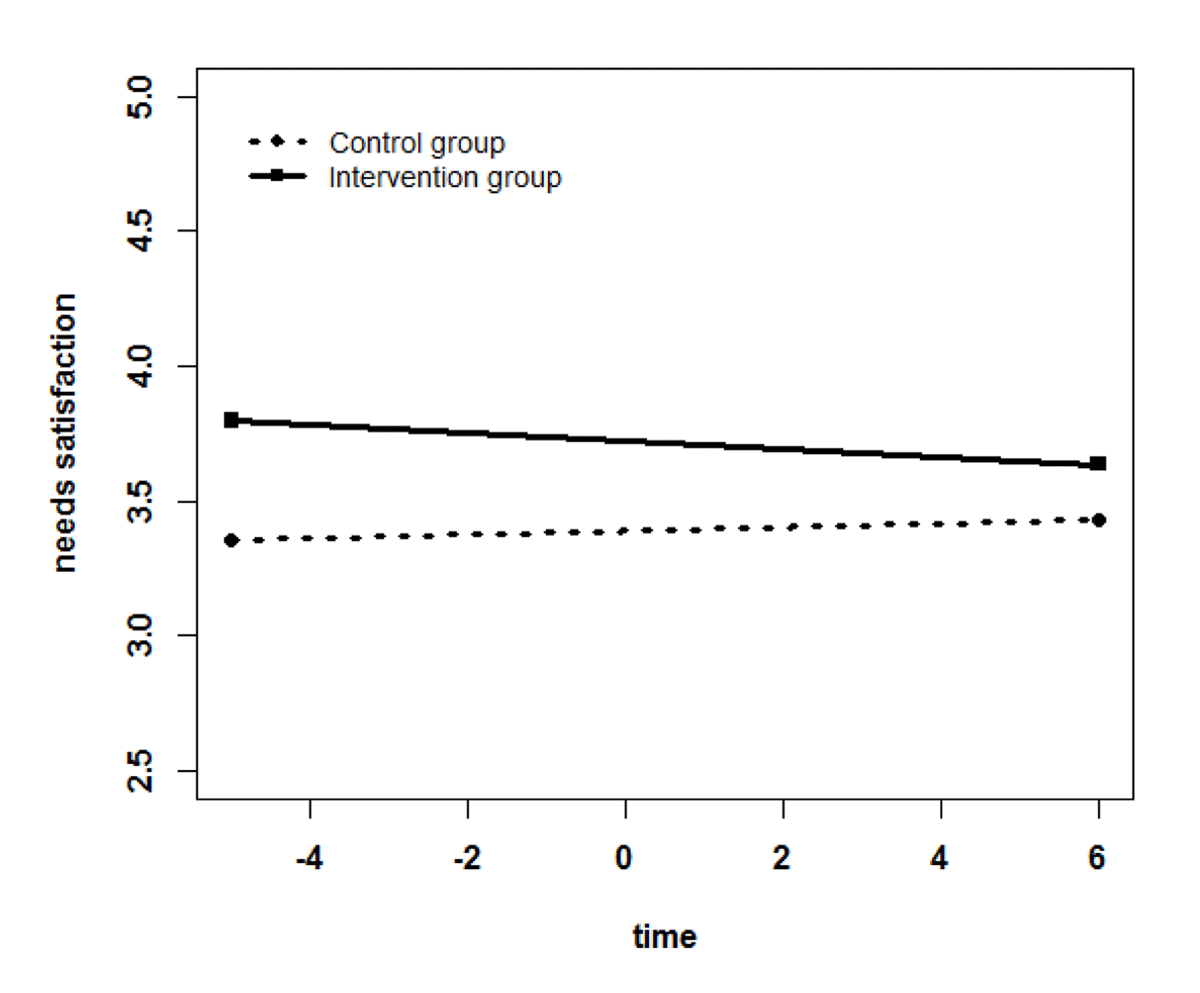
Figure 3
Interaction of Time and Group on Needs Satisfaction.
Note. Time was centered around T4 (post intervention), the x-bar indicates –4: before intervention, –2: intervention week 2, 0: post intervention, 2: two weeks post-intervention, 6: six weeks post-intervention.
Table 6
Multilevel Models Predicting Overall Off-job Crafting, Overall Needs Satisfaction, Subjective Vitality and Work Engagement in the Intervention Group.
| OFF-JOB CRAFTING | NEEDS SATISFACTION | |||||||
|---|---|---|---|---|---|---|---|---|
| EST | SE | t | EST | SE | t | |||
| Level 2 (between person) | ||||||||
| Intercept | 3.62 | 0.16 | 22.96 | 3.80 | 0.11 | 34.82 | ||
| Goal progress | 0.00 | 0.00 | 0.79 | 0.00 | 0.00 | 1.68 | ||
| App use | 0.00 | 0.00 | 0.73 | 0.00 | 0.00 | 0.19 | ||
| Intervention satisfaction | 0.07 | 0.14 | 0.49 | 0.11 | 0.10 | 1.04 | ||
| Goal SMARTness | 0.03 | 0.06 | 0.45 | –0.02 | 0.04 | –0.42 | ||
| Goal congruence | –0.07 | 0.20 | –0.37 | –0.14 | 0.14 | –1.01 | ||
| Level 1 (within person) | ||||||||
| Time linear | –0.04 | 0.02 | –2.05 | * | –0.03 | 0.01 | –1.96 | † |
| Cross-level interaction | ||||||||
| Time linear × goal progress | 0.00 | 0.00 | 1.81 | † | 0.00 | 0.00 | 2.60 | ** |
| Time linear × app use | –0.00 | 0.00 | –1.92 | † | –0.00 | 0.00 | –2.43 | * |
| Time linear × intervention satisfaction | 0.05 | 0.02 | 2.88 | ** | –0.01 | 0.01 | –0.66 | |
| Time linear × goal SMARTness | –0.00 | 0.01 | –1.19 | –0.01 | 0.01 | –2.19 | * | |
| Time linear × goal congruence | 0.01 | 0.02 | 0.29 | 0.02 | 0.02 | 0.98 | ||
| Deviance (df) | –183.21 (16) | –121.15 (17) | ||||||
| AIC | 398.42 | 276.15 | ||||||
| BIC | 453.84 | 335.10 | ||||||
| SUBJECTIVE VITALITY | WORK ENGAGEMENT | |||||||
| EST | SE | t | EST | SE | t | |||
| Level 2 (between person) | ||||||||
| Intercept | 3.51 | 0.18 | 19.29 | 3.91 | 0.20 | 19.31 | ||
| Goal progress | 0.01 | 0.00 | 1.98 | † | 0.01 | 0.00 | 2.31 | * |
| App use | 0.00 | 0.00 | 0.73 | 0.00 | 0.00 | 0.12 | ||
| Intervention satisfaction | 0.14 | 0.17 | 0.83 | –0.05 | 0.19 | –0.27 | ||
| Goal SMARTness | –0.03 | 0.07 | –0.39 | 0.06 | 0.08 | 0.69 | ||
| Goal congruence | –0.23 | 0.23 | –1.00 | –0.32 | 0.26 | –1.26 | ||
| Level 1 (within person) | ||||||||
| Time linear | –0.07 | 0.02 | –3.65 | *** | –0.02 | 0.01 | –1.76 | † |
| Cross-level interaction | ||||||||
| Time linear x goal progress | 0.00 | 0.00 | 0.37 | –0.00 | 0.00 | –0.11 | ||
| Time linear x app use | –0.00 | 0.00 | –2.37 | * | –0.00 | 0.00 | –1.03 | |
| Time linear x intervention satisfaction | –0.00 | 0.02 | –0.00 | 0.01 | 0.02 | 0.51 | ||
| Time linear x goal SMARTness | –0.01 | 0.01 | –1.91 | † | –0.02 | 0.01 | –2.19 | * |
| Time linear x goal congruence | 0.06 | 0.03 | 2.49 | * | ||||
| Deviance (df) | –212.80(16) | –228.13 (15) | ||||||
| AIC | 457.59 | 486.25 | ||||||
| BIC | 513.08 | 537.95 | ||||||
[i] Notes: SE = standard error. df = degrees of freedom. Deviance = (–2 Residual Log Likelihood). N = 232–237 observations nested in 36 persons. Goal progress, app use, intervention satisfaction, and goal SMARTness variables were grand mean centered. Goal congruence was coded as 0 = non-congruent, 1 = congruent. † p < 0.10. * p < 0.05. ** p < 0.01. *** p < 0.001.
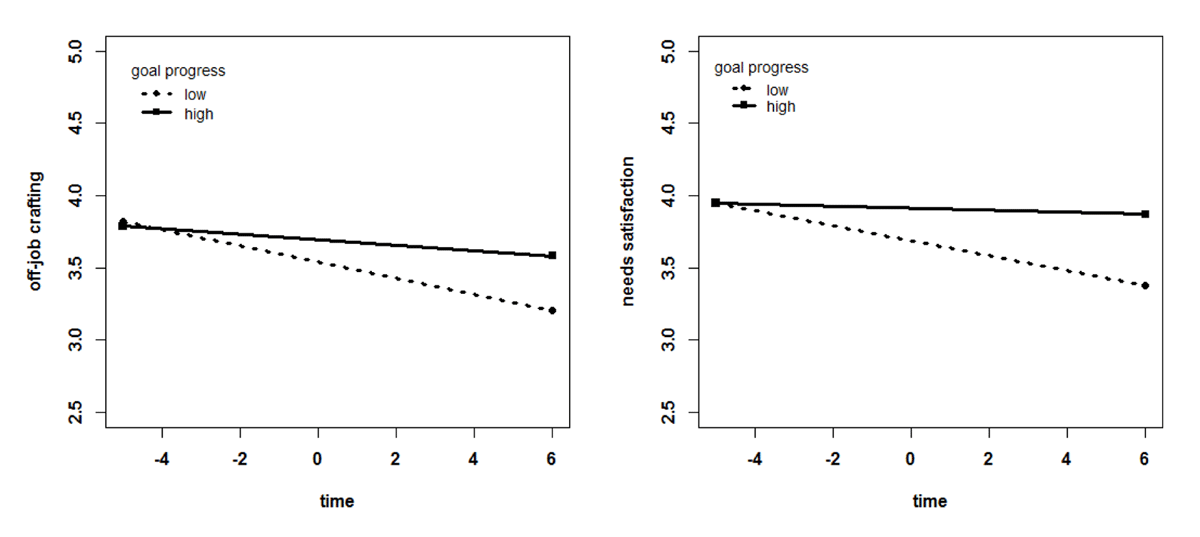
Figure 4
Significant Interaction of Time and Goal Progress on (a) Off-job Crafting and (b) Needs Satisfaction.
Note. Time was centered around T4 (post intervention), the x-bar indicates –4: before intervention, –2: intervention week 2, 0: post intervention, 2: two weeks post-intervention, 6: six weeks post-intervention.