
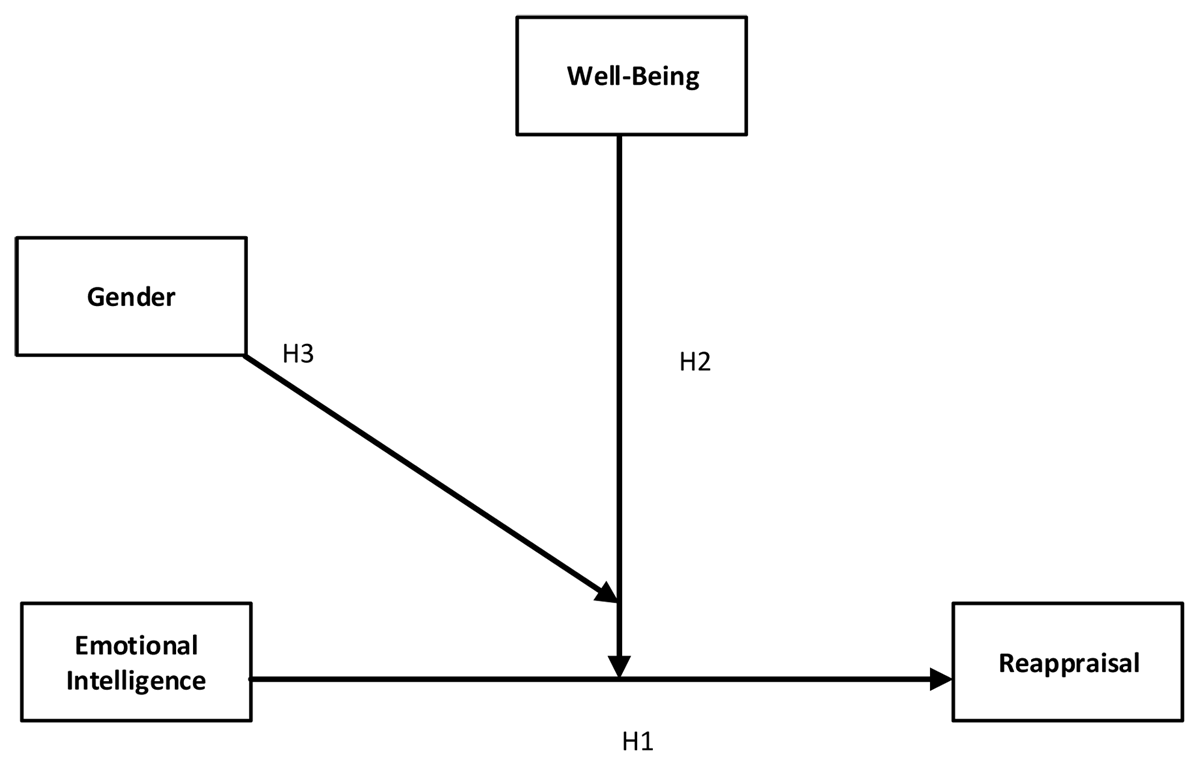
Figure 1
Emotional Intelligence Scale (WLEIS), Emotion Regulation Questionnaire (ERQ), Short Warwick-Edinburg Mental Well-Being Scale (SWEMWBS).
Note: Swedish hotel managers (N = 246).
Table 1
Descriptive Statistics, reliabilities and inter-correlations among variables.
| Variable | M | SD | 1 | 2 | 3 | 4 | 5 | 6 | 7 |
|---|---|---|---|---|---|---|---|---|---|
| EI/SEA | 4.40 | 0.57 | 0.87 | ||||||
| EI/ROE | 4.05 | 0.73 | 0.38** | 0.83 | |||||
| EI/UOE | 4.22 | 0.70 | 0.44** | 0.35** | 0.85 | ||||
| EI/OEA | 3.86 | 0.70 | 0.37** | 0.21** | 0.29** | 0.81 | |||
| Well-being | 3.94 | 0.64 | 0.26** | 0.33** | 0.37** | 0.13* | 0.87 | ||
| Reappraisal | 4.97 | 1.19 | 0.31** | 0.33** | 0.35** | 0.20** | 0.31** | 0.85 | |
| Age | 40.47 | 8.86 | 0.04 | 0.01 | 0.03 | –0.11 | 0.02 | –0.12 | |
| Gender | – | – | 0.02 | –0.07 | 0.05 | 0.24** | 0.23** | –0.11 | 0.02 |
[i] Note: N = 246. * p < 0.05. ** p < 0.01. *** p < 0.001, two-tailed. Reliability estimates are shown in bold along the diagonal. EI/SEA: Self-Emotion Appraisal, EI/ROE: Regulation of Emotions, EI/UOE: Use of Emotions, EI/OEA: Others’ Emotions Appraisal (Law et al., 2004).
Table 2
Regression analysis with cognitive reappraisal as the dependent variable and each of the four dimensions of EI.
| B (SE) | p | |
|---|---|---|
| EI/SEA | 0.62 (0.12) | <0.001 |
| Gender | 0.49 (0.15) | <0.001 |
| Age | –0.02 (0.01) | 0.07 |
| B (SE) | p | |
| EI/ROE | 0.58 (0.10) | <0.001 |
| Gender | 0.61 (0.14) | <0.001 |
| Age | –0.01 (0.01) | 0.11 |
| B (SE) | p | |
| EI/UOE | 0.58 (.10) | <0.001 |
| Gender | 0.50 (.15) | <0.001 |
| Age | –0.01 (.10) | 0.07 |
| B (SE) | p | |
| EI/OEA | 0.24 (0.11) | 0.03 |
| Gender | 0.47 (0.16) | <0.001 |
| Age | –0.01 (0.01) | 0.18 |
[i] Note: EI/SEA: Self-Emotion Appraisal, EI/ROE: Regulation of Emotions, EI/UOE: Use of Emotions, EI/OEA: Others’ Emotions Appraisal.
Table 3
Regression analysis. The moderator and the dependent variable – and each of the four dimensions of EI.
| Cognitive Reappraisal | ||
|---|---|---|
| B (SE) | P | |
| EI/SEA | –1.15 (0.74) | 0.12 |
| Well-being | –1.45 (0.86) | 0.09 |
| Gender | –0.47 (0.14) | 0.001 |
| Age | –0.02 (0.01) | 0.05 |
| EI/SEA × WB | 0.43 (0.19) | 0.03 |
| EI/ROE | –0.17 (0.58) | 0.77 |
| Well-being | –0.26 (0.61) | 0.67 |
| Gender | –0.60 (0.14) | <0.001 |
| Age | –0.01 (0.58) | 0.11 |
| EI/ROE × WB | 0.16 (0.15) | 0.27 |
| EI/UOE | 0.39 (0.65) | 0.56 |
| Well-being | 0.32 (0.73) | 0.67 |
| Gender | –0.50 (0.14) | <0.001 |
| Age | –0.02 (0.01) | 0.06 |
| EI/UOE × WB | 0.02 (0.17) | 0.92 |
| EI/OEA | 0.46 (0.62) | 0.45 |
| Well-being | 0.82 (0.58) | 0.16 |
| Gender | –0.47 (0.15) | 0.002 |
| Age | –0.01 (0.01) | 0.12 |
| EI/OEA × WB | –0.07 (0.15) | 0.64 |
[i] Note: EI/SEA: Self-Emotion Appraisal, EI/ROE: Regulation of Emotions, EI/UOE: Use of Emotions, EI/OEA: Others’ Emotions Appraisal.
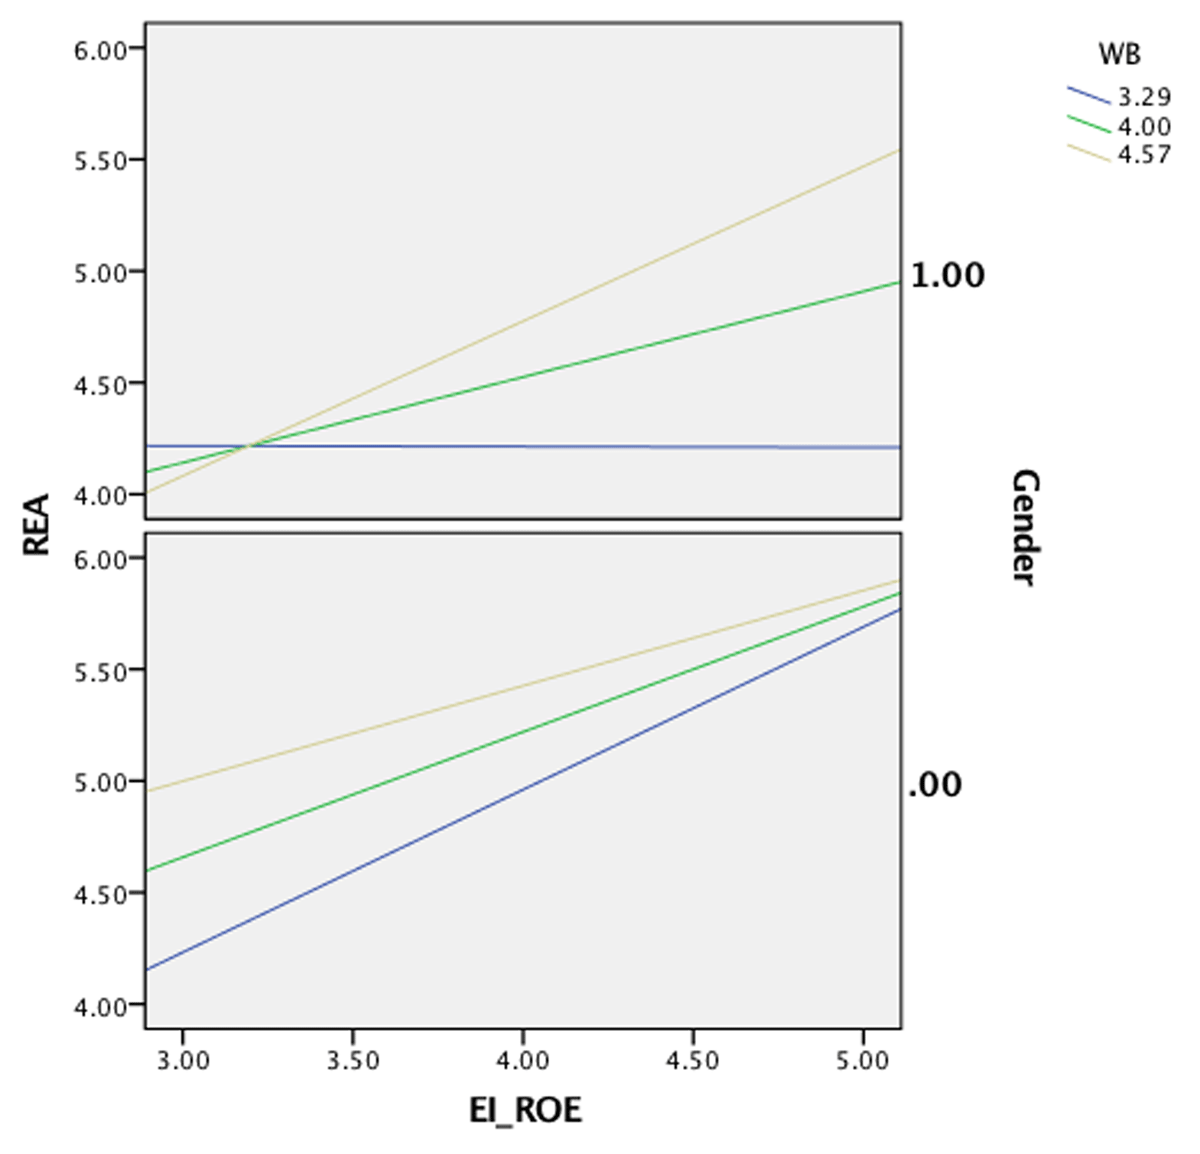
Figure 2
Well-being as a moderator of the relationship between Regulation of Emotion (EI/ROE) and cognitive reappraisal (REA) by gender.
Note: For gender: 0 = males, 1 = females; for well-being (WB) 1SD above the mean (m = 4.57), the mean (m = 4.00) and 1SD below the mean (m = 3.29).
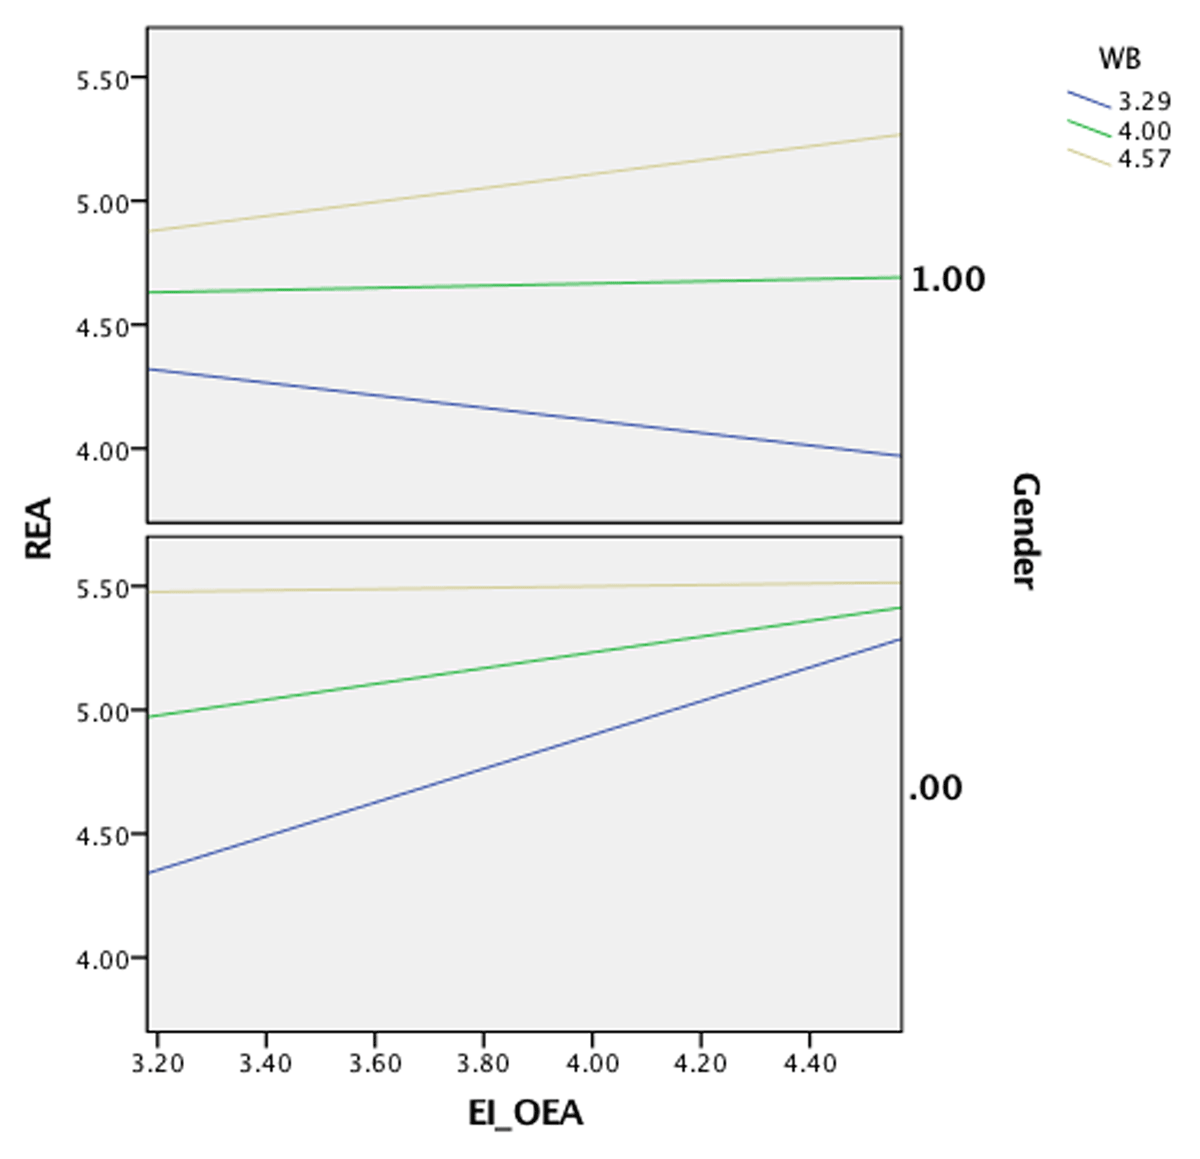
Figure 3
Well-being as a moderator of the relationship between Others Emotions Appraisal (EI/OEA) and cognitive reappraisal (REA) by gender.
Note: For gender: 0 = males, 1 = females; for well-being (WB) 1SD above the mean (m = 4.57), the mean (m = 4.00) and 1SD below the mean (m = 3.29).