
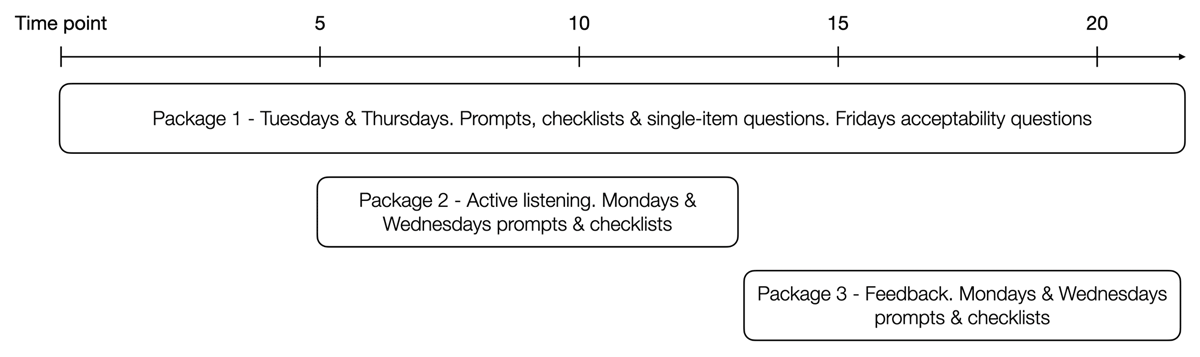
Figure 1
Visualization of smartphone app packages during the time points of the study.
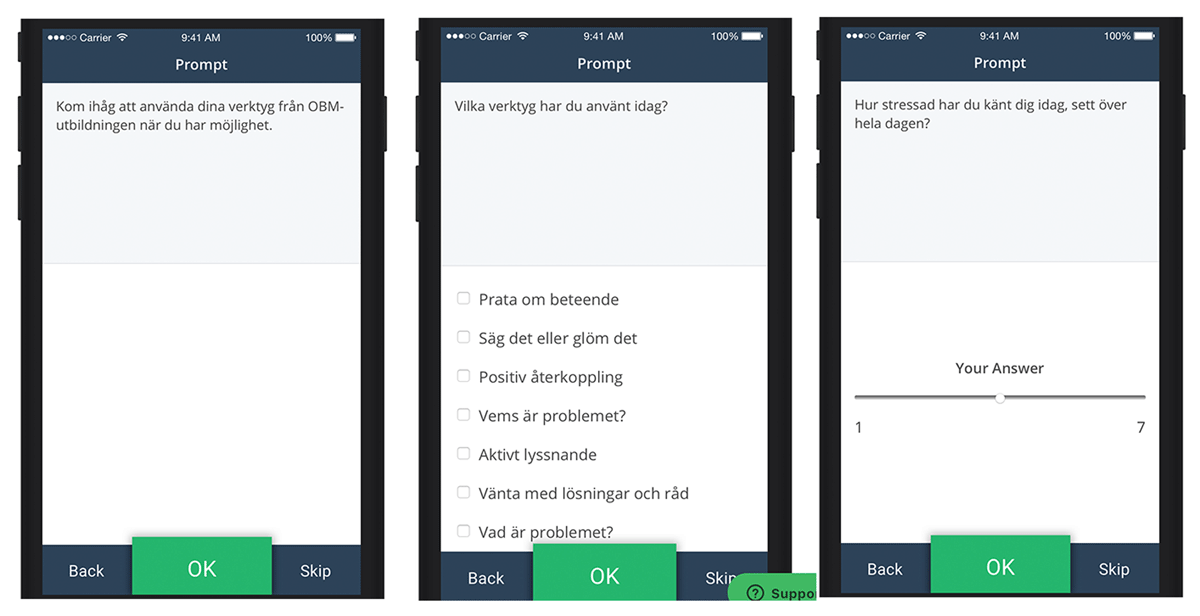
Figure 2
Smartphone app morning prompt, afternoon checklist, and stress assessment with slider.
Table 1
Summary statistics of mixed linear models for primary outcomes.
| OUTCOME | INTERCEPT, 95% CI [LL UL] | FIXED EFFECT OF TIME: β, 95% CI [LL UL] | SE | P | ICC | N | OBSERVATIONS (RANGE, MEAN, RESPONSE RATE) |
|---|---|---|---|---|---|---|---|
| Number of skills used | 2.79 [2.19 3.38] | .052 [.021 .083] | .016 | .001 | .32 | 17 | 206 (5–20, 12.1, 55%) |
| Active Listening components | 2.89 [2.20 3.57] | .104 [–.011 .219] | .059 | .075 | .37 | 15 | 68 (2–7, 4.5, 56.7%) |
| Feedback components | 2.05 [1.40 2.71] | .133 [.018 .247] | .058 | .023 | .18 | 10 | 42 (1–8, 4.2, 52.5%) |
| Perceived support | 4.35 [3.88 4.81] | .071 [.033 .110] | .020 | .000 | .59 | 17 | 127 (3–11, 7.5, 67.9%) |
| More/less notifications | 4.07 [3.71 4.43] | –.016 [–.048 .016] | .016 | .336 | .54 | 17 | 127 (3–11, 7.5, 67.9%) |
[i] Note: CI = Confidence Interval, LL = Lower Limit, UL = Upper Limit, SE = Standard Error, ICC = Intraclass Correlation Coefficient.
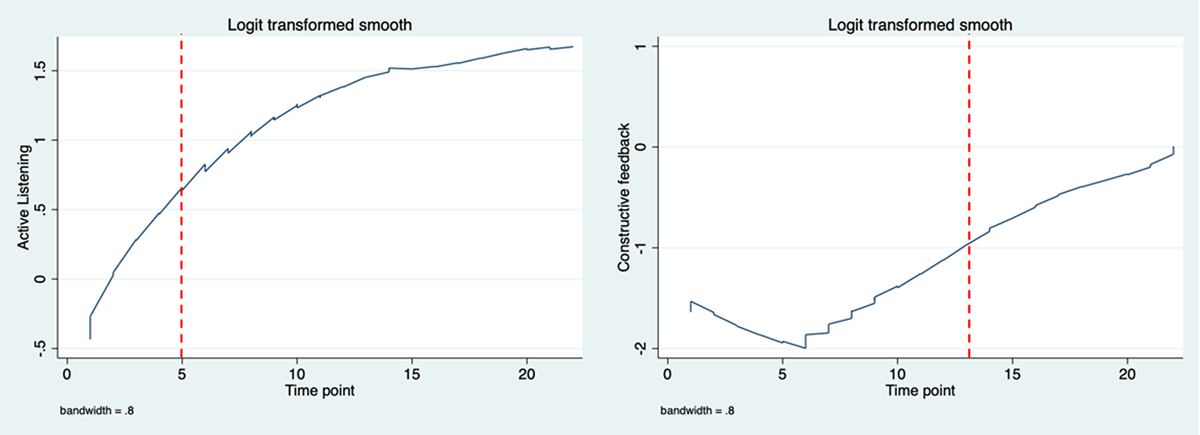
Figure 3
Probability of self-reported use of Active Listening and Constructive feedback.
Note: Red dotted line indicates when the skill was introduced in training.
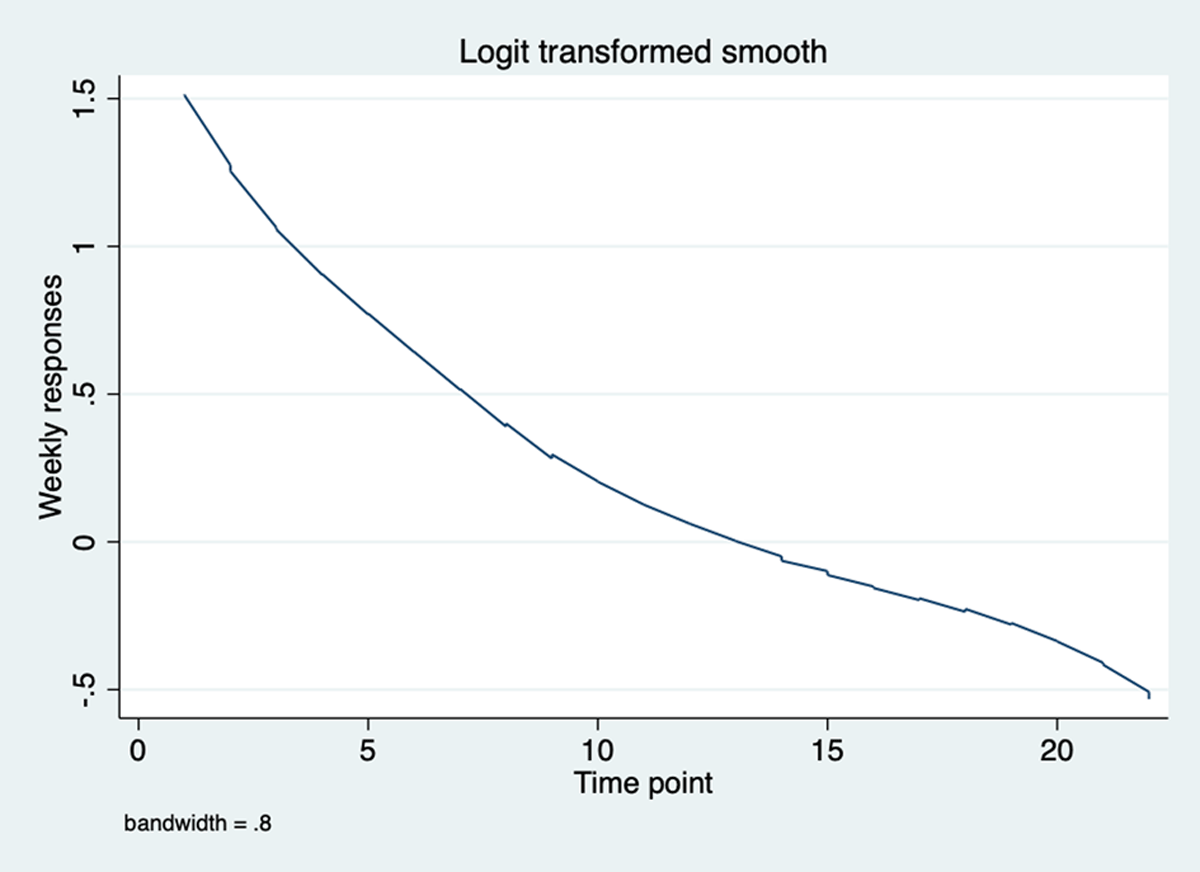
Figure 4
Probability of responding to any of the twice-weekly checklists and questions.