
Introduction
Borderline intellectual functioning (BIF) is characterised by complex adaptive and cognitive problems that limit social, academic, and work life. According to the recent consensus statement of the group of researchers, BIF Consensus Group, people with BIF are considered to have an intelligence quotient (IQ) of approximately 70–85, but not all people within this IQ range necessarily have BIF. Based on a normal distribution, 13.6% of the population fit in this range and this population can be considered to have a risk for BIF. The actual prevalence, including both IQ and adaptive problems, is unknown (Martínez-Leal et al. 2020). BIF is a poorly recognised phenomenon where scientific literature and practice guidelines are considered (see, for example, Peltopuro 2022), and currently, only one diagnostic manual, DSM-5, recognises it in an additional V-code section (American Psychiatric Association 2013).
Compared to the general population, people with BIF have a higher risk of neurodevelopmental problems, social exclusion, cognitive impairment, problems related to work and education, and poor mental and physical health (Martínez-Leal et al. 2020; Peltopuro et al. 2014; Salvador-Carulla et al. 2013). Overall, studies on BIF are fragmentary and population-based studies are particularly few in number.
This study retrospectively examined the lives of people with BIF in terms of their family, education, work, and satisfaction using a population-based sample, ‘Finland-in-Miniature’. The sample was gathered in 1962, and followed until 1998, originally to study the prevalence of intellectual disability in Finland (Ruoppila 1966; Ruoppila and Iivanainen 2011). In the present study, we compared the life conditions of people with BIF to those of the general population as well as with the sample’s two other groups identified in the assessment in 1962: people with mild intellectual disabilities (MID) and those with average intelligence but learning problems (LP) at school. Thus, this research aimed to contribute to the limited body of population-based studies on BIF by comparing the findings to the general population. Additionally, the study aimed to clarify the vulnerabilities experienced by individuals with BIF and enhance our understanding of BIF by exploring potential differences and similarities with two other better-known issues, MID and LP. For this purpose, the retrospective setting with an already-existing representative database served well, as the relevant questions were not bound to a particular time, and in the centre of this study were possible differences between groups, regardless of time.
For the first research question, we gathered comprehensive information on the life circumstances of persons with BIF, including their partnerships, family dynamics, employment history, educational background, sources of satisfaction, and experiences of a sense of exclusion.
The second question in our study aimed to explore differences between persons with BIF and the general population in various aspects. In terms of education, we anticipated that persons with BIF would possess fewer qualifications, as suggested by Hassiotis et al. (2008), who reported that persons with average intelligence tend to have a significantly higher number of qualifications compared to those with BIF (76.7% and 51.8%, respectively). We also expected lower employment rates, in line with findings from Emerson et al. (2018), who noted that 42-year-olds with BIF had an employment rate of approximately 65%, indicating marked disparities compared to their counterparts (78%).
Furthermore, we anticipated that persons with BIF would be engaged in low-skilled occupations, as indicated by Selzer et al. (2005), and a significant proportion would be involved in service occupations, following the study by Dunham, Schrader, and Dunham (2000). Notably, Dunham, Schrader, and Dunham (2000) found that 47% of vocational training candidates with BIF were placed in service occupations.
In light of our previous study involving a partially overlapping sample (Peltopuro et al. 2020), we expected a higher prevalence of disability pension among persons with BIF, with 2.7 times more pensioners in this group compared to the general population. Previous research has yielded mixed results regarding partnerships. Hassiotis et al. (2008) reported a significant difference in rates of cohabitation for persons with BIF in comparison to those with average intelligence, with rates of 56.3% and 69.5%, respectively, in a cross-sectional survey of 8450 adults in the UK. Conversely, Selzer et al. (2005), who studied 201 persons with BIF and their non-BIF siblings, found that 88% of participants in both groups were married when they reached middle age.
Regarding a sense of exclusion, limited prior research was available for adults. However, Kavanagh et al. (2018) reported an increased risk of social bullying victimization at school among adolescents with BIF, with exclusion being one of the measured factors. Persons with BIF exhibited a 40% prevalence of exclusion and a 29% elevated risk of experiencing social bullying compared to their non-BIF peers.
For life satisfaction, we had no specific expectations as there were no previous studies available on this topic.
The third research question aimed to examine the differences between the BIF group and two comparison groups (MID and LP). Generally, we anticipated lower rates in the family, education, and work domains for the MID group and higher rates for the LP group. These expectations were based on the differences in cognitive capacity and adaptive functioning between the groups. Regarding life satisfaction and a sense of exclusion, our expectations were not well-defined as previous studies did not provide sufficient information on these variables.
Methods
Participants
In 1962, a representative ‘Finland-in-Miniature’ sample was gathered from 57 municipalities nationwide. Municipalities were chosen to represent Finland in economic, social, and occupational issues, and in two official languages. All persons between two and 64 years of age who were suspected to have intellectual disability were referred to the study. As Figure 1 shows, 416,973 people (9.4% of the Finnish population) were inhabitants of the participating municipalities. Of the 4013 persons referred, 2372 persons with an IQ < 70 were diagnosed with intellectual disability. For the purpose of this study, the remaining 1376 persons were divided into two groups based on their levels of intelligence (BIF, n = 760; LP, n = 527). Participants with an IQ between 50 and 69 (MID, n = 1101) were included in this study as a comparison group. To reduce age heterogeneity between study groups, only participants aged 5–17 years (in 1962) were included in the final sample (see Table 1). The people in the LP group had average intelligence but were referred to the study due to suspected intellectual disability in 1962. This suggests they likely faced various challenges, including learning disabilities and behaviour problems. While these specific issues weren’t reported in the original study, we refer to this group as having learning problems because it is evident that they encountered challenges that affected their school performance, leading their teachers to recommend them for examination.
Table 1
Details of study groups (MID, BIF, LP) in 1962 with participants of all ages and with participants aged 5–17. Additionally, the demographic details of the participants who filled-in the Living Conditions Questionnaire in 1998.
| MID | BIF | LP | |
|---|---|---|---|
| 1962 | |||
| All n | 1101 | 760 | 527 |
| Mean age | 29.8 (SD 17.6) | 17.2 (SD 13.4) | 16.4 (SD 13.3) |
| Age 5–17 n | 377 | 537 | 368 |
| 1998 | |||
| Age 41–53 n | 170 | 156 | 91 |
| Male | 54.7% (93) | 57.1% (89) | 73.6% (67) |
| Response rate | 54.5% | 37.5% | 32.0% |
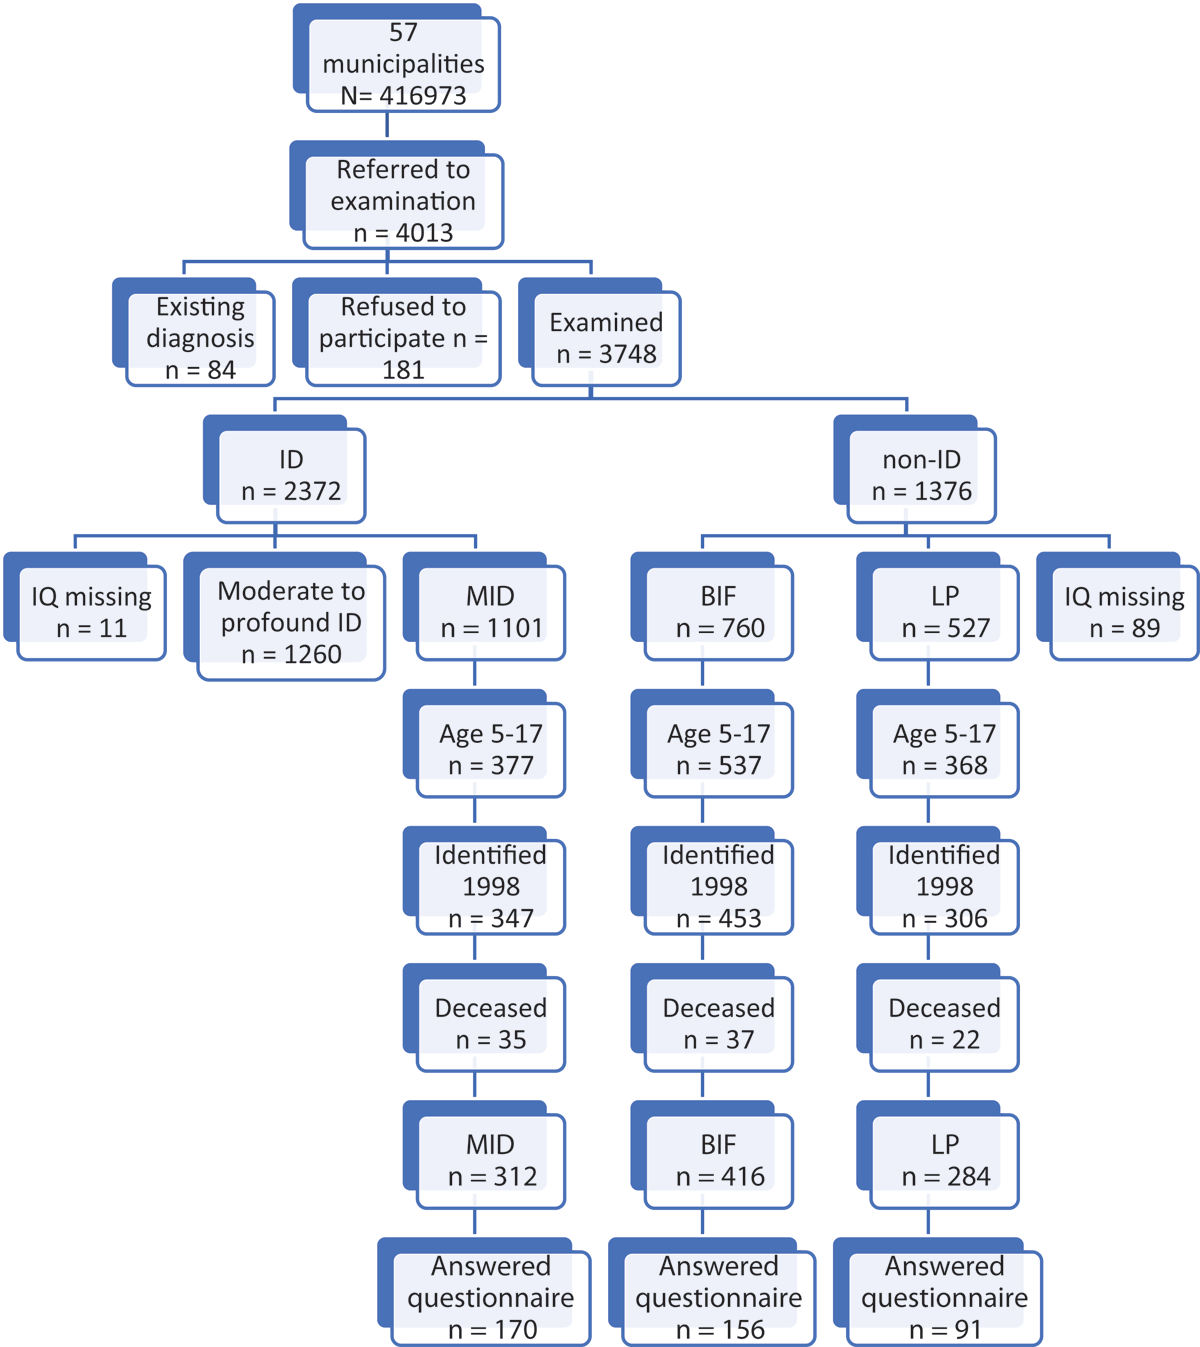
Figure 1
Attrition and grouping of persons in different phases of the study with people with ID, MID, BIF and LP.
In 1998, on the basis of social security codes, 92.0%, 84.4%, and 83.2% of the MID, BIF, and LP groups, respectively, were identified. However, in the MID, BIF, and LP groups, 65 (17.2%), 121 (22.5%), and 84 (22.8%) persons, respectively, were lost on account of death as well as failure in identifying social security codes. Loss analysis of the original data revealed no systematic selection based on age or sex. The final data were composed of those who filled-in the Living Conditions Questionnaire (Figure 1 and Table 1). Participants with disability pensions were overrepresented in the final data, as 81.2%, 69.6%, and 55.9% filled in the questionnaire, compared the response rates of the MID, BIF, and LP groups, which were 54.5%, 37.5%, and 36.7%, respectively. The participants have been described in more detail in our previous study (Peltopuro et al. 2020).
Measures and variables
In 1962, psychologists conducted a screening test for the participants to examine their intelligence levels. If the test indicated intelligence of one SD below the average, additional tests were conducted to obtain a more specific estimate of the level of intelligence. While the screening tests were Kohs block test/KTK C5 (Elonen, Takala & Ruoppila 1961a) and Kohs-Häkkinen Square Test/KTK A 3 (Elonen, Takala & Ruoppila 1961b) or Häkkinen’s Square Test (Häkkinen 1958); additional tests included measures of both verbal and non-verbal intelligence: KTK Performance Scale (Elonen, Takala & Ruoppila 1961b), Vocabulary Test (Siloma 1960), Picture Vocabulary Test (Ruoppila 1963), Ravens Coloured Progressive Matrices (Raven 1956), Kääriäinen’s Form Board Test (1962); and tests for reading, writing, and mathematics. The tests and their reliabilities have been described in detail elsewhere (Peltopuro et al. 2020; Ruoppila 1966; Ruoppila & Iivanainen 2011).
The Living Conditions Questionnaire was sent to participants who were alive in 1998 and whose postal addresses were known. The questionnaire contained 35 questions, with several sub-questions. The questions dealt with, for example, social relationships, work, education, satisfaction in life, and a sense of exclusion. The majority of the questions were answered by marking the relevant box, but there were also open questions in which participants answered by writing. Since the questionnaire was distributed to numerous individuals with intellectual disabilities, it was expected that many would require assistance to answer written questions. Participants were guided to use assistance if needed when filling out the form. More details about the content and execution of the questionnaire were described by Vesala and Matikka (2000).
Figure 2 shows categorised answers to four open questions. We employed a qualitative content analysis to categorise the open-ended questions in our study. This involved systematically reviewing each answer and assigning it to a relevant category that we had created. For instance, if a participant responded ‘Meeting children’ to the question ‘What brings you happiness?’, we assigned their answer to the category ‘Children’. We repeated this process for all responses, one by one. The first author (MP) performed the categorisation, and the other author (HV) reviewed the categories to ensure accuracy and consistency in the final outcome. In the case of disagreements, a consensus decision was made (initial agreement rate was 99%).
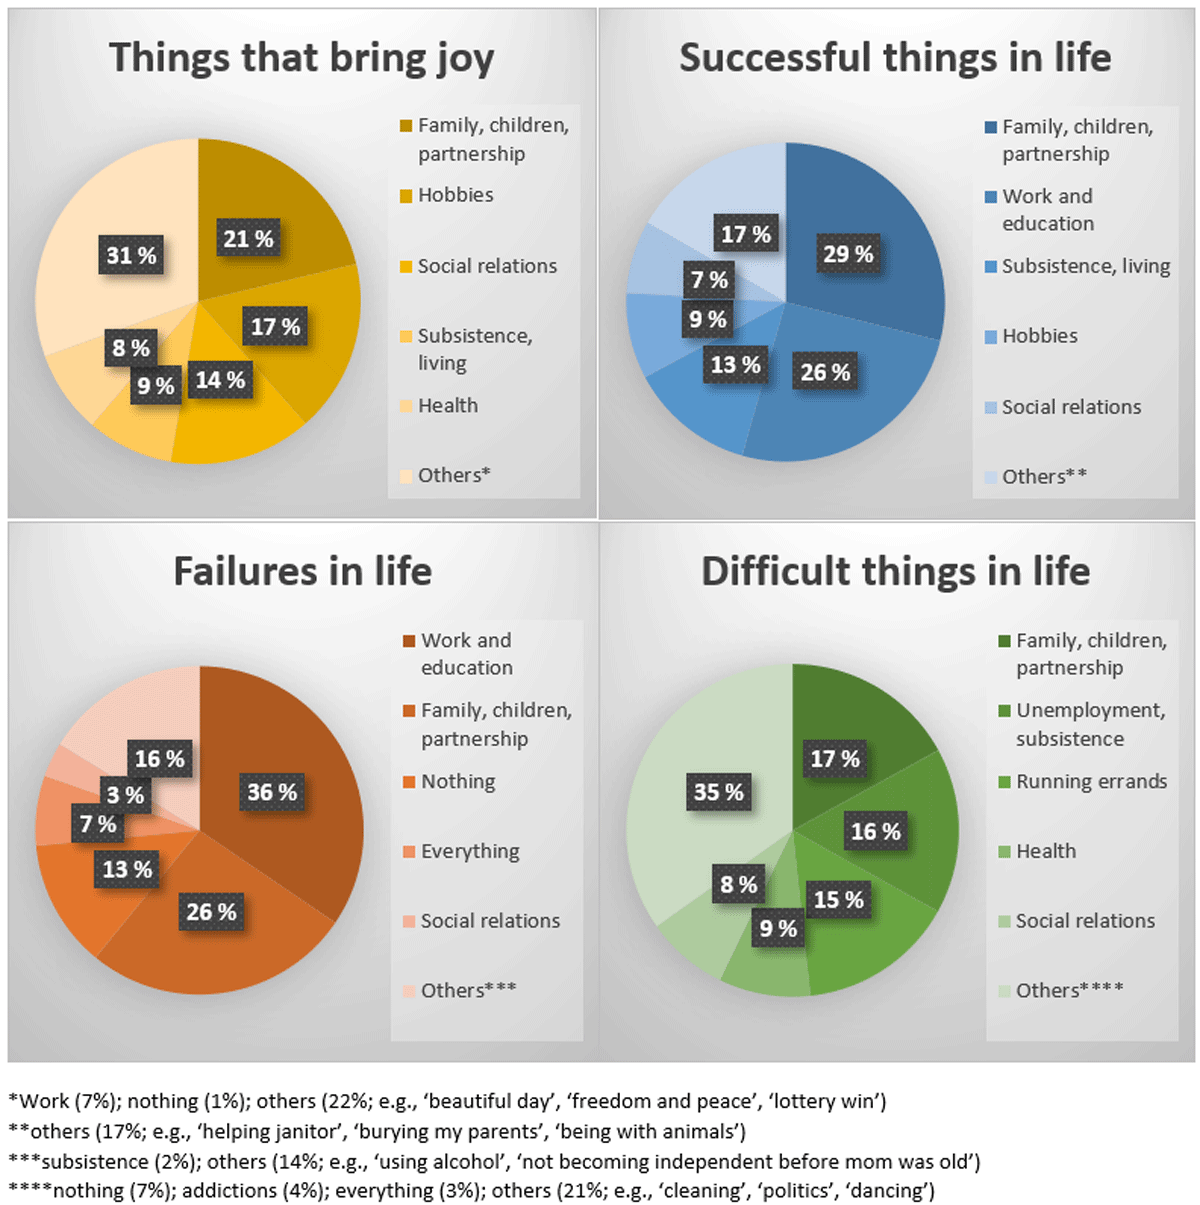
Figure 2
People with BIF gave open answers to four questions about ‘things that bring joy and satisfaction’ (n = 117; 267 answers); ‘the most successful things in life’ (n = 102; 149 answers); ‘things that have failed’ (n = 86; 87 answers); and ‘things that are difficult’ (n = 92; 112 answers). This figure shows the five most commonly answered categories for each question.
Table 2 shows answers to ‘How satisfied you are with following things in your life?’ measured using a four-point Likert scale: 1 = not at all; 2 = to some extent; 3 = fairly; and 4 = very satisfied. Table 2 also includes a category called ‘satisfied’, which combines answers 3 and 4.
Table 2
Satisfaction in life. This table shows the mean values of Likert scale answers, and proportions of answers evidencing satisfaction and dissatisfaction.
| MID | BIF | LP | F | GP | |
|---|---|---|---|---|---|
| Health | |||||
| Meana | 3.1 (SD 0.9) | 2.9 (SD 0.9) | 3.0 (SD 0.8) | 1.706ns. | |
| Satisfiedb | 75.3% | 73.9% | 73.4% | ||
| Not at all satisfiedc | 4.3% | 7.8% | 3.3% | ||
| Subsistence | |||||
| Mean | 2.9 (SD 1.0) | 2.6 (SD 1.0) | 2.5 (SD 1.0) | 7.317 *** | |
| Satisfied | 70.6% | 56.3% | 51.2% | 67.0% | |
| Not at all satisfied | 10.0% | 17.9% | 17.0% | 11.5% | |
| Living conditions | |||||
| Mean | 3.4 (SD 0.8) | 3.3 (SD 0.8) | 3.2 (SD 0.8) | 2.799ns. | |
| Satisfied | 87.0% | 83.8% | 78.4% | ||
| Not at all satisfied | 3.1% | 3.4% | 3.4% | ||
| Partnership | |||||
| Mean | 3.1 (SD 1.1) | 3.1 (SD 1.1) | 3.0 (SD 1.1) | .061ns. | |
| Satisfied | 76.1% | 73.0% | 74.6% | ||
| Not at all satisfied | 14.9% | 16.2% | 14.7% | ||
| Relation with children | |||||
| Mean | 3.3 (SD 1.1) | 3.4 (SD 1.0) | 3.5 (SD 0.9) | .922ns. | |
| Satisfied | 81.2% | 83.5% | 88.4% | ||
| Not at all satisfied | 14.6% | 10.3% | 8.7% | ||
| Relation with friends | |||||
| Mean | 3.3 (SD 0.9) | 3.1 (SD 0.9) | 3.1 SD (0.8) | 1.900ns. | |
| Satisfied | 80.8% | 76.8% | 75.0% | ||
| Not at all satisfied | 4.0% | 6.3% | 1.1% | ||
| Relation with neighbour | |||||
| Mean | 3.1 (SD 0.9) | 2.9 (SD 0.9) | 3.0 (SD 0.9) | 1.263ns. | |
| Satisfied | 73.6% | 69.0% | 71.4% | ||
| Not at all satisfied | 5.1% | 8.5% | 4.8% | ||
| Hobbies | |||||
| Mean | 3.0 (SD 1.1) | 3.0 (SD 0.9) | 2.9 (SD 1.0) | .513ns. | |
| Satisfied | 72.0% | 71.2% | 71.3% | ||
| Not at all satisfied | 14.0% | 7.2% | 11.5% | ||
| Services | |||||
| Mean | 3.1 (SD 0.9) | 2.9 (SD 0.9) | 2.9 (SD 0.8) | 1.450ns. | |
| Satisfied | 73.8% | 67.6% | 71.4% | ||
| Not at all satisfied | 7.1% | 7.6% | 4.8% | ||
| Job | |||||
| Mean | 3.1 (SD 1.1) | 2.8 (SD 1.1) | 2.8 (SD 1.1) | 2.261ns. | |
| Satisfied | 72.2% | 67.2% | 68.0% | 84.4% | |
| Not at all satisfied | 13.0% | 17.2% | 16.0% | ||
| Education | |||||
| Mean | 2.8 (SD 1.1) | 2.6 (SD 1.0) | 2.5 (SD 1.0) | 1.987ns. | |
| Satisfied | 63.8% | 54.2% | 51.8% | ||
| Not at all satisfied | 16.2% | 16.1% | 20.5% | ||
| Life in general | |||||
| Mean | 3.4 (SD 0.8) | 3.2 (SD 0.9) | 3.1 (SD 0.9) | 2.518ns. | |
| Satisfied | 88.6% | 84.4% | 79.5% | 87.5% | |
| Not at all satisfied | 2.5% | 6.1% | 5.7% | 1.0% | |
| All mean | 3.1 (SD 0.6) | 3.0 (SD 0.6) | 2.9 (SD 0.6) | 3.828 * |
[i] Note: aMean of the Likert scale from 1 to 4 answers. bPercentages of Likert scale 3 and 4 answers. cLikert scale: 1 answer.
Open answers about current or past occupation were classified into different occupational classes (Figure 3). These classes were originally provided by the Statistical Yearbook of Finland 1999 (Table 338), from which corresponding information about the general population was also obtained.
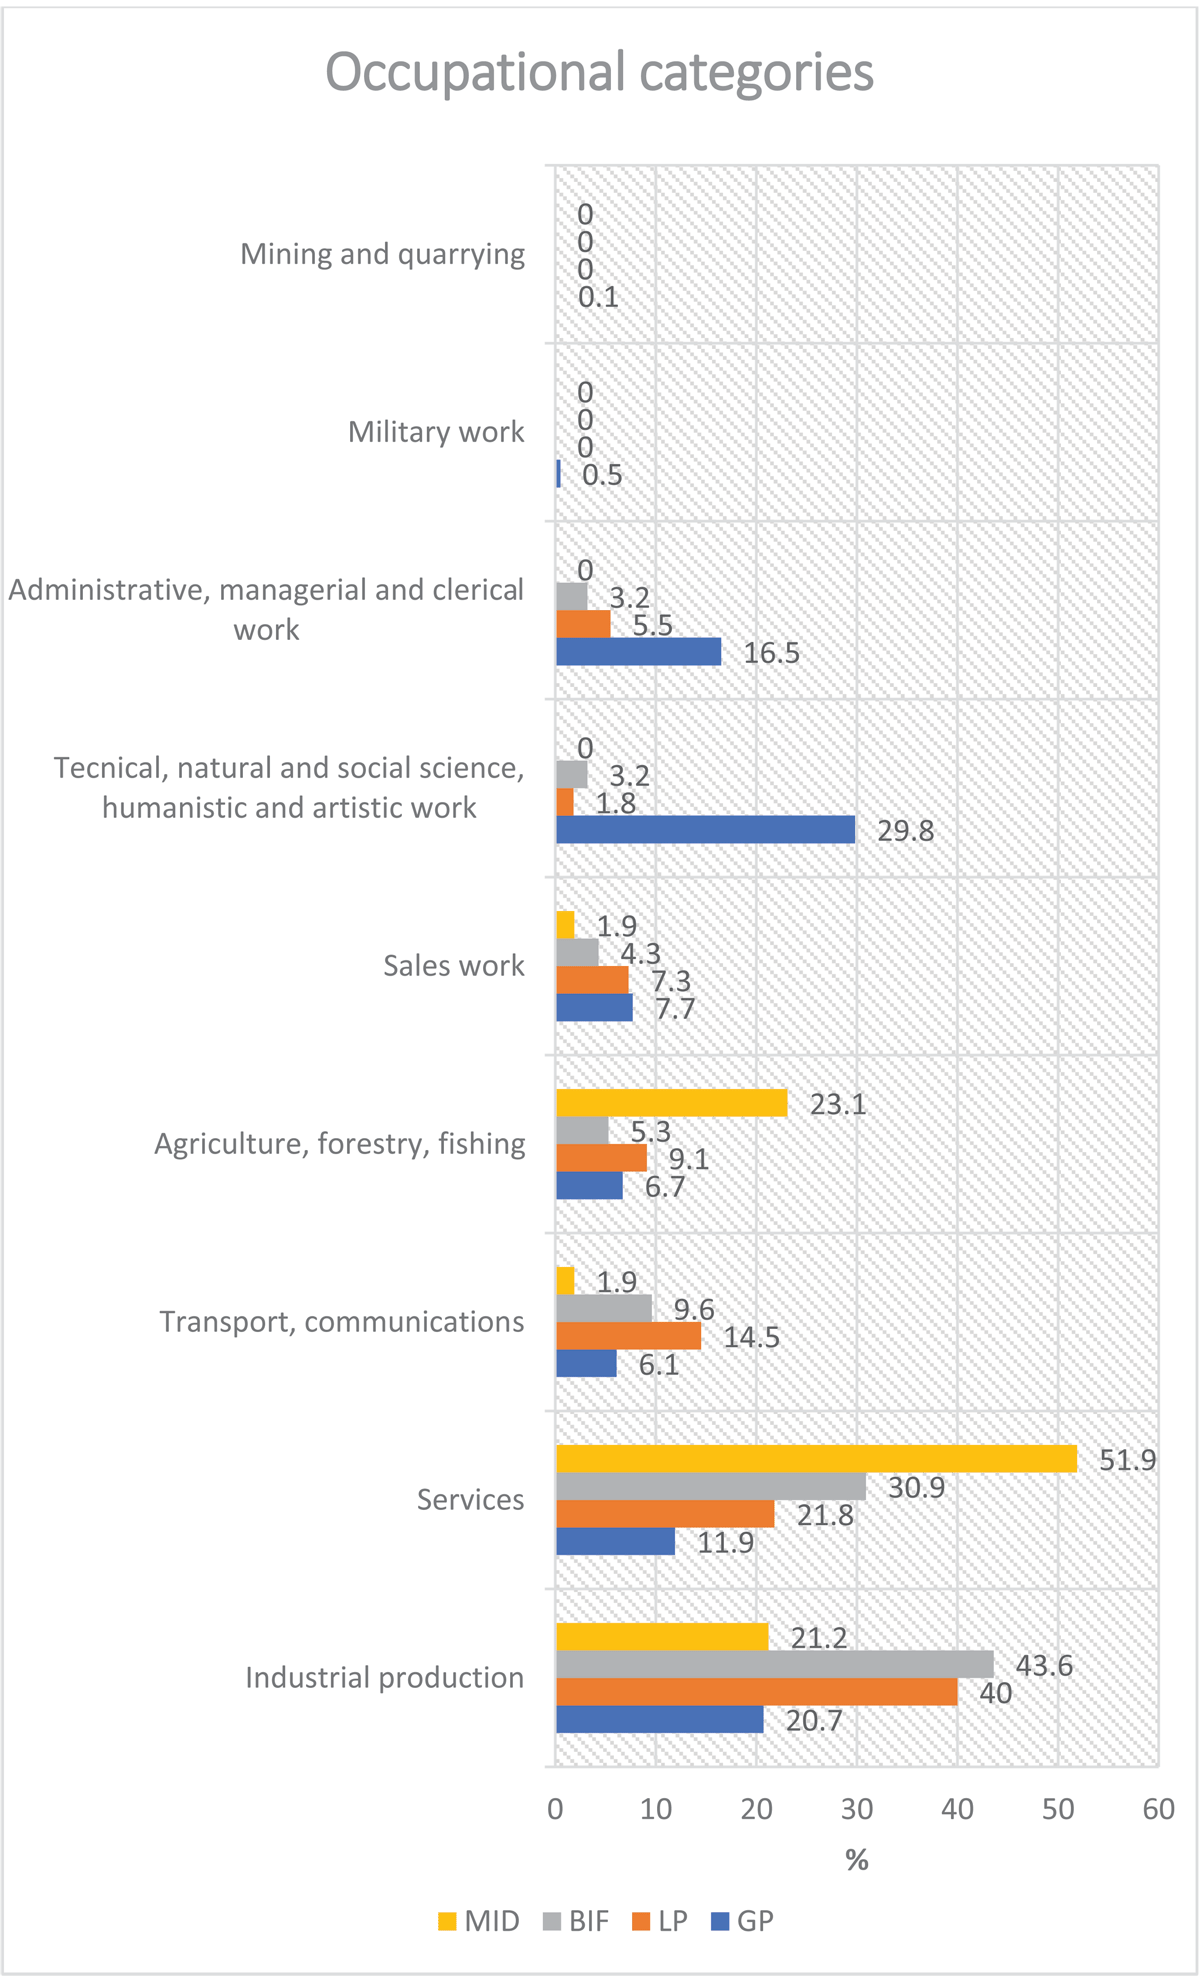
Figure 3
Occupational categories and proportions of each category in MID (MID; n = 52), BIF (BIF; n = 94), LP (LP; n = 55), and general population (GP; n = 1 130 726).
General attitudes towards occupations held by people with BIF were studied by comparing the answered occupations to the list of the most valued occupations in Finland in 2001 (see Figure 4). Market Research Company conducted research concerning attitude towards different occupations in Finland (Suomen Kuvalehti 2001). A sample of 2000 people, aged 16–64 years, representing Finland with regard to age, sex, and residence, was randomly selected for the survey. Approximately 40% of the sample responded. The survey consisted of a list of 380 occupations, each of which was evaluated by assigning numbers between one and nine (1 = worst value; 9 = best value).
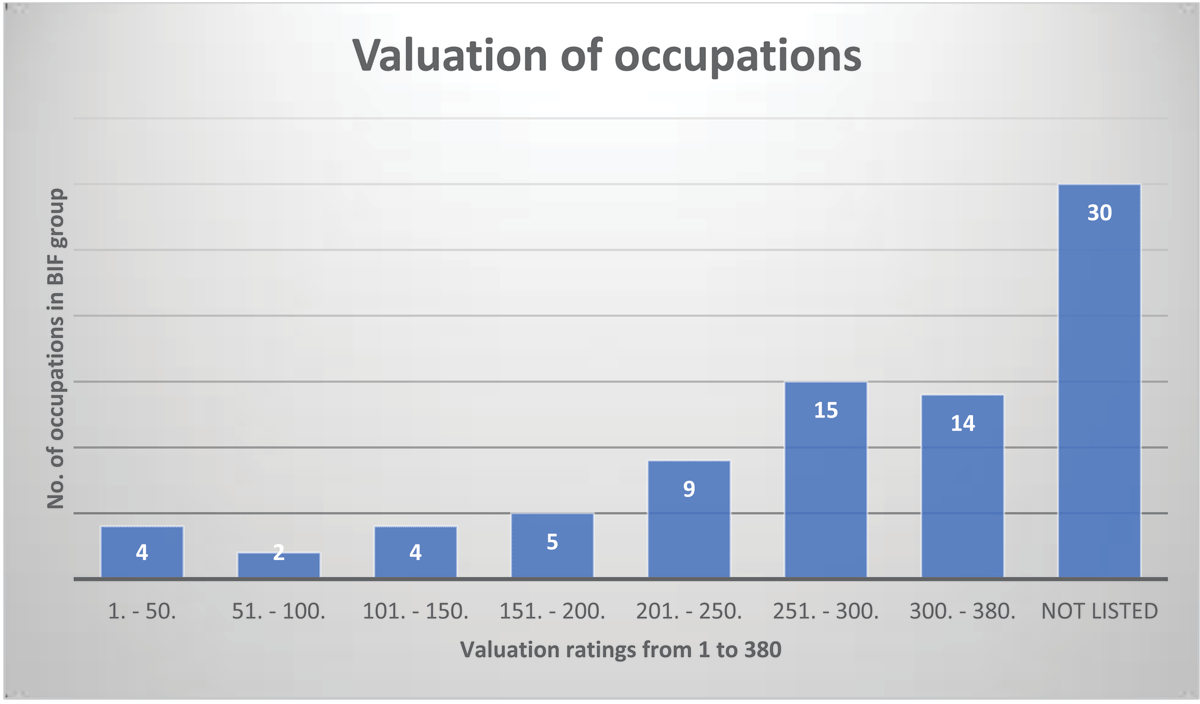
Figure 4
Occupations held by people with BIF were compared with a list of the most valued occupations in Finland. Only 6 occupations were among the first 100, and 30 were not within the 380 listed occupations.
Information about the general population in Finland was obtained from different national statistics. We aimed for information that corresponded with the year 1998 and the age group of 41–54 years as closely as possible. Information about partnership, education, and work, were collected from a Statistical Yearbook of Finland 1999 (tables 29.; 468.; 333 and 338., respectively). Information about years of schooling was obtained from NationMaster statistic database. The average number of children in the general population in the year 2000 was obtained from Official Statistics of Finland (2016). Information about general population’s satisfaction with their current job was obtained from the indicator bank Sotkanet, maintained by the Finnish Institute for Health and Welfare. Information about satisfaction with life in general, and subsistence was provided by the Finnish Business and Policy Forum EVA. The concept of subsistence refers here to the financial situation of a person in meeting basic needs.
Statistical analysis
Differences between the main groups (MID, BIF, and LP) were tested using chi-square and one-way analysis of variance. Statistical analyses were conducted using SPSS software (version 26).
Ethical questions
In 1998, the study design was examined by various offices, such as the Data Protection Ombudsman, the Ministry of Social Affairs and Health, the Ministry of Education, STAKES, the National Archives Service of Finland, the Population Register Centre of Finland, Statistics Finland, and the Social Insurance Institution, which granted the research permits.
Results
Family
More than 60% of people with BIF reported partnerships, including marriage (44.4%), cohabitation (6.5%), divorce (10.5%), and widowhood (1.3%) (see Table 3). More than half of the participants had children, with an average of 1.9 children per person.
Table 3
Information about family of the MID, BIF, LP, and GP.
| ALL | χ2/CRAMER’S V | MEN / WOMEN | χ2 | |
|---|---|---|---|---|
| Partnershipa | ||||
| MID | 28.8% (49) | 23.7% / 35.1% | 2.673ns. | |
| BIF | 63.5% (99) | } 77.65*** /.40 | 60.7% / 67.2% | .694ns. |
| LP | 76.9% (70) | 71.6% / 91.7% | 3.992* | |
| GP | 82.3% (885, 054) | 79.5% / 86.3% | ||
| Having children | ||||
| MID | 20.5% (32) | 16.3% / 25.7% | 2.107ns. | |
| BIF | 56.6% (81) | } 64.55***/.41 | 48.8% / 66.7% | 4.607* |
| LP | 67.8% (61) | 61.2% / 87.0% | 4.522* | |
| No. of children | ||||
| MID | 1.88 (min 1, max 5) | |||
| BIF | 1.94 (min 1, max 4) | } F = 6.801** | ||
| LP | 2.55 (min 1, max 7) | |||
| GP | 1.82 |
[i] Note: aIncludes marriage, cohabitation, divorce, and widowhood.
In the general population, 64.2% were married, 16.9% were divorced, and 1.8% were widowed. There was an average of 1.8 children per person.
There were significant differences between the study groups regarding partnership, having children, and number of children (see Table 3). Systematically, the MID group had the lowest number of partnerships and children, and the LP group the highest number.
Satisfaction in life
Table 2 shows satisfaction in different areas of life. In the BIF group, relation with children, living conditions, and life in general had the highest mean values, and answers indicating satisfaction with these were provided by more than 80% of these participants. Subsistence, education, and jobs had the lowest mean values, and high rates of answers that indicated respondents were not at all satisfied. There were no significant gender-based differences in this group.
With jobs, subsistence, and life in general, the general population had higher proportions of answers corresponding to satisfaction; and with subsistence and life in general, lower rates of answers corresponding to not at all satisfied. Other statistics for the general population were not available. Group comparisons between MID, BIF, and LP showed differences only in satisfaction with subsistence, with higher values in the MID group than the other two. Similar to people with BIF, in the MID and LP groups, relation with children, living, and life in general had the highest mean values, and subsistence, education, and jobs had the lowest mean values.
As Table 4 shows, almost half of the participants with BIF experienced a sense of exclusion. Most often, exclusion was experienced in school, during childhood, at home, and at work. Women experienced a greater sense of exclusion in childhood homes than men (23.9%, 11.8%, respectively, p. < 0.05) and with friends (14.9%, 9.4%, respectively, p. < 0.05). Otherwise, there were no significant gender-based differences, although there was a trend of a higher percentage of women reporting a sense of exclusion (53.7% vs. 43.0% of men).
Table 4
Sense of exclusion in life.
| MID | BIF | LP | χ2 / CRAMER’S V | |
|---|---|---|---|---|
| Sense of exclusion | 46.0% (75) | 47.7% (73) | 40.9% (36) | 1.067ns. /.04 |
| Childhood home | 14.8% (24) | 17.1% (26) | 6.9% (6) | 4.963ns. /.11 |
| School | 29.0% (47) | 24.3% (37) | 26.4% (23) | .878ns. /.05 |
| Work | 9.9% (16) | 14.5% (22) | 11.5% (10) | 1.597ns. /.06 |
| Friends | 11.7% (19) | 11.8% (18) | 13.8% (12) | .257ns. /.03 |
| Free time | 9.9% (16) | 10.5% (16) | 10.3% (9) | .038ns. /.01 |
| Neighbours | 6.8% (11) | 11.2% (17) | 4.6% (4) | 3.793ns. /.10 |
| Other | 4.9% (8) | 7.2% (11) | 3.4% (3) | 1.689ns. /.07 |
There were no significant differences between the MID, BIF, and LP groups in terms of a sense of exclusion. However, there were differences regarding the places where exclusion was experienced the most. With all groups, the most common place was school.
Figure 2 shows the most commonly answered categories in the BIF group for open questions about joy, success, failure, and difficulties in life. Family, children, and partnerships were the most common answers to questions about joy, success, and difficulties and the second most common answers to failure. Work and education were often cited in response to questions about both success and failure.
Work and education
Table 5 shows that almost 90% of people with BIF had completed elementary school. The drop-out rate was 7.3%, and 4.0% reported not having attend school at all. Altogether, 37.3% had finished a secondary school. The drop-out rate was 7.3% in secondary school as well.
Table 5
Work and education with MID, BIF, LP, and GP.
| χ2 / CRAMER’S V | MEN / WOMEN | χ2 | ||
|---|---|---|---|---|
| Work | ||||
| MID | 12.5% (21) | 15.0% / 9.2% | ||
| BIF | 43.6% (68) | 44.9% / 41.8% | ||
| LP | 54.9% (50) | 55.2% / 54.2% | ||
| GP | 88.1% | |||
| Full-time job | ||||
| MID | 8.9% (15) | 11.8% / 5.3% | 2,229ns. | |
| BIF | 35.9% (56) | } 60,226*** /.38 | 43.8% / 25.4% | 5,653* |
| LP | 51.6% (47) | 55.2% / 41.7% | 1.301ns. | |
| Part-time job | ||||
| MID | 3.6% (6) | 3.2% / 3.9% | ,064ns. | |
| BIF | 7.7% (12) | } 3,649ns. /.09 | 1.1% / 16.4% | 12,592*** |
| LP | 3.3% (3) | 0.0% / 12.5% | 8,661** | |
| Unemployed | ||||
| MID | 10.7% (18) | 10.8% / 10.5% | ,002ns. | |
| BIF | 23.1% (36) | } 9,239** /.15 | 20.2% / 26.9% | ,950ns. |
| LP | 15.4% (14) | 17.9% / 8.3% | 1,245ns. | |
| GP | 8.9% | |||
| Pensioner | ||||
| MID | 63.9% (108) | 63.4% / 64.5% | ,019ns. | |
| BIF | 30.8% (48) | } 58,005*** /.37 | 29.2% / 32.8% | ,235ns. |
| LP | 20.9% (19) | 20.9% / 20.8% | ,000ns. | |
| GP | 5.3% | |||
| Elementary school | ||||
| MID | 54.4% (86) | |||
| BIF | 88.7% (133) | } 58,347*** /.27 | ||
| LP | 87.8% (79) | |||
| Vocational school | ||||
| MID | 20.9% (33) | |||
| BIF | 36.0% (54) | } 23,225*** /.17 | ||
| LP | 48.9% (44) | |||
| Upper secondary school | ||||
| MID | 0.0% (0) | |||
| BIF | 1.3% (2) | } 4.771ns. /.08 | ||
| LP | 2.2% (2) | |||
| Years of schooling | ||||
| MID | 7.1 (SD 3.1, min 0, max 18) | 6.6 / 7.7 | ||
| BIF | 9.4 (SD 2.6, min 3, max 22) | } F = 36,929*** | 9.6 / 9.2 | |
| LP | 9.9 (SD 2.6, min 5, max 20) | 10.0 / 9.8 | ||
| GP | 10.0 |
In the general population group, 66.4% had completed secondary school. This was 29.1% higher than the BIF group. On average, they had 10 years of schooling.
There were significant differences in the rates of finishing schools between study groups; there were fewer elementary school and vocational school qualifications in the MID group and more in the LP group than in the BIF group. There were significant differences in the average number of years of schooling between the MID, BIF, and LP groups, with the MID group having fewer years than the other two groups.
Table 5 shows that in 1998, 43.6% of participants with BIF were either employed full-time or part-time. Mostly, men had full-time jobs, and women had part-time jobs. Almost 1/4 of the participants were unemployed, and almost 1/3 were granted disability pension.
In the general population, the number of employed people was two times higher than in the BIF group. People with BIF were 2.6 times more often unemployed and 5.8 times more often pensioners than their peers in the general population.
There were significant differences between the MID, BIF, and LP groups regarding full-time jobs, unemployment, and disability pensions but not with part-time jobs (see Table 5). People with MID had the smallest number of full-time jobs and unemployment and the most pensioners. The LP group had the largest number of full-time jobs and the least pensioners.
Figure 3 shows occupational categories and proportions for the MID, BIF, LP, and general population groups. In the BIF group, 74.5% of the occupations belonged to the categories of industrial production and services. Differences from the general population were particularly clear in occupational categories requiring a high degree of education (science, art, administrative work).
The study of the most valued occupations in Finland listed 380 occupations that the general population valued the most in 2001. Figure 4 shows that out of 83 occupations reported by people with BIF, 64% were found on the list. Of these, 6 were among the 100 most valued occupations (police, businessman, nurse, engineer, lecturer, caregiver), and more than 70% of occupations ranked between 200 and 380. The most common occupations were cleaning (7), painting (3), and unskilled work (3).
Discussion
In middle age, participants with BIF had had evident difficulties in achieving partnership, education, and work. Many were unemployed or were granted a disability pension. Occupations were often in industrial and service fields and were not highly valued by the general opinion, even though they brought satisfaction to the employee. Half of them experienced a sense of exclusion at some point in their lives. Even though participants with BIF had evident difficulties, many seemed to be fairly satisfied with their life. Differences between the BIF and general population were observed in terms of partnerships, qualifications, employment, disability pensions, occupational position, and satisfaction, all in favour of the general population. Compared to those with BIF, the participants with MID had fewer, and participants with LP had more partnerships, education, and work. There were no major differences in satisfaction or a sense of exclusion between the groups.
Our results indicate that people with BIF are less likely to have partners than their peers in the general population. The results support the findings of Hassiotis et al. (2008) and contradict those of Seltzer et al. (2005). A possible reason for this difference is that although the original sample of Seltzer et al. included participants with an intelligence quotient at the level of BIF, they were high school students. Hence, it is likely that they did not have major problems in adaptive functioning. Therefore, as the definition of BIF includes both lower than average intelligence and challenges in adaptive behaviour, these data are probably not the most representative of people with BIF.
The majority of participants with BIF had finished only elementary school, and among those who continued studying, most had qualifications from vocational schools. There was a notable difference in schooling between the people with BIF and general population in terms of completing secondary school; there were almost 30% more qualifications in the general population. This result was expected based on a previous study by Hassiotis et al. (2008), who found that the average intellectual functioning group had far more qualifications than the BIF group.
A larger proportion of people in the general population had a job, and far fewer were unemployed than in the BIF group. This result is in line with previous findings by Emerson et al. (2018), although they reported higher employment rate in the BIF group (65%), than was found in our study. A disability pension was granted to almost 1/3 of the BIF group, 5.8 times more than the general population. Based on our earlier study with the partly same population with BIF (Peltopuro et al. 2020), we expected to see major differences regarding pension rates because these previous results indicated rates to be 2.7 times higher in the BIF group than in general population. In this study, the results showed even higher rates.
There is evidence that people with BIF often have low-skilled work with low income (Peltopuro et al. 2014), and are often employed in the field of service (Dunham, Schrader & Dunham, 2000). Our study provides support for both low-skilled work and the finding that many persons with BIF belong to service occupations. As Figure 3 shows, the two most common occupational categories were industrial production and services to which 75% of all reported occupations belonged. Qualifications are not necessary for these categories. In case of the general population, about 45% of the occupations belonged to categories where high education is needed. Only 6.4% of occupations in the BIF group belonged to these categories.
Occupations in the BIF group were not highly valued by general opinion (Figure 4). Clearly, occupations held by people with BIF were not the most desired. We were unable to find any previous studies on the topic, but it is logical to think that the low-skilled and poorly-paid occupations found in previous studies (Peltopuro et al. 2014) are not desirable.
Almost half of the people with BIF had a sense of exclusion, most of them in school and in their childhood home. There are no available general population-related data about exclusion in schools at the time when our participants were pupils, but data from Finnish School Health Promotion study between 2000 and 2021 reported bullying rates of 6.4% -8.5% among pupils in 8th and 9th years of comprehensive school (Sotkanet 2021). Bullying, as an umbrella term, includes exclusion. It is likely that bullying was far more common in the 1960s and 70s, but a proportion of 1/4 of the people with BIF feeling excluded in school, as reported in our study, seems to be significantly high. Our findings are not only in line with previously reported higher rates of experienced social bullying among adolescents with BIF (Kavanagh et al. 2018), but also provide support for studies showing negative experiences faced with children with BIF in school and/or at home. There is evidence that people with BIF have generally had more than average adverse childhood experiences (Hassiotis et al. 2019). Additionally, Fenning et al. reported that children with BIF face less positive and sensitive parenting than their peers with ID or typically-developed peers. Their mothers also reported more problem behaviours, even if independent observations did not confirm this. Researchers concluded that parents lacked an explanatory model for children’s difficulties, which is why children with BIF are at risk of poor parenting (Fenning et al. 2007; Fenning et al. 2014). In order to diminish high levels of a sense of exclusion at childhood homes and at school in the future, it would be important, that children with BIF would be routinely recognised; and also, surrounding people, e.g., parents and teachers, should be educated about the core traits of BIF so that they can gain better understanding of the child’s behaviour and the support that child with BIF needs.
To our knowledge, there have been no prior studies on BIF and life satisfaction. Overall, people with BIF were fairly satisfied with their lives (see Table 2). Relations with children, living conditions, and life in general brought about the most satisfaction, whereas subsistence, education, and jobs were aspects with the least satisfaction. Even though satisfaction at the group level was fairly high, when compared to peers in the general population, people with BIF show vulnerability regarding job satisfaction, subsistence, and life in general. Although previous studies on BIF and life satisfaction are lacking, it could be argued that this result aligns with previously reported findings of lower quality of life (QoL) among people with ID compared to those without ID (Simões and Santos 2016). Concept of QoL refers to the overall well-being and satisfaction experienced by persons in various aspects of their lives (e.g. the physical, mental, emotional, and social well-being).
When people with BIF were asked to describe things that bring joy and satisfaction to their lives, the five most typical answers were related to family, hobbies, social relations, subsistence, and health (see Figure 2). This is in line with previous Finnish population-based study about important things that bring happiness wherein family, health, social relations, being loved, and secured subsistence were the five most cited issues (Finnish Business and Policy Forum EVA 2005). Interestingly, when asked about things that people with BIF felt were successful in life, and things that had failed in life, education, and work were commonly cited. Thus, work and education seem to be important for both feelings of success and failure. The families answered all open questions in high proportions. On the one hand, family was thought to bring joy and satisfaction, and it was in those aspects that people felt they had succeeded. On the other hand, it was reported to be among things that had failed and been difficult in life. It is logical to think that important things in life, such as family and work, when successful, bring a great deal of satisfaction, and failure in these cause unsatisfactory feelings. Both incidences can be seen in the open answers of our data (Figure 2).
As expected, there were several differences between the BIF and MID groups. People with MID markedly had fewer partnerships and children. Only a little more than half had finished elementary school, and of those, 1/5 had finished vocational school, which was notably less than that in the BIF group. Both employment and unemployment were clearly lower than in the BIF group. This is explained by the high proportion of pensioners; 64% people with MID were pensioners, which may reflect the typical challenges concerning ID and ability to work. More than half of those employed were engaged in occupations categorised as services, whereas within the BIF group, the most typical category was industrial production. Satisfaction with life events was fairly similar between the groups, except that people with MID were more satisfied with their subsistence. This might be explained by the fact that even if people with MID worked less, they had more secure subsistence because of the high proportions of pensions. Furthermore, recent disability research has emphasised precariousness and precarity (uncertainty and vulnerability related to economic and social status) as factors contributing to reduced well-being (see for example Kittay 2021). This could also explain our observation of individuals with BIF being less satisfied with their subsistence.
Recently, the concept of quality of life has received increasing attention in disability research. Generally, previous studies have found that intelligence has an influence on quality of life. Specifically, individuals with more severe intellectual disabilities tend to experience lower levels of quality of life compared to those with milder intellectual disabilities (Nota et al. 2007). However, our study yielded different results for persons with MID, BIF, and LP, as all three groups exhibited relatively similar levels of life satisfaction, except for of the point noted above regarding persons with MID, who reported higher satisfaction regarding their subsistence. This raises the question: could it be possible that factors other than intelligence, such as more complex aspects of life, have a greater impact on life satisfaction for individuals with higher intelligence levels (in this case, MID, BIF, and LP) compared to those with more severe intellectual disabilities? There were also differences between participants with BIF and those with LP. The latter had more partnerships and children than the former. Almost 92% of women in LP group were in a partnership, whereas 67% of women were in a partnership in the BIF group. Both groups had similar proportions of finishing elementary school, but more people in the LP group had completed vocational school. They also worked more often; there were more full-time jobs and fewer part-time jobs and pensions, and less unemployment. The most common occupational categories in both groups were industrial production and services (see Figure 3). Satisfaction with life events and the feeling of exclusion were fairly similar in both groups. However, there were differences in where the feeling of exclusion was experienced. In the BIF group, childhood homes were the second place where exclusion was experienced (17%), whereas childhood homes ranked only fifth in this regard (7%) in the LP group.
Overall, as expected, people with MID exhibited a lesser incidence of, and people with LP showed a higher incidence of, partnerships, education, and work than their counterparts in the BIF group. This could be explained by differences in cognitive and adaptive functioning. However, there were no major differences in life satisfaction or sense of exclusion between the groups. This indicates that other issues than, for example cognitive capacity, create these subjective experiences.
Limitations
The response rate of the Living Condition Questionnaire was 38% in the BIF group. The sample may be biased towards more serious adaptive problems because a large proportion, almost 70%, of people with BIF and disability pensions answered the questionnaire. This indicates that people with disability pensions were overrepresented in the present study, and the generalisation of the results to the whole population with BIF should be done with caution. A method involving the use of questionnaires inherently possesses certain limitations. For instance, individuals with limited or no reading and writing abilities may face difficulties in providing responses. To mitigate this potential issue, we sought to alleviate it by providing clear instructions and guidance for questionnaire completion, as well as encouraging the use of external assistance when necessary.
Although we were able to use several relevant national statistics in our study, some information was not available. When information of the exact year 1998 and age range of 41–54 years was unavailable, we used information as proximate to that as possible. Information about the general population and satisfaction was only partial, and information on sense of exclusion was unavailable.
While the original data were collected almost 25 years ago, we believe that the results of our study are highly relevant. The purpose of this study was to compare differences between BIF and GP, MID, and LP by using representative population-based setting, and the particular point in time was less relevant. Population-based studies concerning BIF are largely lacking, and that is why retrospective settings, and utilisation of already existing databases are useful in order to increase basic knowledge about BIF. In addition to that, in the future, more population-based research is needed with more recent data. It can be supposed, as the current era seem to be more complex, fast, and informative that the situation is now even worse for people with BIF than it was 25 years ago. Jobs have become more complicated, or often replaced by machinery, which leaves people with BIF even fewer choices in work markets. Personal flexibility, resilience, and independent reasoning are needed to navigate through everyday tasks in society. Unfortunately, people with BIF still lack support systems that target them.
Conclusions
People with BIF are more vulnerable than their peers in the general population regarding partnership, education, work, a sense of exclusion, and life satisfaction. It could be concluded that people with average intelligence, irrespective of whether they had learning problems or not, obtained higher levels of education which resulted in opportunities for employment in jobs that were perceived by society as more desirable in terms of status and financial rewards, leading to reduced job insecurity and precariousness.
Many people with BIF were unemployed or disability pensioners. Those who had worked held occupations that needed unskilled labour and were unvalued based on the general opinion. However, many felt satisfied with their work, and many reported that work was something they had succeeded in life. Clearly, if work gives feelings of succession and satisfaction to people with BIF, in spite of being considered unskilled and unvalued, it is essential that society finds ways to support their employment.
Based on our findings between MID, BIF and LP, differences in cognitive and adaptive functioning may have an influence on family formation, education, and work but not necessarily to subjective experiences, such as satisfaction and sense of exclusion.
For future research, retrospective utilisation of existing databases, as in the present study, would be a promising tool to rapidly increase knowledge about BIF and provide a population-wide understanding of BIF as a global phenomenon. The future research concerning partnerships and employment could sharpen the focus to reasons behind low incidences, in order to enable to find suitable support. That is, research should ask why is it difficult for people with BIF to form a lasting partnership or to have and hold a job. More research is needed about the current situation of sense of exclusion, particularly in childhood homes and at school, and also about the means to prevent the exclusion.
Acknowledgements
The authors wish to thank emeritus professor Isto Ruoppila for his assistance on this work.
Funding Information
This study was funded by the Finnish Slot Machine Association, Finnish Cultural Foundation, Häme Regional Fund and Finnish Brain Foundation sr.
Competing Interests
The authors have no competing interest to declare.