
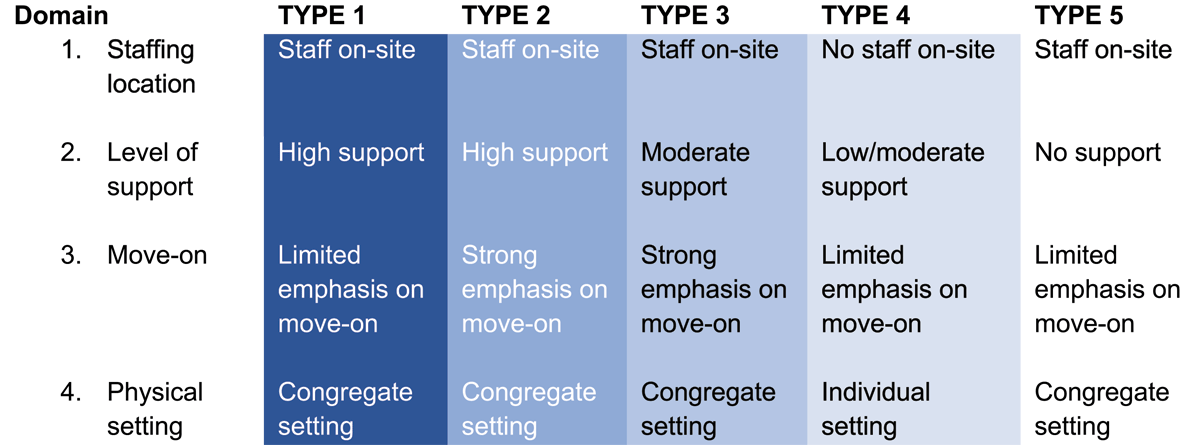
Figure 1
STAX-SA (from McPherson, Krotofil & Killaspy 2018).
Table 1
Municipalities included in the study.
| SITE | MUNICIPALITY TYPE | POPULATION | LOCATION | ACCOMMODATION UNITS |
|---|---|---|---|---|
| A | Large city | 130,000 | North | 34 |
| B | Rural | 4,000 | North | 3 |
| C | Smaller city | 60,000 | North | 6 |
| D | Smaller city | 11,000 | Mid | 2 |
| E | Municipality close to metropolitan area | 100,000 | Mid | 6 |
| F | District in metropolitan area | 100,000 | Mid | 5 |
| G | Smaller city | 15,000 | South | 3 |
| H | Smaller city | 65,000 | South | 12 |
| I | Rural | 9,000 | South | 2 |
| J | Large city | 90,000 | South | 15 |
| Total: | 88 | |||
| Additional sites | ||||
| K | Large city | 100,000 | Mid | 20 |
| L | Large city | 115,000 | South | 14 |
| Total: | 122 |
Table 2
Demographic data.
| SITE | A-J | K, L | TOTAL |
|---|---|---|---|
| Accommodation services | 88 | 34 | 122 |
| Number of service users | 2,165 | 894 | 3,059 |
| Distribution of sex | |||
| - Women | - 46.4 | ||
| - Men | - 53.4 | ||
| - Other | - 0.2 | ||
| Staff | 766 | 301 | 1,067 |