
Table 1
Demographics of participants.
| Participants | Total (N = 35) |
|---|---|
| Age (range) | |
| 20-40 | 9 |
| 41-60 | 22 |
| Above 60 | 4 |
| Gender | |
| Female | 34 |
| Male | 1 |
| Working hours | |
| Full time | 31 |
| Part time | 3 |
| No data | 1 |
| Experience of the LSS Act as a social worker | |
| <1 year | 2 |
| 1-2 years | 6 |
| 3-5 years | 5 |
| 6-10 years | 8 |
| >10 years | 14 |
| Previous experience of working with people with disabilities | |
| Yes | 27 |
| No | 8 |
| Type of education | |
| University degree in social work | 16 |
| Other university degree | 13 |
| No data | 6 |
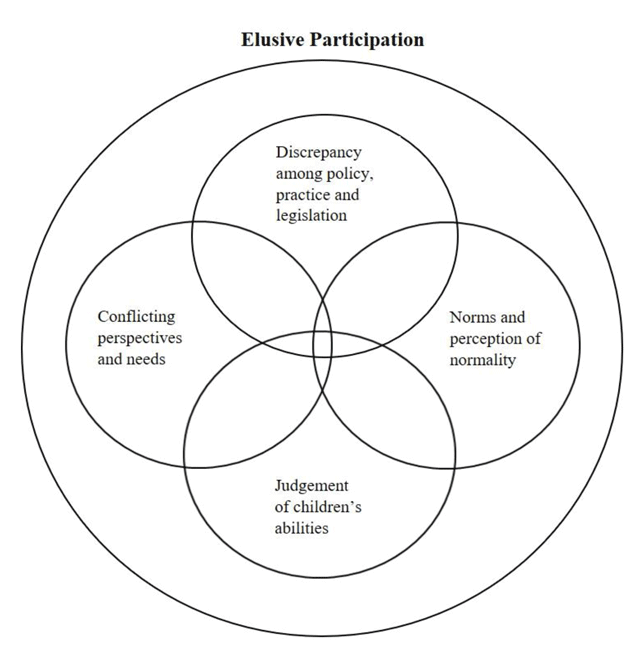
Figure 1
The essence of elusive participation. The figure shows the general structure of the phenomenon of elusive participation. The overlapping circles indicate that different parts of this experience intersect with each other and that, taken together, they create an experience of elusive participation.