
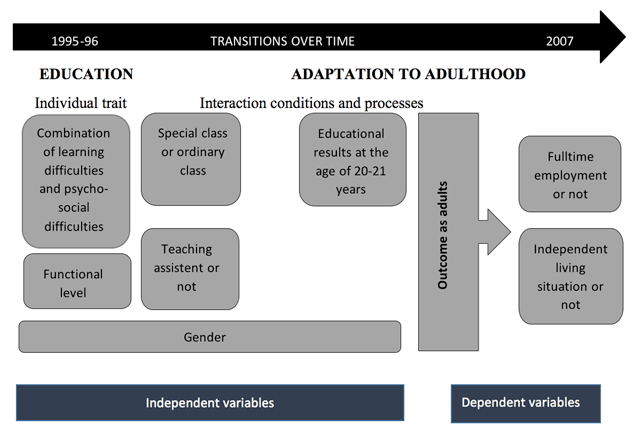
Figure 1
Assumed relationships among individual and structural factors, participation in full-time employment and type of living situation at age 28 to 29 years.
Table 1
Multivariate analysis. How six independent variables affect adaptation to adult life in two domains of life among former students on special terms aged 28–29 years, odd ratios.
| Risk of not having full-time employment N = 357 | Risk of dependent living situation N = 357 | |||
|---|---|---|---|---|
| Types of difficulties | ||||
| 0. No PSD or LD | ||||
| 1. LD but no PSD | 0.7 | 1.3 | ||
| 2. PSD but no LD | 3.4 | ** | 2.6 | * |
| 3. PSD and LD | 2.4 | * | 2.9 | * |
| Functional level | ||||
| 0. Functional level, first and second tercile | ||||
| 1. Functional level, third tercile | 0.9 | 2.4 | * | |
| Teaching assistant or not | ||||
| 0. No teaching assistant | ||||
| 1. Teaching assistant | 2.3 | * | 1.3 | |
| Type of class | ||||
| 0. Regular class | ||||
| 1. Special class | 1.4 | 1.1 | ||
| Educational results at the age of 20–21 | ||||
| 0. Not delayed or did not drop out of school | ||||
| 1. Delayed or dropped out of school | 1.7 | * | 1.0 | |
| Gender | ||||
| 0. Male | ||||
| 1. Female | 6.8 | *** | 0.5 | * |
| Nagelkerke R2 | 0.314 | 0.124 | ||
[i] Note: +p < 0.10; *p < 0.05; **p < 0.01; ***p < 0.001. 0 is the reference category for each variable. The Nagelkerke R2 coefficient indicates that the model fit is reasonably good, especially in terms of full-time employment.