
Table 1
Descriptive statistics for all independent variables by employment category. Mean (SD) or percentages.
| Min | Max | Total | Never worked | Continued | Employed | p-value | |
|---|---|---|---|---|---|---|---|
| Gender (women = 1) | 0 | 1 | 33.0 | 30.3 | 37.5 | 32.4 | 0.615 |
| Age at time of interview | 21 | 66 | 49.5(11.6) | 52.0(11.9) | 48.8(13.0) | 48.2(10.3) | 0.045 |
| Age at time of spinal cord injury | 0 | 65 | 29.5(14.4) | 35.9(16.1) | 25.5(11.1) | 27.3(13.3) | <0.001 |
| Paraplegia | 0 | 1 | 65.0 | 55.1 | 72.2 | 67.7 | 0.051 |
| Complete injury | 0 | 1 | 51.9 | 56.2 | 50.0 | 50.0 | 0.621 |
| Received vocational rehabilitation or not | 0.327 | ||||||
| No vocational rehabilitation (reference) | 56.2 | 62.9 | 52.8 | 53.7 | |||
| No rehabilitation | 0 | 1 | 5.4 | 6.7 | 2.8 | 5.9 | |
| Vocational rehabilitation received | 0 | 1 | 38.4 | 30.3 | 44.4 | 40.4 | |
| Able or not to continue working in same organisation | <0.001 | ||||||
| Not able to continue same organisation (reference) | 39.4 | 56.2 | 43.0 | 26.5 | |||
| Not working or item-missing | 0 | 1 | 32.0 | 33.7 | 31.9 | 30.9 | |
| Able to continue working in same organisation | 0 | 1 | 28.6 | 10.1 | 25.0 | 42.7 | |
| Highest achieved educational level | <0.001 | ||||||
| Primary education (reference) | 42.0 | 65.2 | 38.9 | 28.7 | |||
| Secondary education | 0 | 1 | 32.3 | 28.1 | 34.7 | 33.8 | |
| Tertiary education | 0 | 1 | 25.6 | 6.7 | 26.4 | 37.5 | |
| European Socioeconomic Classification | 0.068 | ||||||
| Not employed before spinal cord injury (reference) | 37.0 | 38.2 | 38.9 | 35.3 | |||
| Upper professionals, managers and self-employed | 0 | 1 | 8.4 | 5.6 | 4.2 | 12.5 | |
| Lower professionals and managers | 0 | 1 | 16.5 | 11.2 | 12.5 | 22.1 | |
| Upper and lower routine non-manual workers | 0 | 1 | 6.7 | 6.7 | 6.9 | 6.7 | |
| Foremen and technicians | 0 | 1 | 7.0 | 7.9 | 5.6 | 7.4 | |
| Skilled workers | 0 | 1 | 3.4 | 4.5 | 1.4 | 3.7 | |
| Semi- and unskilled workers | 0 | 1 | 18.5 | 24.7 | 20.8 | 13.2 | |
| N | 297 | 89 | 72 | 136 |
[i] Note: All ANOVA and chi-square tests were done with the total sample size N = 297.
| Men (N = 199) | Women (N = 98) | |||||||
|---|---|---|---|---|---|---|---|---|
| Model 1 | Model 2 | Model 1 | Model 2 | |||||
| OR | p | OR | p | OR | p | OR | p | |
| Gender (women = 1) | ||||||||
| Age at time of interview | 1.04(0.99–1.09) | 0.095 | 0.98(0.93–1.04) | 0.609 | ||||
| Age at time of spinal cord injury | 0.87(0.83–0.92) | <0.001 | 0.91(0.88–0.94) | <0.001 | 0.93(0.88–0.99) | 0.021 | 0.94(0.90–0.98) | 0.005 |
| Paraplegia | 2.52(1.05–6.03) | 0.037 | 2.44(1.06–5.62) | 0.035 | 0.73(0.18–2.85) | 0.651 | ||
| Complete injury | 0.79(0.30–2.03) | 0.630 | 0.61(0.18–2.06) | 0.433 | ||||
| Received vocational rehabilitation | 0.017 | 0.054 | 0.851 | |||||
| No vocational rehabilitation (reference) | 1.00 | 1.00 | 1.00 | |||||
| No rehabilitation | 0.25(0.02–3.16) | 0.286 | 0.38(0.03–4.25) | 0.439 | 0.73(0.07–7.70) | 0.798 | ||
| Vocational rehabilitation received | 3.18(1.24–8.16) | 0.016 | 2.52(1.05–6.08) | 0.038 | 1.35(0.34–5.38) | 0.663 | ||
| Continue working in same organisation | 0.001 | <0.001 | 0.022 | 0.053 | ||||
| Not able (reference) | 1.00 | 1.00 | 1.00 | 1.00 | ||||
| Not working or item-missing | 1.12(0.15–8.10) | 0.904 | 0.59(0.22–1.56) | 0.295 | 0.42(0.035–5.23) | 0.506 | 0.88(0.26–3.04) | 0.852 |
| Able to continue working | 17.44(4.01–75.82) | <0.001 | 16.34(4.33–61.57) | <0.001 | 1.35(0.34–5.38) | 0.663 | 5.09(1.23–21.00) | 0.024 |
| Highest achieved educational level | 0.001 | <0.001 | 0.033 | 0.055 | ||||
| Primary education (reference) | 1.00 | 1.00 | 1.00 | 1.00 | ||||
| Secondary education | 3.32(1.28–8.56) | 0.013 | 3.56(1.49–8.49) | 0.004 | 1.60(0.38–6.65) | 0.514 | 1.84(0.58–5.82) | 0.300 |
| Tertiary education | 41.28(4.78–356.50) | 0.001 | 35.57(5.07–249.14) | <0.001 | 8.05(1.67–38.73) | 0.009 | 5.37(1.35–21.28) | 0.017 |
| European Socioeconomic Classification | 0.607 | 0.202 | ||||||
| Not employed before SCI (reference) | 1.00 | 1.00 | ||||||
| Upper professionals, managers and self-employed | 7.02(0.54–91.43) | 0.137 | a | |||||
| Lower professionals and managers | 3.44(0.28–42.29) | 0.334 | 0.031(0.01–7.27) | 0.468 | ||||
| Upper/lower routine non-man. workers | 6.49(0.46–91.61) | 0.166 | 1.95(0.07–55.13) | 0.693 | ||||
| Foremen and technicians | 2.35(0.24–22.60) | 0.459 | b | |||||
| Skilled workers | 8.82(0.33–234.67) | 0.193 | 0.89(0.04–17.12) | 0.940 | ||||
| Semi- and unskilled workers | 1.61(0.22–11.87) | 0.636 | 0.09(0.00–1.86) | 0.121 | ||||
| –2LL = 142.01 HL-test: p = 0.959 | –2LL = 149.53 HL-test: p = 0.789 | –2LL = 85.10 HL-test: p = 0.404 | –2LL = 94.32 HL-test: p = 0.142 | |||||
[i] Notes: All statistical hypothesis tests are Wald tests. a In model 1 for women no cases scored 1 on the dependent variable among upper professionals, managers and self-employed. For that particular model this category was merged with the category “Lower professionals and managers”. b In the female sample there were no foremen or technicians.
| Model 1 | Model 2 | |||
|---|---|---|---|---|
| OR | p | OR | p | |
| Gender (women = 1) | 0.79(0.36–1.72) | 0.564 | ||
| Age at time of interview | 1.01(0.98–1.04) | 0.429 | ||
| Age at time of spinal cord injury | 0.90(0.87–0.94) | <0.001 | 0.92(0.90–0.95) | <0.001 |
| Paraplegia | 1.51(0.77–2.96) | 0.224 | ||
| Complete injury | 0.94(0.48–1.83) | 0.872 | ||
| Received vocational rehabilitation or not | 0.022 | 0.038 | ||
| No vocational rehabilitation (reference) | 1.00 | 1.00 | ||
| No rehabilitation | 0.31(0.06–1.53) | 0.152 | 0.48(0.11–2.07) | 0.331 |
| Vocational rehabilitation received | 2.13(1.03–4.40) | 0.040 | 2.06(1.04–4.06) | 0.037 |
| Able or not to continue working in same organisation | <0.001 | <0.001 | ||
| Not able to continue same organisation (reference) | 1.00 | 1.00 | ||
| Not working or item-missing | 0.54(0.11–2.50) | 0.434 | 0.67(0.31–1.41) | 0.296 |
| Able to continue working in same organisation | 11.54(4.08–32.64) | <0.001 | 10.50(4.08–27.02) | <0.001 |
| Highest achieved educational level | <0.001 | <0.001 | ||
| Primary education (reference) | 1.00 | 1.00 | ||
| Secondary education | 2.40(1.17–4.90) | 0.016 | 2.69(1.37–5.26) | 0.004 |
| Tertiary education | 14.13(4.37–46.80) | <0.001 | 13.48(4.51–40.33) | <0.001 |
| European Socioeconomic Classification | 0.217 | |||
| Not employed before spinal cord injury (reference) | 1.00 | |||
| Upper professionals, managers and self-employed | 2.20(0.26–18.39) | 0.467 | ||
| Lower professionals and managers | 0.80(0.12–5.28) | 0.823 | ||
| Upper and lower routine non-manual workers | 2.76(0.37–20.27) | 0.318 | ||
| Foremen and technicians | 0.77(0.11–5.02) | 0.785 | ||
| Skilled workers | 2.22(0.29–16.89) | 0.440 | ||
| Semi- and unskilled workers | 0.48(0.09–2.38) | 0.370 | ||
| –2LL = 241.11 HL-test: p = 0.305 | –2LL = 252.64 HL-test: p = 0.078 | |||
Table 3
Logistic regression of working or not working at the time of interview if ever worked after rehabilitation. Odds ratios.
| Men (N = 137) | Total (N = 208) | |||||||
|---|---|---|---|---|---|---|---|---|
| Model 1 | Model 2 | Model 1 | Model 2 | |||||
| OR | p | OR | p | OR | p | OR | p | |
| Gender (women = 1) | 0.91(0.43–1.90) | 0.806 | ||||||
| Age at time of interview | 1.74(1.22–2.47) | 0.002 | 1.56(1.14–2.15) | 0.005 | 1.52(1.20–1.93) | <0.001 | 1.39(1.14–1.71) | 0.001 |
| Age at time of interview squared | 0.99(0.99–0.99) | 0.001 | 0.99(0.99–0.99) | 0.003 | 0.99(0.99–0.99) | <0.001 | 0.99(0.99–0.99) | 0.001 |
| Age at time of spinal cord injury | 1.00(0.94–1.05) | 0.929 | 1.00(0.96–1.04) | 0.857 | ||||
| Paraplegia | 1.37(0.51–3.65) | 0.521 | 0.76(0.37–1.57) | 0.464 | ||||
| Complete injury | 1.61(0.64–4.07) | 0.308 | 1.11(0.56–2.18) | 0.758 | ||||
| Received vocational rehabilitation or not | 0.489 | 0.356 | ||||||
| No vocational rehabilitation (reference) | 1.00 | 1.00 | ||||||
| No rehabilitation | 0.22(0.02–2.61) | 0.234 | 3.09(0.51–18.44) | 0.215 | ||||
| Vocational rehabilitation received | 0.91(0.33–2.46) | 0.858 | 1.41(0.67–2.97) | 0.356 | ||||
| Able or not to continue working in same organisation | 0.068 | 0.002 | 0.058 | 0.003 | ||||
| Not able to continue same organisation (reference) | 1.00 | 1.00 | 1.00 | 1.00 | ||||
| Not working or item-missing | 0.71(0.07–6.91) | 0.775 | 1.55(0.61–3.91) | 0.352 | 1.41(0.31–6.30) | 0.651 | 1.68(0.81–3.48) | 0.160 |
| Able to continue working in same organisation | 4.50(1.24–16.25) | 0.022 | 6.21(2.22–17.41) | 0.002 | 3.26(1.21–8.76) | 0.019 | 3.96(1.79–8.80) | 0.001 |
| Highest achieved educational level | 0.220 | 0.580 | ||||||
| Primary education (reference) | 1.00 | 1.00 | ||||||
| Secondary education | 2.43(0.87–6.71) | 0.087 | 1.32(0.60–2.90) | 0.479 | ||||
| Tertiary education | 1.78(0.55–5.76) | 0.333 | 1.52(0.66–3.50) | 0.319 | ||||
| European Socioeconomic Classification | 0.166 | 0.256 | ||||||
| Not employed before spinal cord injury (reference) | 1.00 | 1.00 | ||||||
| Upper professionals, managers and self-employed | 0.82(0.04–13.74) | 0.892 | 2.44(0.28–21.21) | 0.418 | ||||
| Lower professionals and managers | 1.05(0.07–15.60) | 0.971 | 1.32(0.21–8.38) | 0.763 | ||||
| Upper and lower routine non-manual workers | 0.16(0.01–2.67) | 0.204 | 0.88(0.12–6.36) | 0.900 | ||||
| Foremen and technicians | 0.73(0.06–9.11) | 0.812 | 1.49(0.22–9.71) | 0.676 | ||||
| Skilled workers | 0.03(0.00–0.92) | 0.044 | 0.25(0.03–1.70) | 0.157 | ||||
| Semi- and unskilled workers | 0.32(0.03–3.28) | 0.343 | 0.60(0.12–3.03) | 0.539 | ||||
| –2LL = 136.33 HL-test: p = 0.091 | –2LL = 151.57 HL-test: p = 0.536 | –2LL = 232.59 HL-test: p = 0.899 | –2LL = 246.24 HL-test: p = 0.260 | |||||
[i] Note: All statistical hypothesis tests are Wald tests.
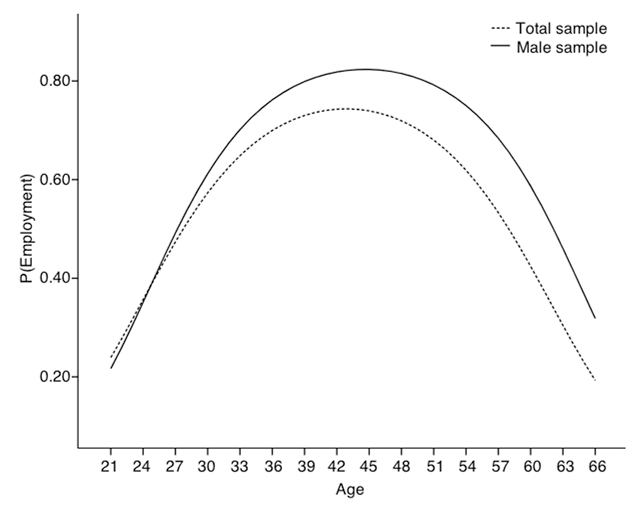
Figure 1
Predicted probabilities of employment at the time of interview by age among those who worked after rehabilitation.
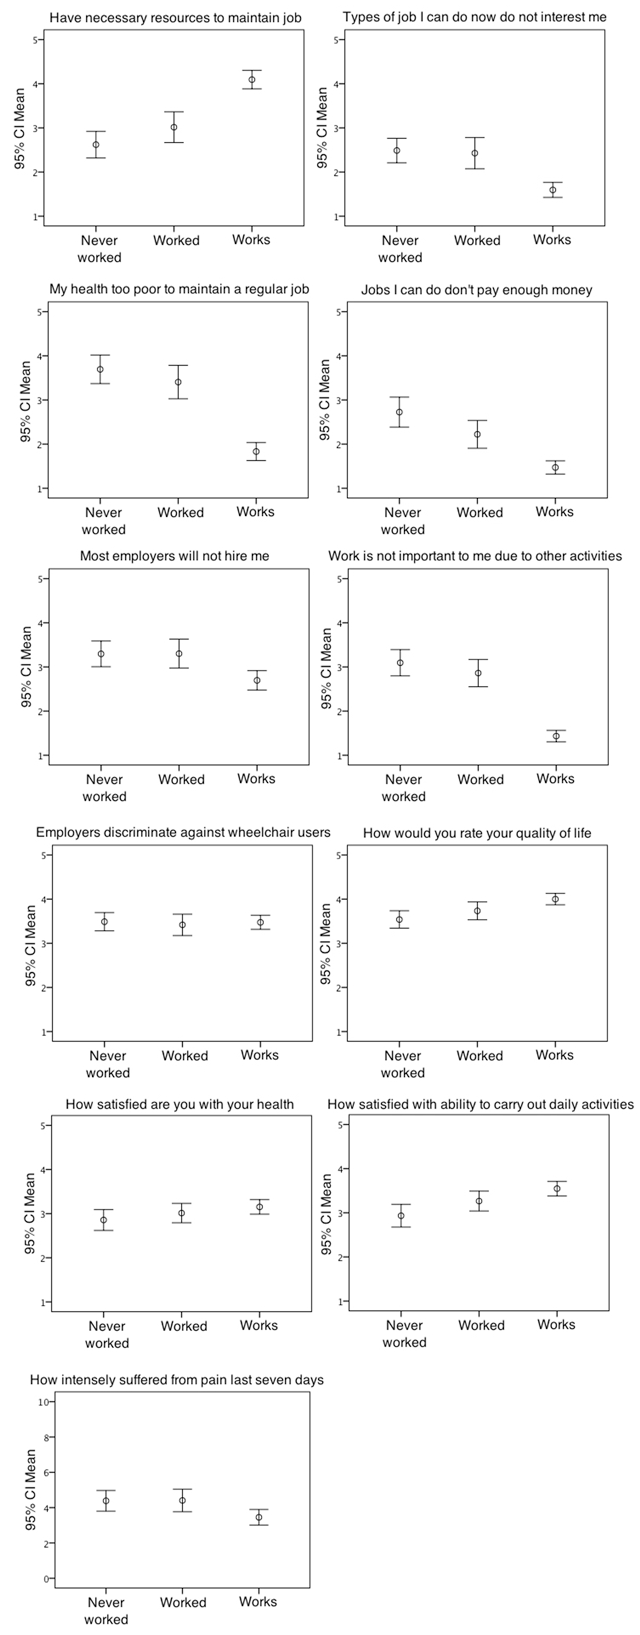
Figure 2
Mean scores with 95% confidence intervals for all 11 scales by employment status groups.
Table 4
ANOVA-analysis of job motivation, discrimination, quality of life, health and pain suffering, with means and standard deviations.
| Means with 95% CI | ANOVA | Scheffe’s Post-Hoc tests | |||||||||
|---|---|---|---|---|---|---|---|---|---|---|---|
| Min | Max | Total | Group 1 | Group 2 | Group 3 | 1vs2vs3 | 1vs2 | 2vs3 | 1vs3 | N | |
| 1. Resources to maintain job | 1 | 5 | 3.43(3.26–3.61) | 2.62(2.32–2.92) | 3.02(2.67–3.36) | 4.09(3.89–4.30) | <0.001 | 0.199 | <0.001 | <0.001 | 281 |
| 2. Types of jobs not interesting | 1 | 5 | 2.04(1.89–2.19) | 2.49(2.21–2.76) | 2.43(2.08–2.78) | 1.60(1.42–1.77) | <0.001 | 0.957 | <0.001 | <0.001 | 279 |
| 3. Health too poor to work | 1 | 5 | 2.73(2.54–2.92) | 3.70(3.37–4.02) | 3.41(3.03–3.79) | 1.83(1.63–2.04) | <0.001 | 0.448 | <0.001 | <0.001 | 283 |
| 4. Jobs don’t pay enough | 1 | 5 | 2.00(1.85–2.15) | 2.73(2.39–3.06) | 2.22(1.91–2.54) | 1.47(1.32–1.62) | <0.001 | 0.043 | <0.001 | <0.001 | 279 |
| 5. Employers will not hire me | 1 | 5 | 3.01(2.85–3.16) | 3.30(3.00–3.59) | 3.30(2.97–3.63) | 2.70(2.48–2.92) | 0.001 | 1.000 | <0.010 | <0.005 | 279 |
| 6. Work is not important to me | 1 | 5 | 2.25(2.09–2.40) | 3.10(2.80–3.39) | 2.86(2.55–3.17) | 1.43(1.31–1.56) | <0.001 | 0.429 | <0.001 | <0.001 | 285 |
| 7. Employers discriminate | 1 | 5 | 3.46(3.35–3.58) | 3.49(3.28–3.70) | 3.42(3.18–3.66) | 3.47(3.31–3.63) | 0.886 | 306 | |||
| 8. Quality of life | 1 | 5 | 3.79(3.70–3.89) | 3.54(3.34–3.74) | 3.73(3.53–3.94) | 4.00(3.87–4.13) | <0.001 | 0.335 | 0.092 | <0.001 | 307 |
| 9. Satisfied with health | 1 | 5 | 3.03(2.91–3.15) | 2.86(2.62–3.09) | 3.01(2.79–3.23) | 3.15(2.99–3.32) | 0.104 | 307 | |||
| 10. Carry out activities | 1 | 5 | 3.29(3.17–3.41) | 2.93(2.68–3.19) | 3.27(3.04–3.49) | 3.55(3.38–3.71) | <0.001 | 0.130 | 0.175 | <0.001 | 305 |
| 11. Suffered from pain | 0 | 10 | 3.97(3.66–4.28) | 4.38(3.80–4.97) | 4.41(3.76–5.05) | 3.45(3.01–3.90) | 0.013 | 0.999 | 0.051 | 0.045 | 309 |
[i] Note: Group 1 represent those who never worked after SCI. Group 2 are those who returned to work but do not work at the time of interview. Group 3 are those who are still working at the time of interview.