
Table 1
Summary statistics of outcome and control variables by parental education.
| VARIABLES | TOTAL | COMPULSORY-EDUCATED PARENT | SECONDARY-EDUCATED PARENT | ONE PARENT TERTIARY EDUCATED | BOTH PARENTS TERTIARY EDUCATED | INDIVIDUALS WITH NO EDUCATION INFORMATION |
|---|---|---|---|---|---|---|
| Proportion who received the benefit | 22.16 | 26.25 | 23.55 | 21.68 | 20.83 | 12.25 |
| Hours compensated if any compensateda | 445.58 (207.67) | 435.07 (197.66) | 436.50 (203.07) | 457.02 (212.40) | 466.38 (223.84) | 385.56 (124.01) |
| Proportion of girls | 41.85 | 42.88 | 41.29 | 42.66 | 40.07 | 47.05 |
| Age of child in yearsa | 8.96 (4.80) | 9.65 (4.75) | 9.24 (4.84) | 8.81 (4.80) | 8.25 (4.65) | 8.95 (4.66) |
| Proportion where both parents are born outside Sweden | 27.11 | 60.17 | 18.27 | 23.80 | 16.11 | 98.08 |
| Age of mother at birth in yearsa | 30.26 (5.58) | 26.59 (6.70) | 29.41 (5.47) | 31.40 (5.20) | 32.52 (4.22) | 26.66 (5.77) |
| Age of father at birth in yearsa | 33.33 (6.52) | 31.21 (8.39) | 32.63 (6.54) | 34.19 (6.30) | 34.65 (5.37) | 30.94 (6.78) |
| GMFCS average level of the child | 2.33 | 2.59 | 2.33 | 2.29 | 2.24 | 2.46 |
| Proportions by GMFCS level of the child: | ||||||
| I | 47.23 | 37.33 | 46.46 | 48.94 | 51.39 | 44.96 |
| II | 14.19 | 17.24 | 14.81 | 13.93 | 12.04 | 13.87 |
| III | 10.55 | 12.22 | 10.96 | 9.97 | 10.22 | 8.79 |
| IV | 14.05 | 15.16 | 14.46 | 13.19 | 13.78 | 14.38 |
| V | 13.98 | 18.05 | 13.31 | 13.93 | 12.58 | 18.01 |
| Total number of observations | 50,621 | 4,286 | 20,520 | 13,208 | 9,897 | 2,710 |
| Total number of individuals | 4,881 | 458 | 1,945 | 1,269 | 931 | 278 |
[i] GMFCS = Gross Motor Function Classification System, a = standard deviation indicated in parentheses.
Table 2
Parental educational level and receipt of personal assistance compensation for their child with cerebral palsy.
| MODEL 1: CRUDE ASSOCIATION | MODEL 2: 1 + ADJUSTED FOR DEMOGRAPHIC VARIABLES | MODEL 3: 2 + ADJUSTED FOR GMFCS LEVEL | ||||
|---|---|---|---|---|---|---|
| OR (CI) | HOURS (CI) | OR (CI) | HOURS (CI) | OR (CI) | HOURS (CI) | |
| Education | ||||||
| Compulsory (reference) | 1.00 | 114.20 | 1.00 | 87.32 | 1.00 | 85.47 |
| Secondary | 0.87 (0.69, 1.08) | –11.39 (–31.82, 9.04) | 1.21 (0.93, 1.57) | 13.60 (–5.26, 32.45) | 1.43 (1.03, 1.99) | 13.09 (1.19, 25.01) |
| One parent tertiary educated | 0.78 (0.61, 0.98) | –15.10 (–36.56, 9.04) | 1.08 (0.82, 1.42) | 11.24 (–8.08, 31.29) | 1.28 (0.90, 1.81) | 14.66 (1.79, 27.52) |
| Both parents tertiary educated | 0.74 (0.58, 0.95) | –17.03 (–39.51, 5.45) | 1.16 (0.87, 1.55) | 19.39 (–2.60, 41.39) | 1.49 (1.03, 2.16) | 24.62 (10.46, 38.77) |
| Observations | 47,911 | 46,452 | 44,681 | |||
| Individuals | 4,603 | 4,428 | 4,265 | |||
[i] OR = Odds ratio, Hours = hours of personal assistance compensated per month. 95% confidence intervals are indicated in parenthesis, and significance results at the 5% level are indicated in bold.
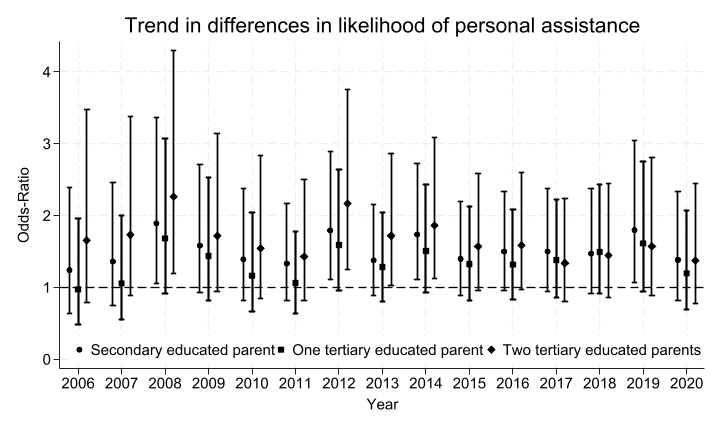
Figure 1
Trend in differences in the likelihood of receiving personal assistance compensation between parental educational levels between 2006 and 2020.
Point estimate and 95% confidence intervals for differences between educational groups in odds of receiving personal assistance compensation compared to the compulsory-educated group in each year. Estimates are derived from the fully adjusted model.
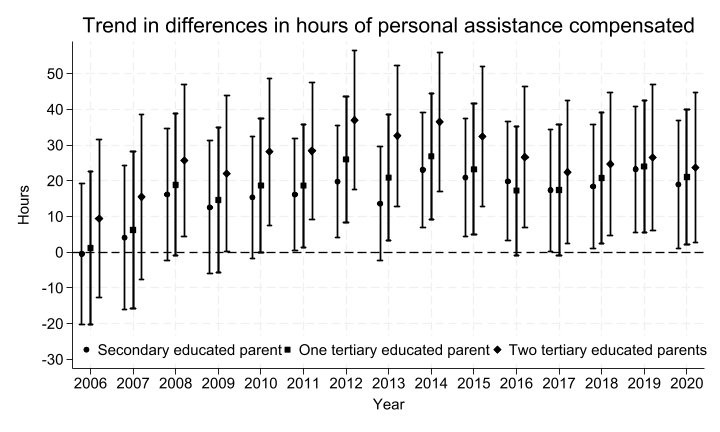
Figure 2
Trend in differences in the number of personal assistance hours compensated between parental educational levels between 2006 and 2020.
Point estimate and 95% confidence intervals for differences between educational groups in hours compensated compared to the compulsory-educated group in each year. Estimates are derived from the fully adjusted model.