

Figure 1
The methodology presented in a series of four phases.
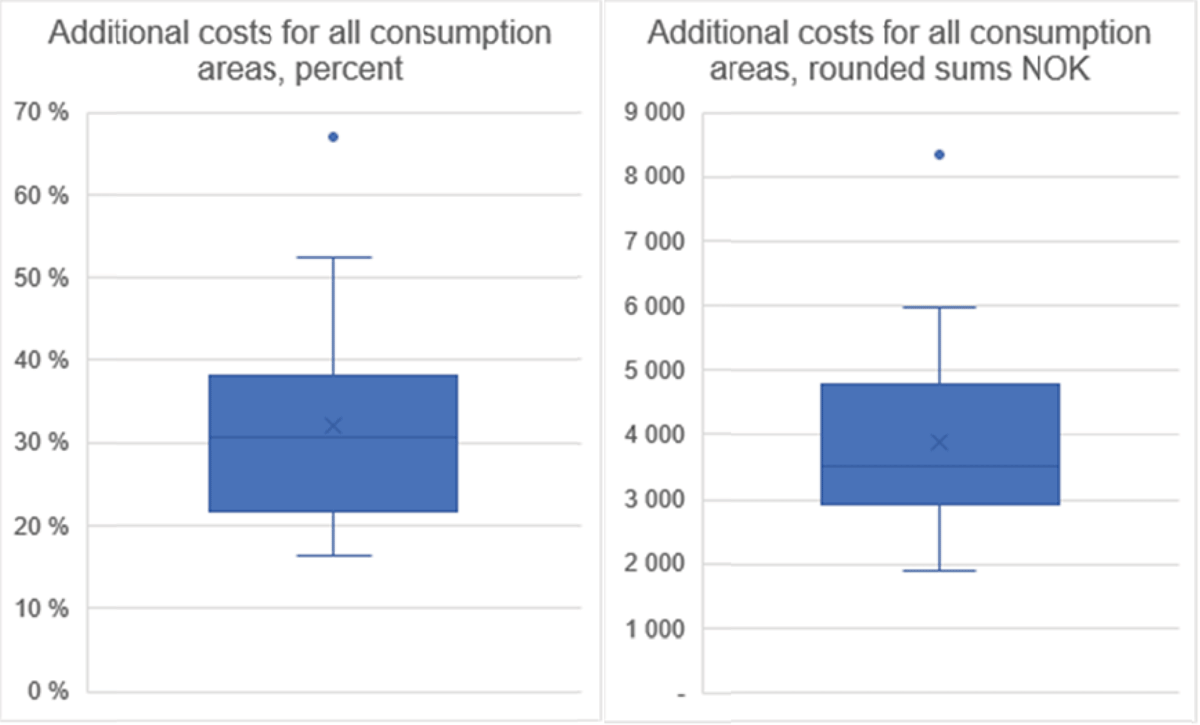
Figure 2
Monthly cost increase for all consumption areas, rounded sums, and percent.
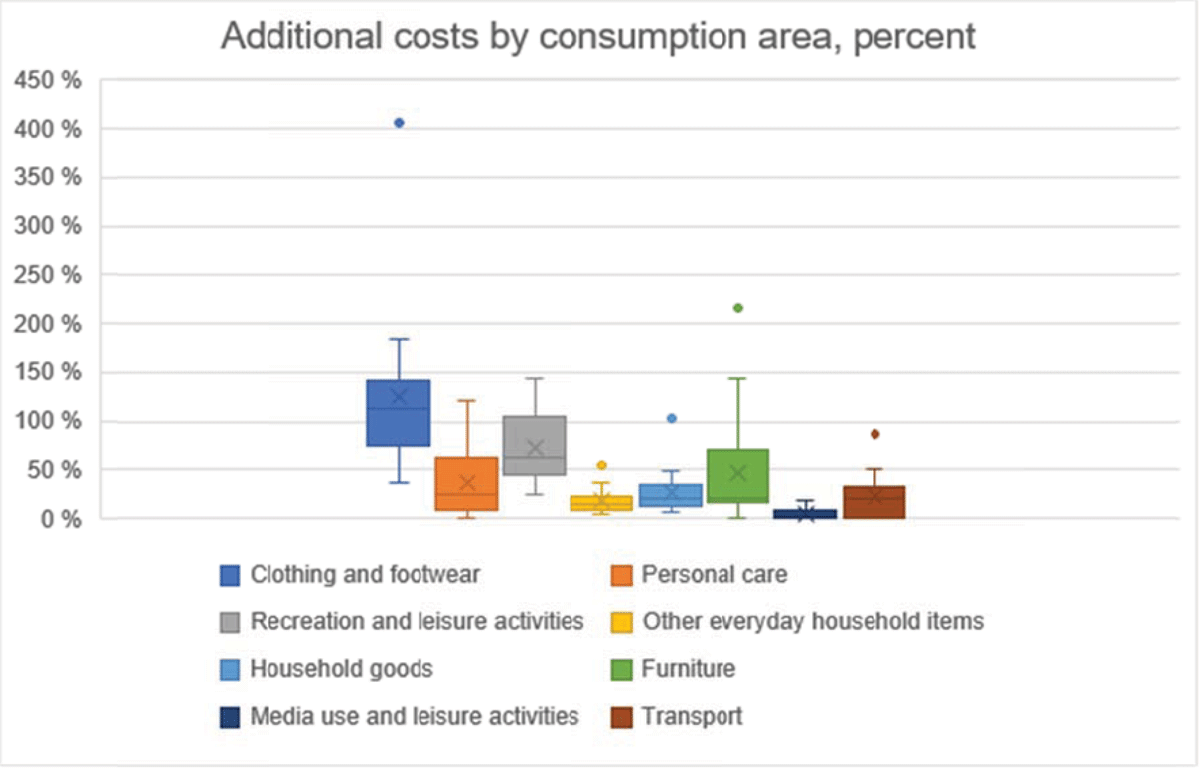
Figure 3
Cost increase per consumption area, percent.
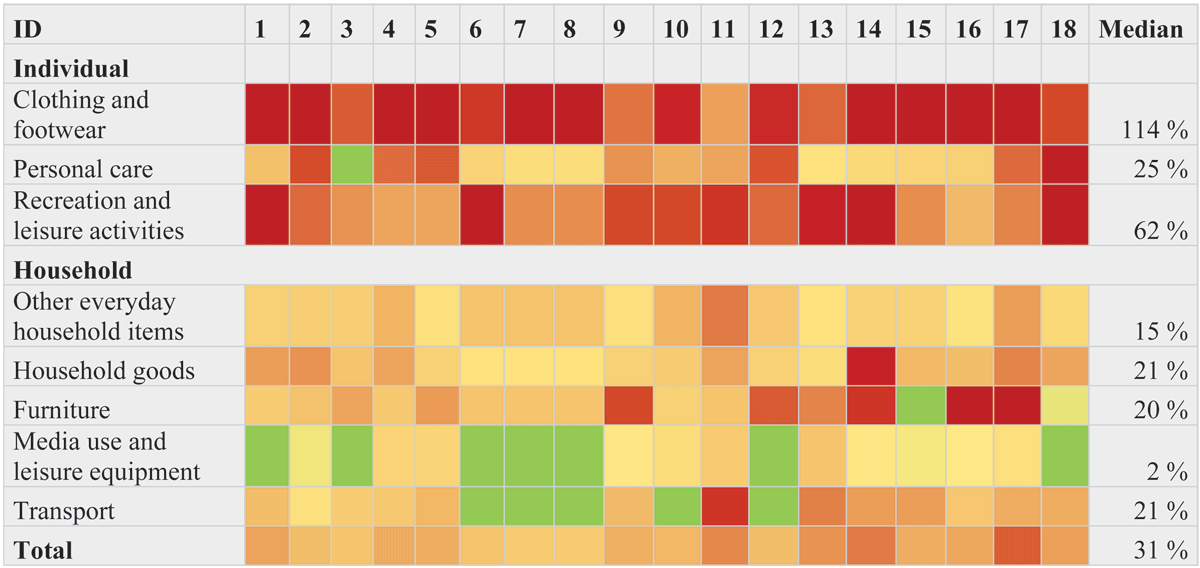
Table 1
Incremental costs per consumption area and per informant. Three-color scale mapping based on the percentage cost increase compared to the reference budget. Green indicates no cost increase, yellow indicates a cost increase within the sample’s 10th percentile, and dark red highlights the cost increases within the 90th percentile.