
Introduction
Attention-deficit/hyperactivity disorder (ADHD), affecting 3–5% of Norwegian children, is the most common childhood psychiatric disorder and often leads to educational difficulties, problems with low self-esteem, impaired family and peer relationships, and decreased quality of life (Doshi et al. 2012; Helsenorge 2023; Sayal et al. 2018). Furthermore, according to Pelham et al. (2020), the financial prognosis of those diagnosed with ADHD during childhood is poor. A number of studies have demonstrated that there are significant economic costs associated with the diagnosis at both societal and individual levels, both in Europe (Le et al. 2014) and globally (Chhibber et al. 2021; Doshi et al. 2012; Matza et al. 2005; Zhao et al. 2019). However, most of these studies focus on healthcare costs, income and productivity losses, educational costs, and justice system costs (Chhibber et al. 2021; Doshi et al. 2012; Gupte-Singh et al. 2017; Pelham et al. 2007; Schein et al. 2022; Shen et al. 2023; Telford et al. 2013). Few studies have investigated the everyday costs incurred by families caring for children with ADHD.
As the symptoms of ADHD are inattentiveness, hyperactivity, and impulsiveness, children with ADHD may be more likely than others to lose, forget, wear out, or break things (Cook 2005), and they are at increased risk of accidents and injuries (Brunkhorst-Kanaan et al. 2021). ADHD is also associated with problems in peer relations (Bagwell et al. 2001; Blachman and Hinshaw 2002; Hoza et al. 2005), which may result in different or increased needs for social support. Additionally, families with children diagnosed with ADHD are more likely than others to have problems organizing their everyday lives and tend to have higher levels of family conflict and parental stress (Corcoran et al. 2017; Kvist et al. 2013; Moen et al. 2016; Schroeder and Kelley 2009). These factors may result in increased needs for goods and services at the household level. Moreover, caring for children with ADHD has been found to decrease parental socioeconomic status (Kvist et al. 2013), making families caring for them more vulnerable to increased out-of-pocket costs and worse health outcomes (Thompson et al. 2019).
Although direct out-of-pocket costs often represent a smaller share of the total disability costs compared to indirect and societal costs (Mitra et al. 2013; Zhao et al. 2019), they directly affect the individual’s chances of social inclusion (Mitra et al. 2017). This may especially be the case for families with low socioeconomic status (Vinck 2022). Furthermore, out-of-pocket costs associated with disability are rarely captured by conventional poverty measures, such as the World Bank’s International Poverty Line and the range of various minimum income schemes (Deeming 2020). Many such indicators presume that individuals with and without disabilities have similar consumption needs (Mitra et al. 2013; Sen 2009). Thus, a comprehensive understanding of the direct out-of-pocket costs of caring for children with ADHD is important to inform, plan, and justify targeted policies and interventions aimed at alleviating the negative economic consequences associated with the disorder.
This study aims to investigate a broad spectrum of the potential increased daily household costs incurred by parents and caregivers raising a child with ADHD in Norway. The Norwegian state provides comparatively generous cash and care benefits for families raising children with a disability,1 making it a less likely case for finding increased costs.
Previous Research – Measuring Costs Associated with ADHD
The economic burden of ADHD has received relatively limited scientific attention compared to other impacts associated with the diagnosis (Chhibber et al. 2021). In their systematic review of the global economic burden of ADHD, Chhibber et al. (2021, 406) identified 44 studies: 84% of the studies examined direct medical costs, 45% accounted for indirect costs such as absenteeism, 16% considered educational system costs, and 11% dwelled on justice system costs. Only three of the studies (9%) investigated the ‘direct non-medical costs of ADHD’.
The household costs covered by these and other pertinent studies we identified included transportation expenses (Hong et al. 2020; Quintero et al. 2018), weekend and after-school care (van der Kolk et al. 2015),2 special diets (van der Kolk et al. 2015), healthcare (Daley et al. 2015; De Ridder and De Graeve 2006; Swensen et al. 2003; Zhao et al. 2019), academic support (De Ridder and De Graeve 2006; van der Kolk et al. 2015; Zhao et al. 2019), legal involvement and being victims of crimes (Daley et al. 2015; De Ridder and De Graeve 2006; Swensen et al. 2003; Zhao et al. 2019), and losses from misplaced belongings, missed activities, and property damage (Zhao et al. 2019).
Most existing studies are expenditure-based, relying on survey data from parents or caregivers. Such studies are prone to issues such as recall bias (Crossley and Winter 2015) and the inability to account for unmet needs (Mitra et al. 2017). Additionally, they do not measure the extent of other incurred costs, such as those tied to financial constraint coping strategies, like repairing broken items, frequent searches for the cheapest products or ‘good buys’, etc. However, these studies do have the advantage of covering a relatively large number of respondents across different study populations.
An alternative method used to study the additional costs of various types of disabilities draws on the budget standards approach. This approach focuses on the goods and services required rather than on the goods and services used. Hence, additional costs are determined by identifying needs specifically related to a disability or impairment and measuring these needs against a reference budget for households without any members with disability. Studies using this approach included a wide array of household costs such as daily activities, food, clothing, transport, furnishing, household goods, health and well-being, housing, information and technology, occupation, and social activities (Hirsch and Hill 2016; Smith et al. 2004; Wilkinson-Meyers et al. 2010; Wilkinson-Meyers et al. 2015). This qualitative approach allows for an emphasis on potential social barriers alongside the potential need for additional equipment. However, this approach has not yet been applied to study the potential additional costs of ADHD in Norway.
The literature on the costs of childhood ADHD remains limited, particularly in terms of expenses borne by households (Chhibber et al. 2021; Kularatna et al. 2022; Le et al. 2014). Extant studies from other contexts address important aspects of the households’ economic challenges but rarely examine the total economic burden on households. In this study, using qualitative data from multiple sources, we identify and present cost estimates for a broader range of costs and unmet needs. In doing so, we account for a broader range of household costs than those covered in previous studies. Mitra et al. (2017) call for qualitative research on unmet needs and the impact of additional expenses, a gap this study addresses.
Analytical Framework
We combine the capability approach with the budget standard approach to explore potential costs. The capability approach focuses on what people are able to do and be, rather than on opulence or utility, with individual advantage assessed based on a person’s ‘capability to do things he or she has reason to value’ (Sen 2009, 231). At the individual level, people may have different needs for resources if they are to reach the same level of capability to function, and they may have differing abilities to convert resources into actual functioning (Nussbaum 2006; Sen 1992). Deprivation of capability may result from the impairment itself, but it may also be the result of barriers in the environment or of the economic constraints that an impairment may place on the availability of, costs of, or demand for resources (Mitra 2006, 241). Hence, the economic costs of ADHD can be defined as the economic costs associated with achieving the same capability set, or functionings, as a person without ADHD. The focus is thus not placed only on the impairment itself but considers the combination of this with other personal, social, and environmental factors. The potentially increased economic costs of impairments may come because of either an increased need for resources (goods, services, time) or the need for different types of resources to achieve the same standard of living. By directing the analytical focus towards the person’s needs and interests, more than their actions or behaviors, this approach incorporates a focus on both met and unmet needs (Mitra 2006).
This emphasis on needs and how they may necessitate different satisfiers based on personal circumstances and context aligns with the budget standard approach, which has been thoroughly validated as a methodology for measuring the cost of living (Deeming 2020). This is an ‘intuitive methodology…[that]…provides an explicit framework for selecting personal requirements needed or deemed necessary to maintain a particular predefined standard of living’ (Deeming 2005, 620). Reference budgets are calculated based on the required goods and services and their associated costs (Fisher 2007).
In this study, we use an existing reference budget as the baseline to calculate the costs of ADHD. This reference budget, measuring an ‘acceptable’ standard of living in Norway, is developed following an expert-led approach rooted in the capability approach and theories of human need and dignity and utilizes mixed methods (Austgulen 2022; Austgulen and Borgeraas 2020). However, our approach to investigating ADHD-related needs differs from previous disability cost studies using the budget standard approach (Hirsch and Hill 2016; Smith et al. 2004; Wilkinson-Meyers et al. 2010; Wilkinson-Meyers et al. 2015). Instead of constructing fictive ‘model cases’ and asking experts or representatives of the public to derive their needs in focus groups, we interviewed families with children with ADHD about their circumstances and actual everyday costs. This method allows us to gain a better understanding of these families’ daily lives, enhancing our ability to capture their challenges and the resulting necessity for goods and services. By interviewing several families, this approach acknowledges that it is not possible to identify or stylize one singular scenario that encapsulates the myriad of consequences of having ADHD (Marschall 2023). ADHD has a spectrum of symptoms, and the severity of these symptoms differs for each person. It is likely that children with higher severity have higher additional costs than children with milder ADHD, but it is also possible that different types of symptoms are associated with different types of additional costs.
A key strength of our approach is that it provides a tangible account of the costs and how they can fluctuate based on the nature and severity of impairments. The approach also allows for substantial input from disabled community members. By making our assumptions explicit, existing reference budgets provide a solid baseline for these kinds of supplementary calculations. Additionally, by using an existing, thoroughly validated reference budget as the baseline and tool for estimating the additional costs, rather than asking people about their expenditures or about how satisfied they are, this approach can account for unmet needs and adaptive preferences. Nevertheless, the structure and design of the reference budgets can limit the scope of potential supplementary calculations. Therefore, in this study, we estimate additional costs for a range of consumption areas covered by the Norwegian reference budget (Consumption Research Norway 2024).
Data collection
We rely on data from several sources, including expert interviews, interviews with parents of children with ADHD, an existing reference budget, and prices of goods and services. The data collection was iterative, and the process is illustrated in Figure 1.

Figure 1
The methodology presented in a series of four phases.
In the initial phase, we sought to gather expert insights on potential household and personal costs related to ADHD and identify key cost drivers. This was achieved through a review of extant literature and focus group interviews with experts. We conducted two focus groups with a total of seven experts on childhood ADHD in November 2021.3 Insights from the literature and experts informed the design of the interview guides and home assignment for phase two. Furthermore, the experts validated the research design and the appropriateness of the Norwegian reference budget as the baseline for cost calculations.
In phase two, we conducted two rounds of semi-structured digital in-depth interviews with caregivers from 15 families, supplemented by a home assignment, between April and October 2022. The families were recruited through a combination of social media outreach and broadcasting on the national ADHD association’s channels. The interviews aimed to identify both the met and unmet needs of households with a child with ADHD and to identify material and immaterial costs and consequences. The first interview round was exploratory, focusing on the families’ situation, their thoughts on social inclusion, material and immaterial needs, and consequences for employment and social benefit uptake. After the first interview, the informants received a home assignment consisting of a booklet summarizing the content of the Norwegian reference budget. They were asked to reflect on potential diverging and/or additional resource needs. The booklet served two primary purposes. Firstly, it presented the details of the reference budget, enabling a well-informed discussion about whether this sum could be used as a baseline for calculations of additional costs. Secondly, it functioned as a ‘recall aid’, helping informants remember and reflect upon the need for goods and services that are often taken for granted, or at least not thoroughly reflected upon, often termed ‘ordinary consumption’ (Gronow & Warde 2001). The second interview round used the booklet to structure the discussion based on their needs related to a concrete set of cost areas. The interviews were transcribed verbatim and were thematically coded based on the cost categories and cost drivers using NVivo (Braun and Clarke 2006).
The sample consisted of fifteen families, raising a total of eighteen children with ADHD. The average age of the children was eleven years old. Thirteen of the children were boys and five were girls. Ten of the children had been diagnosed with comorbidities,4 and twelve used ADHD medication. The families lived in households of two to five members, with household income ranging from approximately 350,000 NOK per year (single-parent household) to approximately 1,650,000 NOK (two-parent household) per year. They resided across Norway in seven different counties, covering both urban and rural areas. We asked the caretakers to describe their child’s ADHD diagnosis, but we have not seen their medical records and are therefore cautious about drawing conclusions regarding the severity of the children’s ADHD diagnoses. Annex 1 provides details about the children, including caretakers’ descriptions of their diagnoses and information on basic and assistance allowance recipiency.
This sample is relatively small and cannot be considered representative of the population of children with ADHD in Norway. Therefore, we cannot conclude about the relationships between factors such as severity and additional costs, but the data and analysis provide insight into a range of situations that families with children with ADHD may encounter.
In phase three, we developed budgets for each of the children in the sample by adjusting the extant Norwegian reference budgets for their household constellation to accommodate their needs related to the child’s ADHD diagnosis. This was done by adjusting the amounts and expected use period for relevant products, as well as adding and removing products according to the informants’ reported needs. In cases where unfulfilled needs were reported, e.g., due to limited economic resources, the adjustments were made according to the reported needs. Similarly, when informants suggested they would bear the incremental costs in non-monetary ways, we adjusted individual budgets according to the stated need. For example, when a family chose not to replace worn-out furniture, expecting new furniture to wear out just as quickly, we adjusted the expected use period in line with the family’s reports on how long it would take the furniture to be worn out. An important advantage is that calculating costs based on needs rather than actual expenses helps to neutralize the effect of socioeconomic differences in cost calculations. Due to time restrictions in the interviews, not all products were discussed equally thoroughly, and for many ‘small’ products, informants sometimes struggled to quantify their needs. In these cases, we made qualitative judgments to adjust the amounts or durability relative to the baseline budget. An example of this situation is that when a family reports that they need ‘a lot of’ Band-Aids because the child often hurts him-/herself, we would increase the number of Band-Aids from one to two packages for the household per year.
In the final phase, we gathered the prices for the products and services added to the reference budgets and adjusted previously collected prices for the products and services in the Norwegian reference budget for inflation. We present the results based on prices from December 2023.
The project received approval from the Norwegian Centre for Research Data, which reviewed the initial interview guides, information letter, and consent form. Informed consent to record, transcribe, analyze, and publish anonymized statements was obtained from all interviewees before conducting the interviews. All interviewees were given pseudonyms.
Results
All interviewed families reported additional needs leading to increased total costs. As we will explore, the situation of the families varied, as did their need to adjust the consumption of goods and services within the various consumption areas. There could be a need for more goods and services, or more frequent use of them, or a need to adjust the selection of goods and services for the child with ADHD.
Additional costs
Figure 2 illustrates the increase in total costs across all consumption areas studied, presented both in absolute NOK figures and as a percentage increase relative to the reference budget. The median cost increase was 3500 NOK (€306) per month, equating to a 31% increase in average monthly costs compared to the Norwegian reference budget. These cost estimates account for unmet needs. Furthermore, there are substantial differences in cost increases among the families, ranging from an approximate 16% to an approximate 67% increase in monthly costs.
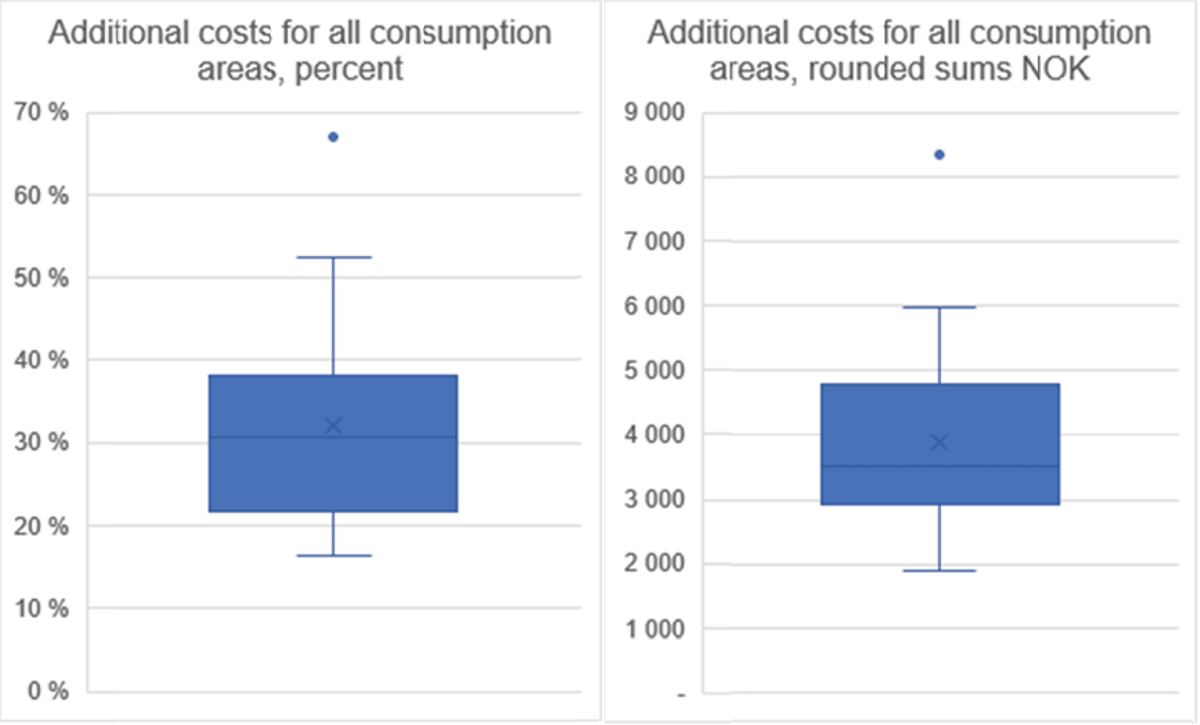
Figure 2
Monthly cost increase for all consumption areas, rounded sums, and percent.
Figure 3 illustrates the variation in cost increase across the included consumption areas. Most families experience increased needs within all consumption areas, though the extent varies. Cost increases are highest within individual-specific consumption areas, with a 62% median cost increase, compared to 20% for the household-specific consumption areas.
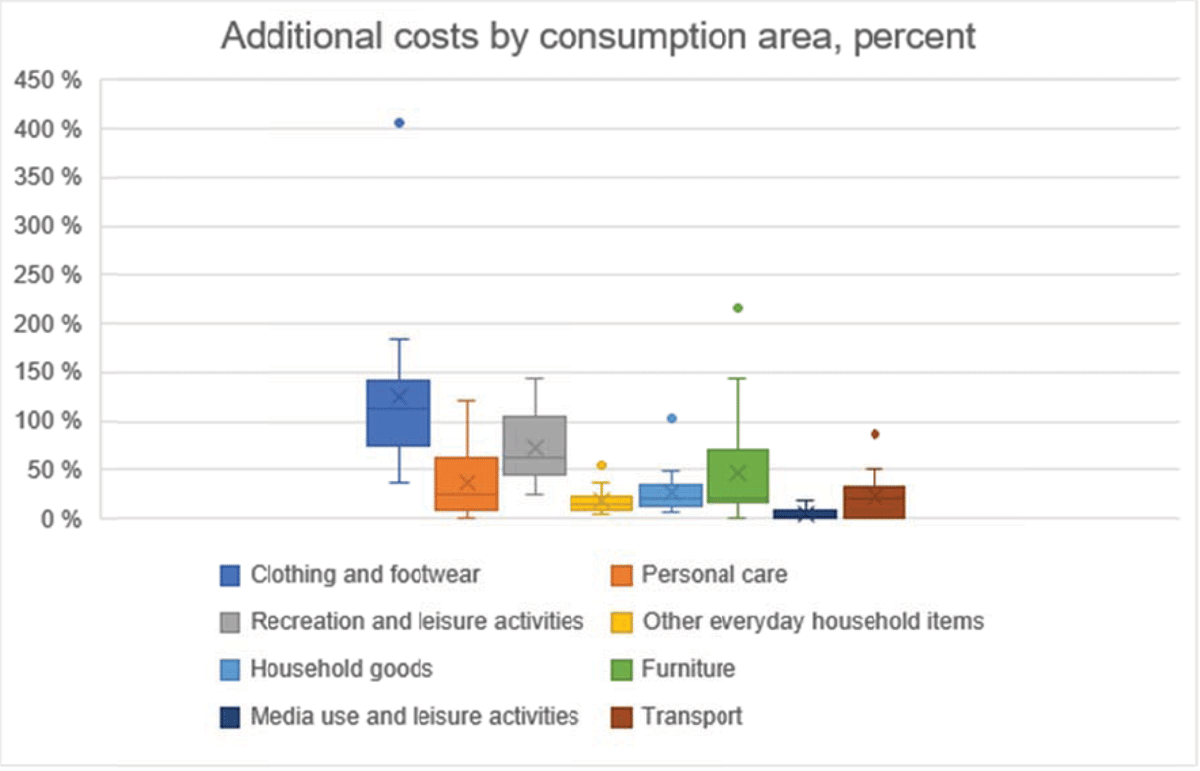
Figure 3
Cost increase per consumption area, percent.
Cost drivers
Through the qualitative analyses of the interviews, we have identified five distinct cost drivers: wear and tear, loss and misplacement, damage, bad buys, and different and/or additional needs. The extent and impact of these cost drivers are associated with the children’s ADHD symptoms, their severity, and the specific cost areas.
Wear and tear
Wear and tear emerged as an important driver of additional costs across most consumption areas, linked to the children’s high activity level, careless use, lack of impulse control, self-soothing behaviors, and an increased need for cleaning due to spillage and soiling.
The children’s high activity level often led to significant wear and tear on shoes and clothing. As Mary (ID-16), the mother of a 10-year-old boy, explained, outerwear was damaged especially quickly. ‘Both the zippers and Velcro, but also when it gets a tear. It’s not just that you get a small tear; it tears so big and long that you must replace the jacket’. Many parents emphasized that a small tear, a tiny hole, or a thread sticking up from a garment would often result in greater damage to the clothing, as the child would pull at it and fiddle with it. Another cause of wear and tear in clothing was self-soothing activities, such as chewing on sweaters. The practices of fiddling and self-soothing could also lead to increased wear and tear of other goods (furniture, bedding, towels, toys, electronic equipment, and car interiors).
Another driver of wear and tear highlighted by parents was careless use, stemming from inattentiveness and lack of impulse control, of everything from clothes to the family’s furniture. Greta (ID-9), the mother of a 9-year-old girl, explained how this played out in their situation:
We can never have new furniture and such things because there are no barriers to anything. So, sitting down and leaving an ice cream or a glass of soda on the sofa, nothing in her head says it’s not okay … I can never buy new, nice things. We’ve just laid a new floor, and we couldn’t have parquet, because we knew that in three weeks, she’ll be roller skating indoors, right? Because there’s no impulse control, and we can’t always prevent it.
For many families, the children’s careless use of leisure equipment (bicycles, gaming consoles, phones, and tablets) was also an important driver of additional costs. Many parents reported purchasing commercial guarantees for products where this option was available (phones, televisions, and tablets) due to frequent damage or breakage.
Many families also pointed to an increased need to wash clothes and clean the house as a source of additional expenses. Frequent laundry contributes to the wear and tear of clothing, bedding, pillows, duvets, and other household textiles, as well as washing machines and dryers. The increased need for cleaning also relates to additional costs for detergents and electricity. The reasons for the increased need to wash clothes included spilling while eating or playing, encopresis and enuresis, and an increased need among some of the children to feel clean.
Loss and misplacement
Inattentiveness was often reported as a cause of loss and misplacement of different types of goods. This was especially relevant for individual-specific items such as clothing and leisure equipment like bicycles. In addition to being time-consuming to handle, this was a monetary cost driver for many of the families interviewed.
Outerwear was particularly prone to being lost or forgotten. As explained by Naomi and Nils (ID-17), parents of an 11-year-old boy, these are garments that are often taken off and put on throughout the day, which makes them easy to forget. ‘Because he is warm-blooded, he tends to undress and walk around in a t-shirt, and then his sweater is left outside. It gets lost’. Anna (ID-1), the mother of a 9-year-old girl, elaborates, ‘I think I have bought 100 pairs of mittens this year. She leaves them everywhere. The same with headbands, beanies, and everything really, including jackets’. Gym clothes and indoor shoes were also particularly prone to disappearing or being left behind.
In Beata’s situation (ID-2), the mother of an 11-year-old boy, her son’s inattentiveness would also result in him forgetting to lock his bicycle and misplacing his helmet. ‘He forgets things, and sometimes he forgets to lock his bike. So, it has sometimes simply disappeared … last year his scooter was stolen from the house because he hadn’t locked it’. Many parents described recreational equipment (thermoses and headlamps), as well as stationary items, as consumables that often need to be replaced due to misplacement.
Damage and destructive behaviour
For many of the parents, things getting destroyed was a significant source of extra costs. They shared how a high activity level combined with inattentiveness and curiosity would result in experimentation that could become costly. Things could also be destroyed due to self-soothing and emotional regulation.
When discussing personal care, many parents shared how their children would use excessive amounts of soap and shampoo if they were left with it unattended. This was explained by pointing to their curiosity and creativity. In the words of Anna (ID-1), the mother of a 9-year-old girl, ‘If she stays in the shower too long, she’ll have used up all the shampoo, because she’s been playing with it, and thought it was very fun’.
Some parents reported more costly consequences of their children’s experimentation. Clara (ID-3), the mother of a 16-year-old boy, listed several things her son had done over the years. ‘[He’s a] very creative type, who has tested out all sorts of things. For example, spray paint on the house, nails in the stairs, whittling all the window frames, and glue on the kitchen floor. I mean, you never know’. Hanne (ID-10), the mother of a 13-year-old boy, told how clothes and shoes were destroyed because of curiosity and experimentation. ‘He sits there and sticks the scissors into the shoe at the heel, into the shoe itself, and he takes a pencil and pokes it through. Everything must be tested. Like “I just wanted to see if it would work”’. Naomi (ID-17), the mother of an 11-year-old boy, also describes how curiosity, in combination with lack of impulse control, in their case resulted in, amongst other things, a damaged television. ‘Well, it still works, but it is scratched. He tried to scratch like a dog on the TV to see if it made marks. It did’. For Lillian (ID-14), mother of a 9-year-old boy and an 11-year-old girl, her son’s experimentation had resulted in a sofa cut open with a knife.
This kind of destructive behavior could also be a result of self-soothing. Several parents reported an increased need to replace products such as headsets because they were chewed or pulled apart. A final cause of destructive behavior was anger outbursts and problems with emotional regulation. Anna (ID-1), mother of a 9-year-old girl, described some of the incidents at their home. ‘She punched holes in the doors here when she was very angry, she has ruined our sliding door wardrobe, she broke both wheels. [She] throws things, breaks things… The car is full of scratches; she has thrown stones at it. She loses it a bit’. In Mary’s situation (ID-16), mother of a 10-year-old boy, anger outburst also led to damaged clothing. ‘There is a lot of wear and tear on both the child’s clothes and mine. Because, when he gets angry, he tears my clothes [to ruin] … he bites and tears clothes, both his own and mine’.
Bad buys
For many of the families we interviewed, ‘bad buys’, meaning that parents bought products that the children would not use, were an important driver of additional costs. This cost driver was most relevant for clothing and food. This practice was, in most cases, explained by the children’s sensory issues, often in combination with the difficulties the parents experienced in bringing their children along when shopping. In the cases of shoes and clothing, many children had very clear preferences regarding which clothes they could wear to reduce discomfort, and the parents reported that it could be challenging to purchase the ‘right’ clothes and shoes that would accommodate these needs. Joanna (ID-12), the mother of a 15-year-old boy, describes how this played out in their family. ‘When I find clothes he likes, I buy a lot of them to be sure. But then suddenly they change the texture of the clothes … and then he won’t wear them anymore’.
In some cases, the shoes and clothing could be returned to the store, but this was often not the case. This could be because the discomfort was only discovered after the garment had been worn, and often after annoying labels and the like had been removed.
Different and/or additional needs
The final driver of ADHD-related additional costs is the need for different and/or additional products or services. This was relevant across all cost categories, ranging from the need for inexpensive products such as pencil grips, ointments, and wound care products to more expensive purchases such as additional or adapted leisure activities and products that facilitate better sleep, such as weighted duvets.
Several of the parents we interviewed highlighted additional costs linked to the child starting many leisure activities. It could be because it could be challenging to find something they enjoyed, as well as restlessness and impulsiveness. Clara (ID-3), the mother of a 16-year-old boy, elaborates, ‘So you could say that he isn’t a boy who starts playing football and continues until he’s 20 years old… He starts and quits many things. It does require some follow-up and, of course, some equipment’.
The children’s high activity level also led parents to invest in toys and equipment to stimulate activity and help the child expend energy. In the words of Greta (ID-9), mother of a 9-year-old girl: ‘Everything is really about what is best for her. What do we have in the yard? Well, we hang swings everywhere, a trampoline, a punching bag, all sorts of things that help… Our house is furnished with these kinds of items so that she can be active and burn off some energy’.
On the other hand, parents also reported that their children need to be protected from sensory input and need help to relax. This could involve toys, noise-canceling headphones, equipment in line with their current interests, and access to screens. Tablets and screens in general were seen as important tools to help calm the children in stressful situations and after they had been exposed to much sensory input. Dina (ID-4), mother of a 7-year-old boy, explains, ‘We need to have a tablet for him because it’s one of the things that can calm him down if things go wrong…I know for sure that he needs it to regulate himself sometimes’.
Variation in needs and associated costs among families
Table 1 illustrates how the cost increase varies among the respondents in our sample by cost category. The color mapping is based on the percentage cost increase compared to the reference budget for each family’s consumption area. The visualization employs a three-color scale to represent the cost increase, with green indicating no cost increase, yellow representing an increase within the 10th percentile, and dark red highlighting the highest cost increase (90th percentile).
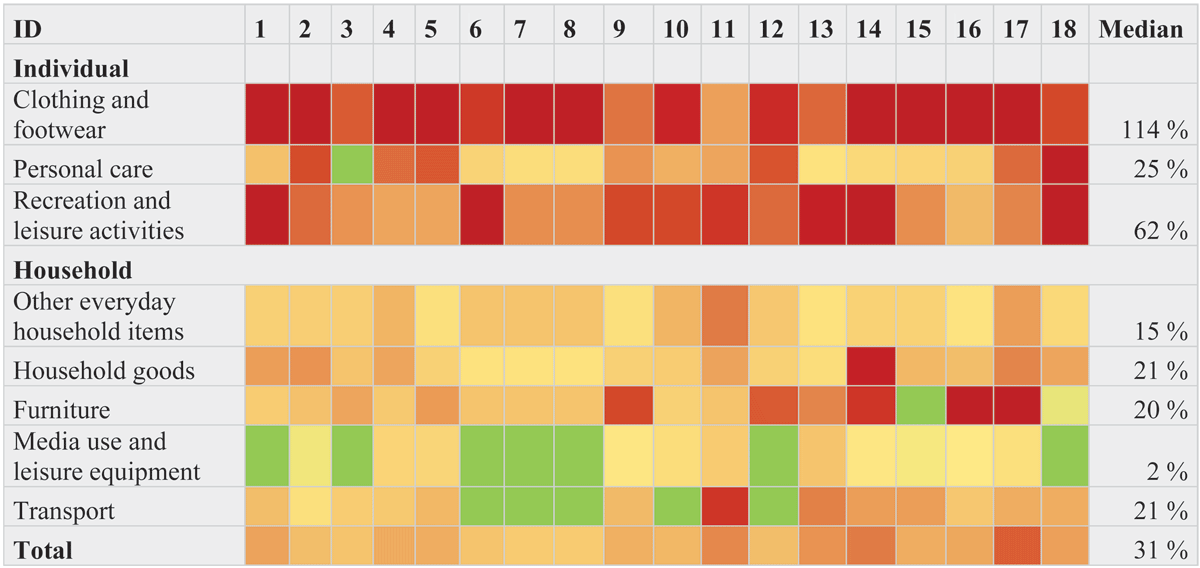
Table 1
Incremental costs per consumption area and per informant. Three-color scale mapping based on the percentage cost increase compared to the reference budget. Green indicates no cost increase, yellow indicates a cost increase within the sample’s 10th percentile, and dark red highlights the cost increases within the 90th percentile.
It indicates that all families experience substantially increased costs for clothing and footwear; however, several families do not experience additional costs related to household-specific media use, leisure equipment, and transport. More red squares generally indicate a higher self-described ADHD severity. Child ID-17, an 11-year-old boy with severe ADHD symptoms, incurs the highest costs, while children ID-7 and ID-8, who were controlling their inattentiveness, have the lowest increases. Anna describes her daughter (ID-1) as having severe ADHD due to extreme inattentiveness, yet their cost increase is average for this sample, highlighting the importance of individual symptoms over overall severity.
While certain cost categories contribute minimally to the overall average additional costs, they may represent important cost drivers for specific children. For example, ID-13, who struggles with poor impulse control and is unfocused, requires additional items to meet his needs, such as access to equipment stimulating physical activity (trampoline), as well as a TV with streaming services to help him relax and self-regulate. These needs result in a 19% increase in costs within the category media use and leisure equipment, compared to the median cost increase of 2%. For ID-11, transport expenses are one of two key drivers of the total additional costs. Since the child struggles with anxiety combined with inattentiveness, she needs to practice a lot on using public transport, and the family sometimes needs to travel by taxi.
Hence, Table 1 illustrates our finding that children with ADHD and their families face different types of challenges, which generate different types of costs across several areas. These cost calculations reflect the severity of the economic impact of the child’s symptom burden, as total additional costs appear linked to the diagnosis’s severity, with different symptoms driving specific types of costs. We find that most of the children who are experiencing the highest cost increase in the cost category furniture struggle with lack of impulse control and/or aggression. Nevertheless, symptoms like hyperactivity and inattentiveness may lead to losing items, such as clothing, or experimentation as previously described. It is important to note that situational factors such as their coping mechanisms and where and how they live are likely to impact in which areas the extra costs appear.
Discussion and Conclusion
This study introduces an innovative method for calculating the additional costs associated with ADHD, focusing on the needs of families rather than reported expenditures; hence, it captures the households’ unmet needs and their adaptive preferences. We show that all families in our sample experience substantial cost increases due to the child’s ADHD. This finding aligns with previous studies finding that childhood ADHD places a heavy burden on families, also economically (Chhibber et al. 2021; De Ridder and De Graeve 2006; Doshi et al. 2012; Mitra et al. 2017), and shows that this pattern also extends to Norway, where it hasn’t been studied previously.
The current paper aims to address two limitations in the extant literature. Firstly, this study extends beyond previous research by examining and identifying additional costs across multiple areas and demonstrating how these extra costs vary between families. We find that most families incur substantial extra costs for clothing and footwear, while only slightly more than half have additional transportation expenses. Nevertheless, transportation expenses often represent a greater overall burden for those households than the increased clothing costs. Focusing on a few cost areas can significantly underestimate both total costs and differences between families. The findings also show that ADHD symptoms and their severity led to substantial variation in the types of additional costs incurred.
Secondly, by calculating additional costs based on needs and using an established reference budget as a benchmark, we have accounted for unmet needs and the fact that not all families have the necessary financial resources to meet their needs equivalently. This is important, as caring for children with ADHD has been found to reduce parental socio-economic status (Kvist et al. 2013). The findings from our interviews indicate that many families avoid several direct extra financial costs in practice by investing considerable time and energy into searching for affordable products, repairing items, and adjusting their expectations to their economic situation. This is what Sen (1999) and Nussbaum (2000) term ‘adaptive preferences’. However, this represents a form of cost payment that is not captured by traditional expenditure-based approaches. This method of paying the costs can also be considered a form of hidden work (Wadel 1979), which comprises activities that receive little attention and recognition in society. For parents of children with disabilities, this adds to other hidden tasks, such as coordination work (Østerud and Anvik 2024), and may explain their lower levels of labor market attachment (Wondemu et al. 2022).
This comprehensive approach to assessing additional household costs is crucial for developing effective and targeted support schemes that can help break the link between childhood disability and childhood poverty, as demonstrated in previous research (Vinck 2022). In Norway, families can apply for support for additional costs associated with ADHD through the basic benefit scheme. However, considering this study›s findings, this support scheme›s design has significant weaknesses. The basic benefit scheme allows families to apply for coverage of extra expenses related to only a limited selection of goods and services. This study reveals that the families we interviewed incur additional costs across many more cost areas than those covered by the support scheme. Hence, the scope of the benefit scheme is too narrow, resulting in limited effectiveness in reducing the economic consequences of caring for a child with ADHD.
A notable difference from previous research on the household costs of ADHD (Daley et al. 2015; De Ridder and De Graeve 2006; Swensen et al. 2003; van der Kolk et al. 2015; Zhao et al. 2019) is that we do not focus on additional costs of healthcare, academic support/schooling, and legal involvement identified in this study. This is because these costs are largely covered by the state, as Norway is characterized as a relatively generous welfare state. Nevertheless, some costs may also not have been captured due to the relatively small study sample, which limits the generalizability of the findings. Another limitation of this approach is that it is time- and resource-consuming and depends on the existence of an established reference budget to be used as a baseline for calculations (Mitra et al. 2017). Despite its focus on the often-overlooked costs to families, the approach used in this study is not immune to the challenges of collecting data on such expenses. People remember and focus on different types of costs, and many costs are likely to be underreported because it is difficult to pinpoint them. This is challenging both because it is hard to determine what is ‘normal’ and because mundane costs are part of ‘ordinary consumption’, which is not often reflected upon (Gronow and Warde 2001).
Future research should therefore seek to further develop and verify the methodology used in this study. There is great variation in the methods used to measure the direct costs of disability (Mitra et al. 2017), and the literature that estimates the direct costs to families associated with childhood disability presents a wide range (Stabile and Allin 2012). Future research should compare different approaches to measuring direct household costs to help develop a more standardized cost-of-illness methodology. Regarding ADHD, the results of this study suggest a need for research on families’ coping strategies and the consequences of increased costs. Furthermore, future studies should focus on how negative consequences can be alleviated through public policy and public support schemes.
Notes
[1] The state covers healthcare and dental costs for children under 18 years. Children with disability have free access to specialized schools and differentiated instruction.
[2] Hong et al. (2020) also captures what they call ‘caregiver costs’, but these calculations are based on the lost income associated with hospitalization days and outpatient visits, which we consider as indirect costs.
[3] The experts had professional backgrounds from the Professional Centre for NAV (Norwegian Labour and Welfare Administration) Aids and Facilitation, the Educational Psychology Service, school management, a regional competence service for autism, ADHD, and Tourette’s syndrome, and experience from working as a child and youth physiotherapist, professional advisor in ADHD Norway, and a user representative for ADHD Norway.
Acknowledgements
The authors would like to acknowledge the parents who volunteered to be interviewed, as well as ADHD Norway for their assistance in recruiting participants. We also extend our gratitude to colleagues and the two anonymous reviewers for their valuable feedback on earlier versions of this article.
Competing Interests
The authors have no competing interests to declare.