
Table 1
Basic information for Austrian households without a disabled member (N = 3,437) and households with at least one disabled member (N = 2,501).
| NOT DISABLED | DISABLED | DIFF. | SIG. | |
|---|---|---|---|---|
| Share of households | 57.88% | 42.12% | 15.76 p.p. | |
| At-risk-of-poverty rate | 11.65% | 16.81% | –5.16 p.p. | Chi-squared p-value < 0.001 |
| Average number of HHMs | 2.08 | 1.98 | 0.09 | t-test p-value < 0.01 |
| Average number of children (age 0 to 15) in HH | 0.41 | 0.20 | 0.21 | t-test p-value < 0.01 |
| Average age of HHMs | 46.75 | 57.90 | –11.15 | t-test p-value < 0.01 |
| Number of observations | 3,434 | 2,499 | 935 |
[i] Note: Figures based on EU-SILC 2022 data for Austria; unit of analysis: household.
Table 2
Descriptive statistics of the categorical variables to explain the poverty risk of Austrian households without a disabled member (N = 3,437) and households with at least one disabled member (N = 2,501).
| NOT DISABLED | DISABLED | DIFF. | SIG. | |
|---|---|---|---|---|
| Work intensity of HH | ||||
| Full-time/full-time (ref.) | 15.22% | 10.52% | 4.71 p.p. | Chi-squared p-value < 0.01 |
| Full-time/part-time | 15.28% | 10.00% | 5.28 p.p. | |
| Part-time/inactive | 13.85% | 30.03% | –16.17 p.p. | |
| Part-time/part-time | 11.50% | 10.28% | 1.22 p.p. | |
| Single full-time | 18.83% | 6.08% | 12.75 p.p. | |
| Single part-time | 5.47% | 2.32 % | 3.15 p.p. | |
| Single inactive | 19.85% | 30.79% | –10.94 p.p. | |
| Education of HH | ||||
| Primary education (ref.) | 29.84% | 47.74% | –17.9 p.p. | Chi-squared p-value < 0.01 |
| Secondary | 22.94% | 17.33% | 5.61 p.p. | |
| Secondary, primary | 15.66% | 19.05% | –3.39 p.p. | |
| Tertiary | 20.09% | 7.04% | 13.04 p.p. | |
| Tertiary, secondary, and/or primary | 11.47% | 8.84% | 2.63 p.p. | |
| Migration background of HH | ||||
| AUT (ref.) | 83.85 % | 81.69 % | –1.12 p.p. | Chi-squared p-value < 0.01 |
| AUT and EU/ROW | 6.98 % | 7.96 % | –0.97 p.p. | |
| EU | 6.75 % | 4.64 % | 2.11 p.p. | |
| ROW (and EU) | 5.70 % | 5.72 % | –0.02 p.p. | |
| Urban–rural | ||||
| 1 = Vienna | 23.22 % | 21.15 % | 2.07 p.p. | Chi-squared p-value < 0.01 |
| 2 = more than 100,000 inhabitants | 9.98 % | 7.88 % | 2.1 p.p. | |
| 3 = more than 10,000 inhabitants | 15.19 % | 15.67 % | –0.49 p.p. | |
| 4 = less than 10,000 inhabitants | 51.62% | 55.30% | –3.68 p.p. | |
[i] Note: Figures based on EU-SILC 2022 data for Austria; units of analysis: household.
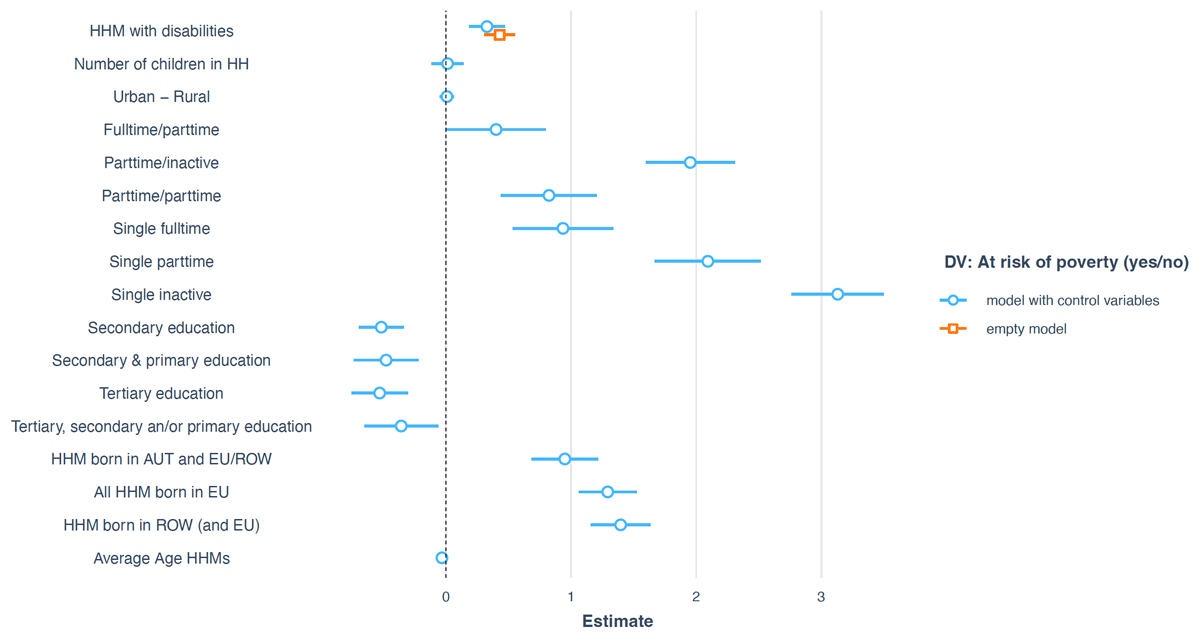
Figure 1
Visualisation of logistic regression analysis of poverty risk for Austrian households based on EU-SILC sample 2022 (for detailed coefficients see Table A.1 in the Appendix).