
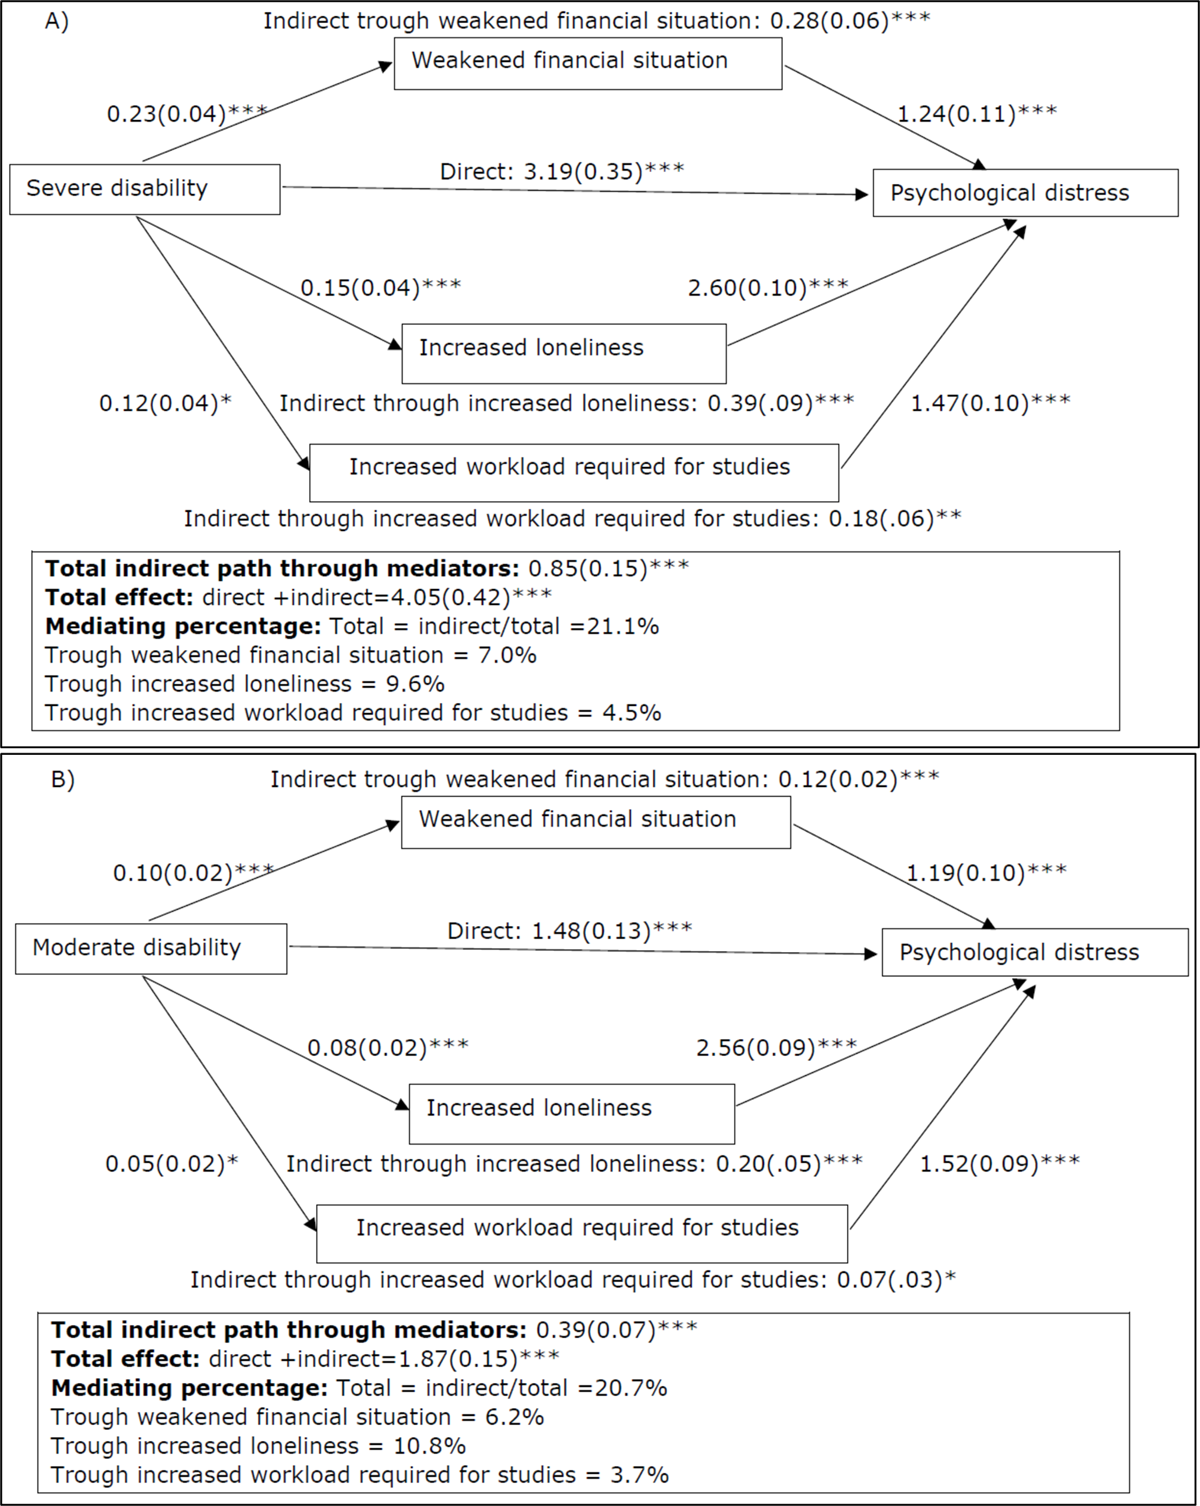
Figure 1
The analyzed mediation model, separately for severe (A) and moderate (B) disability.
Indirect pathway = association between disability and psychological distress through the mediation of weakened financial situation, increased loneliness, or increased workload required for studies. Direct pathway = association between disability and psychological distress while controlling for the mediators. Adjusted for sociodemographic covariates (sex, living alone, age group, and education sector). Unstandardized effects and standard errors (in brackets) are presented. *p < 0.05; **p < 0.01; ***p < 0.001. Meditating percentage = the proportion in which a mediator accounted for the associations between disabilities and psychological distresss.
Table 1
Sociodemographic characteristics of the study population.
| SEVERE DISABILITY n = 225 | MODERATE DISABILITY n = 1057 | WITHOUT DISABILITY n = 4896 | |
|---|---|---|---|
| Total, % [95% CI] | 3.9 [3.4, 4.5] | 17.0 [16.0, 18.0] | 79.1 [78.0, 80.1] |
| Age group, % [95% CI] | |||
| 18–22 | 25.1 [19.7, 31.4] | 26.5 [24.0, 29.3] | 34.9 [33.5, 36.3] |
| 23–26 | 40.6 [34.0, 47.5] | 38.9 [35.8, 42.1] | 40.4 [38.9, 41.8] |
| 27–34 | 34.3 [28.0, 41.2] | 34.6 [31.5, 37.8] | 24.8 [23.4, 26.1] |
| Higher education sector, % [95% CI] | |||
| University | 55.7 [48.7, 62.4] | 51.1 [47.8, 54.3] | 50.7 [49.2, 52.2] |
| University of applied sciences | 44.3 [37.6, 51.3] | 49.0 [45.8, 52.2] | 49.3 [47.8, 50.8] |
| Sex, % [95% CI] | |||
| Male | 47.5 [40.6, 54.5] | 33.5 [30.3, 36.8] | 48.7 [47.2, 50.2] |
| Female | 52.5 [45.5, 59.4] | 66.5 [63.3, 69.7] | 51.3 [49.8, 52.8] |
| Living alone, % [95% CI] | |||
| No | 46.9 [39.9, 54.1] | 55.2 [51.9, 58.4] | 58.8 [57.3, 60.3] |
| Yes | 53.1 [45.9, 60.1] | 44.8 [41.6, 48.1] | 41.2 [39.7, 42.7] |
| aPsychological distress (dichotomized) | |||
| % [95% CI] | 79.8 [74.1, 85.4] | 64.3 [61.1, 67.5] | 43.2 [41.7, 44.7] |
| OR [95% CI] | 5.36 [3.73, 7.70]*** | 2.41 [2.06, 2.81]*** | ref. |
| aPsychological distress (continuous) | |||
| M(SE) | 8.35(.28) | 6.35(.13) | 4.44(.06) |
| B(SE) | 3.90(.29)*** | 1.91(.14)*** | ref. |
| aWeakened financial situation | |||
| % [95% CI] | 57.2 [50.2, 64.3] | 45.7 [42.5, 49.0] | 36.2 [34.7, 37.6] |
| OR [95% CI] | 2.39 [1.77, 3.21]*** | 1.49 [1.29, 1.73]*** | ref. |
| aIncreased loneliness during | |||
| % [95% CI] | 73.6 [67.1, 80.0] | 68.4 [65.3, 71.6] | 61.8 [60.3, 63.3] |
| OR [95% CI] | 1.76 [1.24, 2.49]*** | 1.36 [1.15, 1.60]*** | ref. |
| aIncreased workload required for studies | |||
| % [95% CI] | 59.5 [52.4, 66.5] | 50.5 [47.2, 53.8] | 46.0 [44.5, 47.5] |
| OR [95% CI] | 1.75 [1.29, 2.38]*** | 1.20[1.04, 1.40]* | ref. |
[i] Note. aAdjusted for sociodemographic covariates (sex, living alone, age group, and education sector). OR = odds ratio; CI = confidence interval; SE = standard error.
*p < 0.05; ***p < 0.001.