
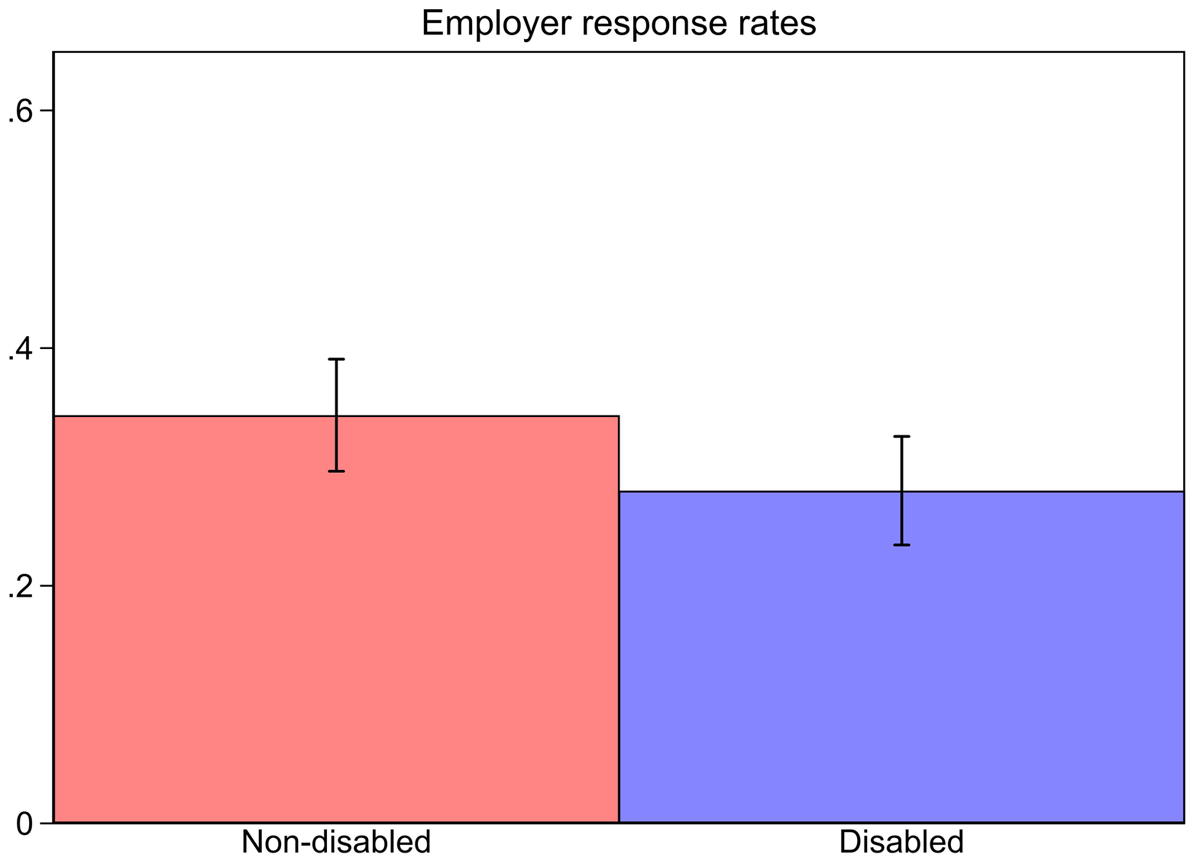
Figure 1
Positive employer response rates, two categories.
Note: Black bars represent 95% confidence intervals.
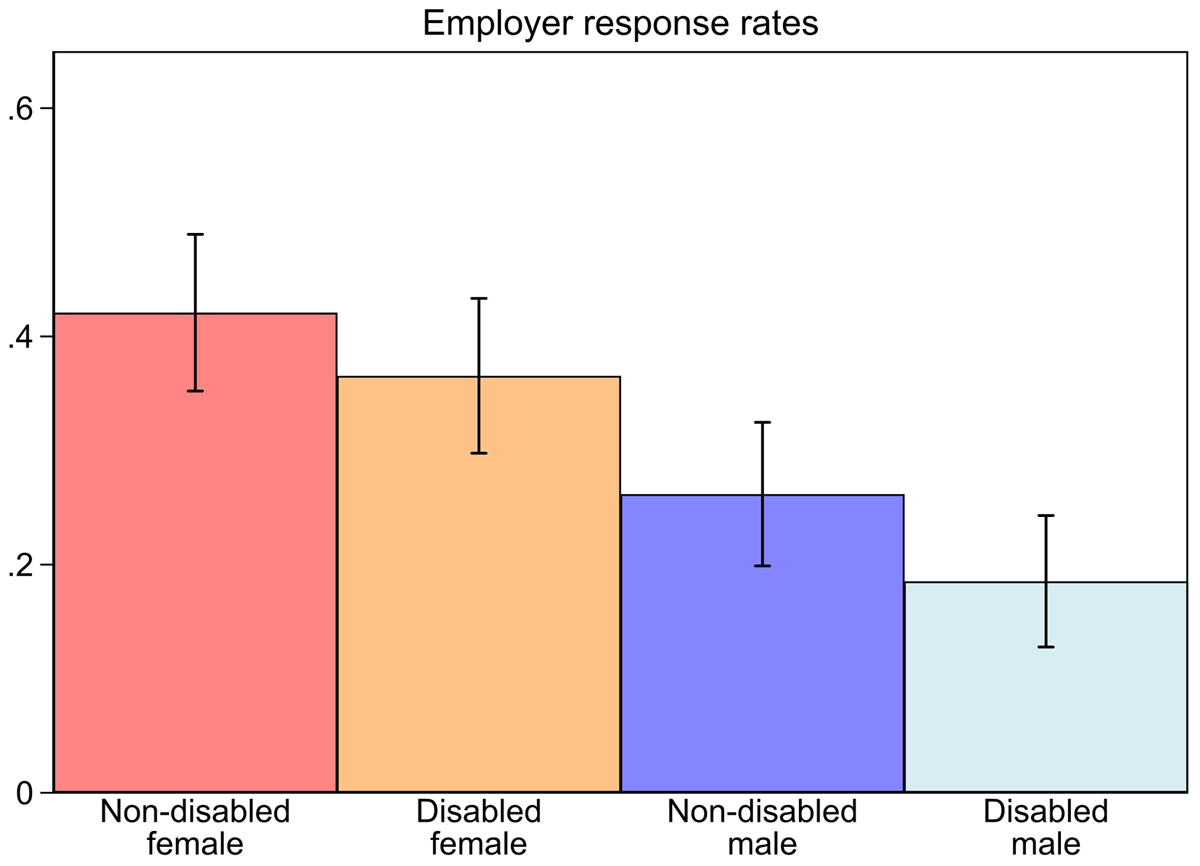
Figure 2
Positive employer response rates, four categories.
Note: Black bars represent 95 percent confidence intervals.
Table 1
LPM estimates of marginal positive employer response probabilities.
| (1) | (2) | (3) | (4) | |
|---|---|---|---|---|
| Disability | –0.064* | –0.065** | –0.065** | –0.075** |
| (0.033) | (0.033) | (0.032) | (0.036) | |
| Male | –0.169*** | –0.183*** | –0.180*** | |
| (0.033) | (0.032) | (0.036) | ||
| Urban | –0.186*** | –0.201*** | ||
| (0.033) | (0.038) | |||
| Full time | –0.087*** | –0.047 | ||
| (0.033) | (0.039) | |||
| Indefinite contract | 0.011 | 0.033 | ||
| (0.051) | (0.058) | |||
| ln(Employees) | 0.026 | |||
| (0.029) | ||||
| ln(Revenue) | –0.008 | |||
| (0.028) | ||||
| Constant | 0.344*** | 0.426*** | 0.531*** | 0.596 |
| (0.024) | (0.030) | (0.035) | (0.375) | |
| Observations | 768 | 768 | 768 | 608 |
[i] Note: Standard errors in parentheses. *, **, and ***, indicate statistical significance at the .1, .05, and .01 levels respectively.