
Table 1
Summary of study characteristics.
| Total | 122 (100%) | |
|---|---|---|
| Year of publication | 2007–2010 | 19 (16%) |
| 2011–2014 | 40 (33%) | |
| 2015–2018 | 30 (25%) | |
| 2019–2023 | 33 (27%) | |
| Peer-reviewed | Yes | 71 (58%) |
| No | 51 (42%) | |
| Topic area | Education | 41 (34%) |
| Health | 20 (16%) | |
| Impact of disability | 14 (11%) | |
| Disability awareness | 13 (11%) | |
| Family | 12 (10%) | |
| Accessibility | 8 (7%) | |
| Policy | 7 (6%) | |
| Work | 6 (5%) | |
| Justice | 1 (1%) | |
| Disability type | All disability | 57 (47%) |
| Neurological | 22 (18%) | |
| Visual | 14 (11%) | |
| Psychosocial | 13 (11%) | |
| Intellectual | 12 (10%) | |
| Physical | 9 (7%) | |
| Hearing | 8 (7%) | |
| Study design | Qualitative | 55 (45%) |
| Mixed-methods | 35 (29%) | |
| Quantitative | 31 (25%) | |
| Policy analysis | 3 (2%) | |
| Province | Lusaka | 73 (60%) |
| National | 23 (19%) | |
| Southern | 15 (12%) | |
| Copperbelt | 14 (11%) | |
| Central | 11 (9%) | |
| Western | 5 (4%) | |
| Eastern | 4 (3%) | |
| North-Western | 2 (2%) | |
| Luapula | 2 (2%) | |
| Northern | 1 (1%) | |
| Unclear | 1 (1%) |
[i] NB: Studies may be attributed to more than one category (e.g., studies conducted in multiple locations) and the total of some variables is therefore greater than the total of included studies (n = 122).
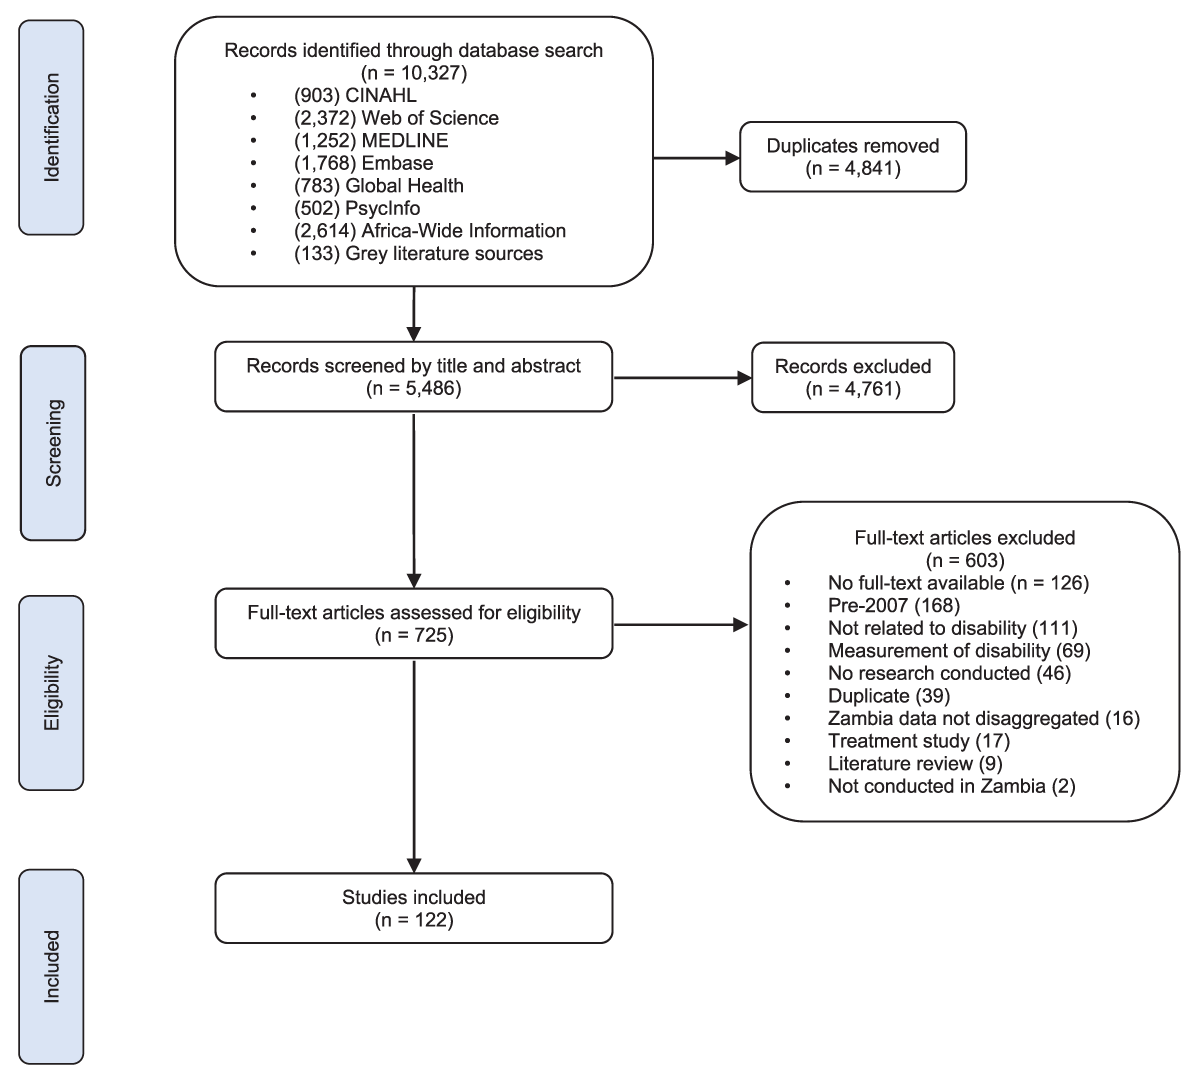
Figure 1
PRISMA flow diagram.