
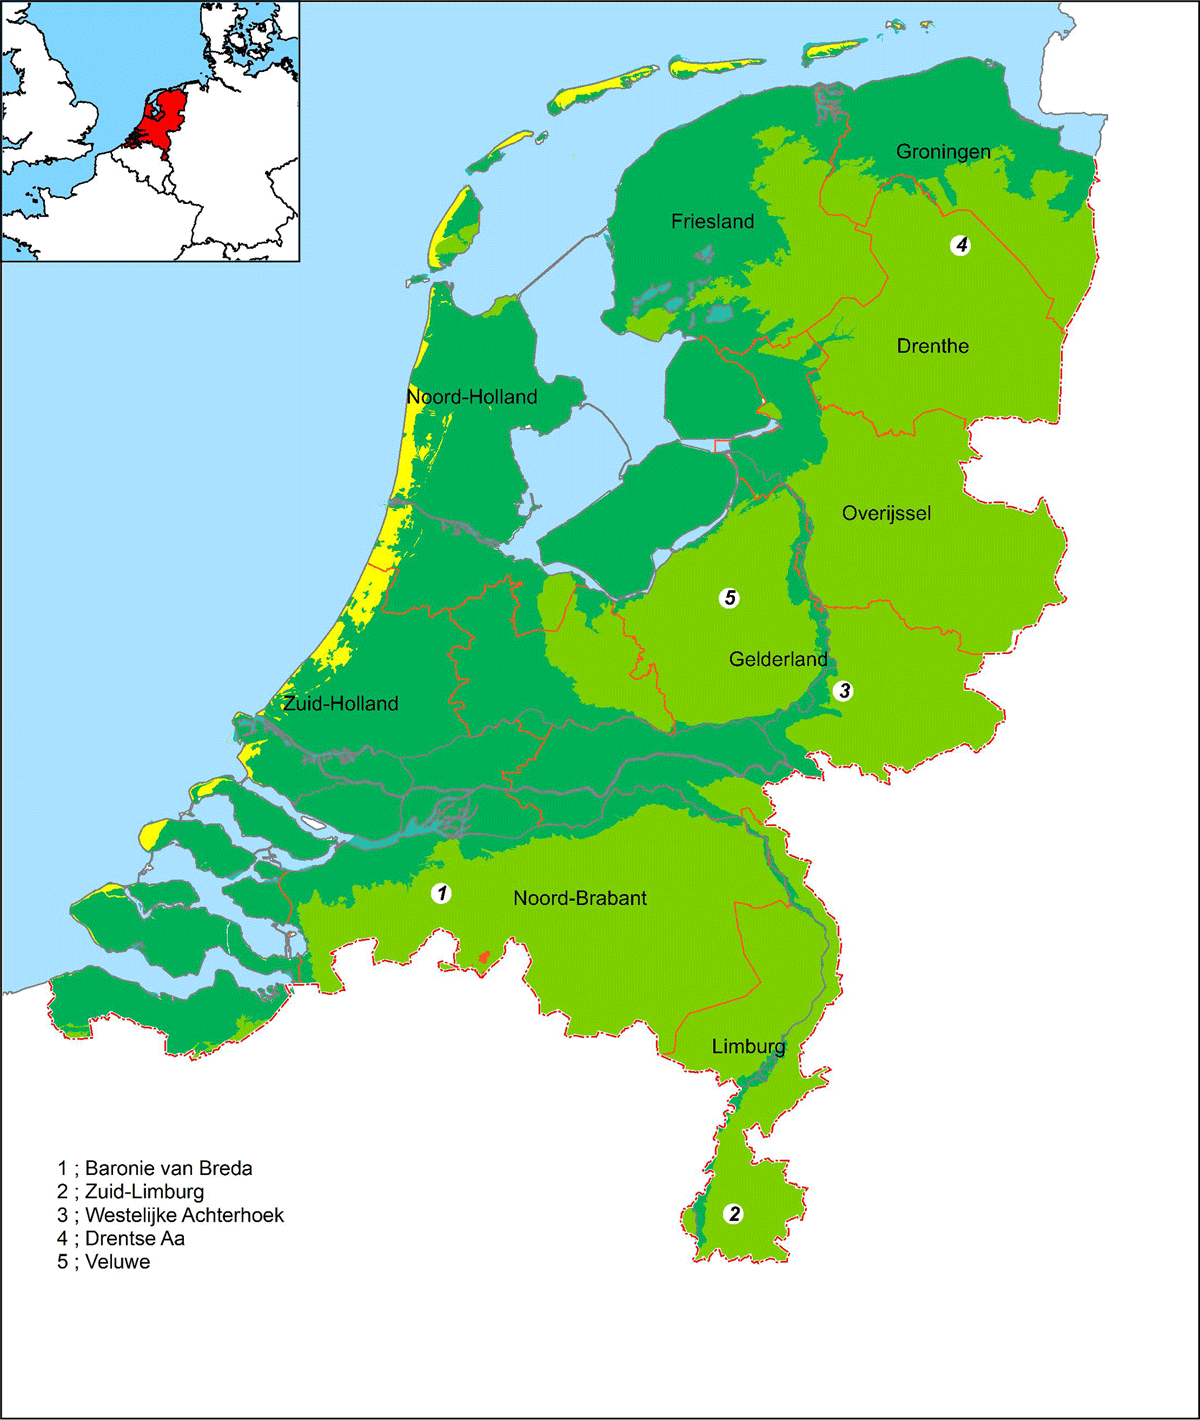
Figure 1
Research area: The Netherlands. Dark green: low-lying areas (peat, clay); light green: higher, predominantly sandy areas; yellow: coastal dunes. Regions and test areas (numbers mentioned in the text are indicated).
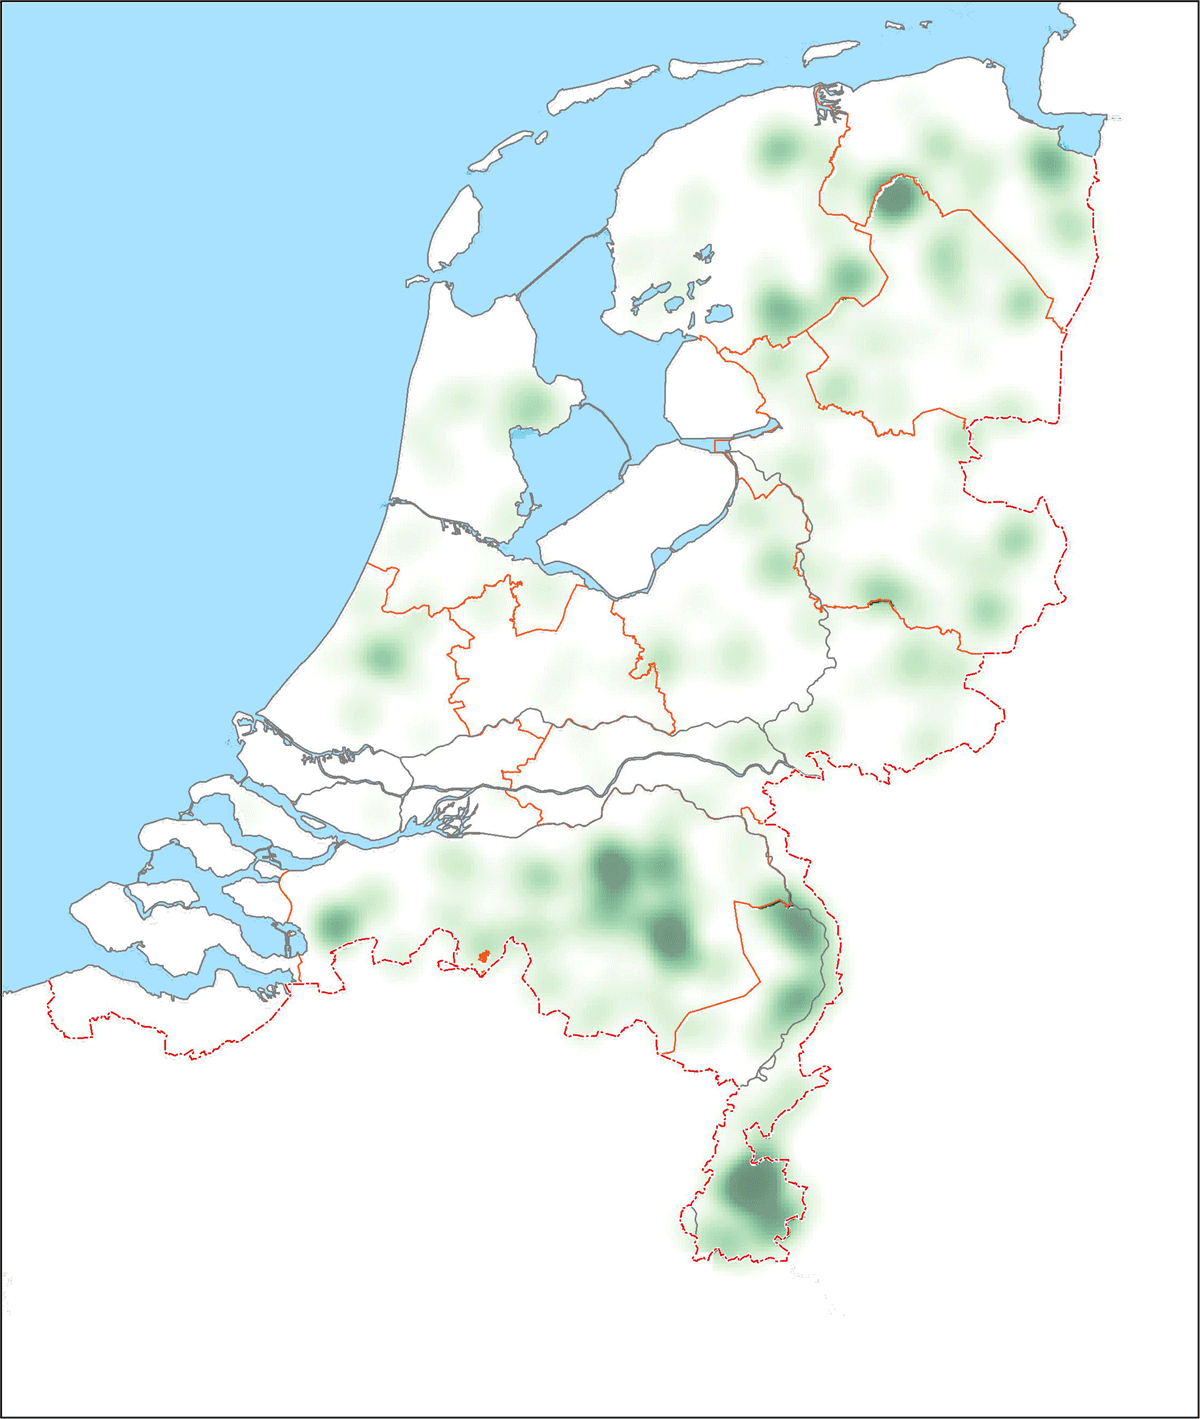
Figure 2
Indicative distribution map of the distribution of larger and smaller settlements with names referring to (the presence of) woodland (period 1: AD 750–1350).
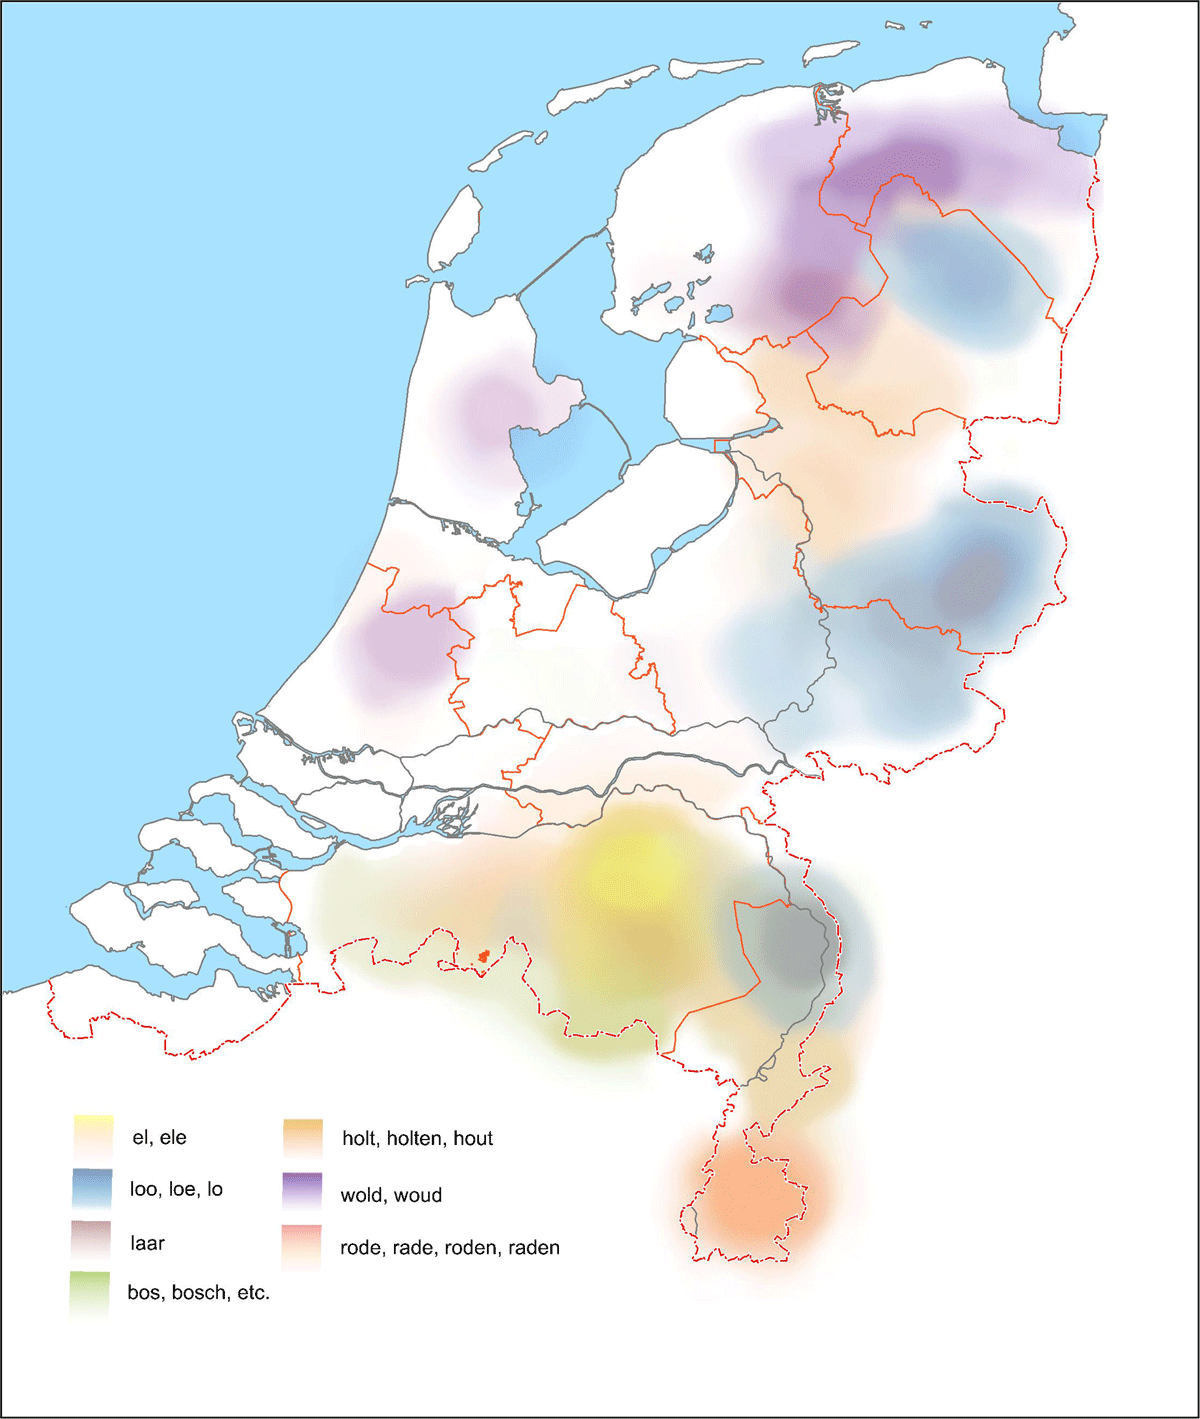
Figure 3
Indicative distribution map of settlements with names referring to specific historical woodland types (period 1: AD 750–1350.
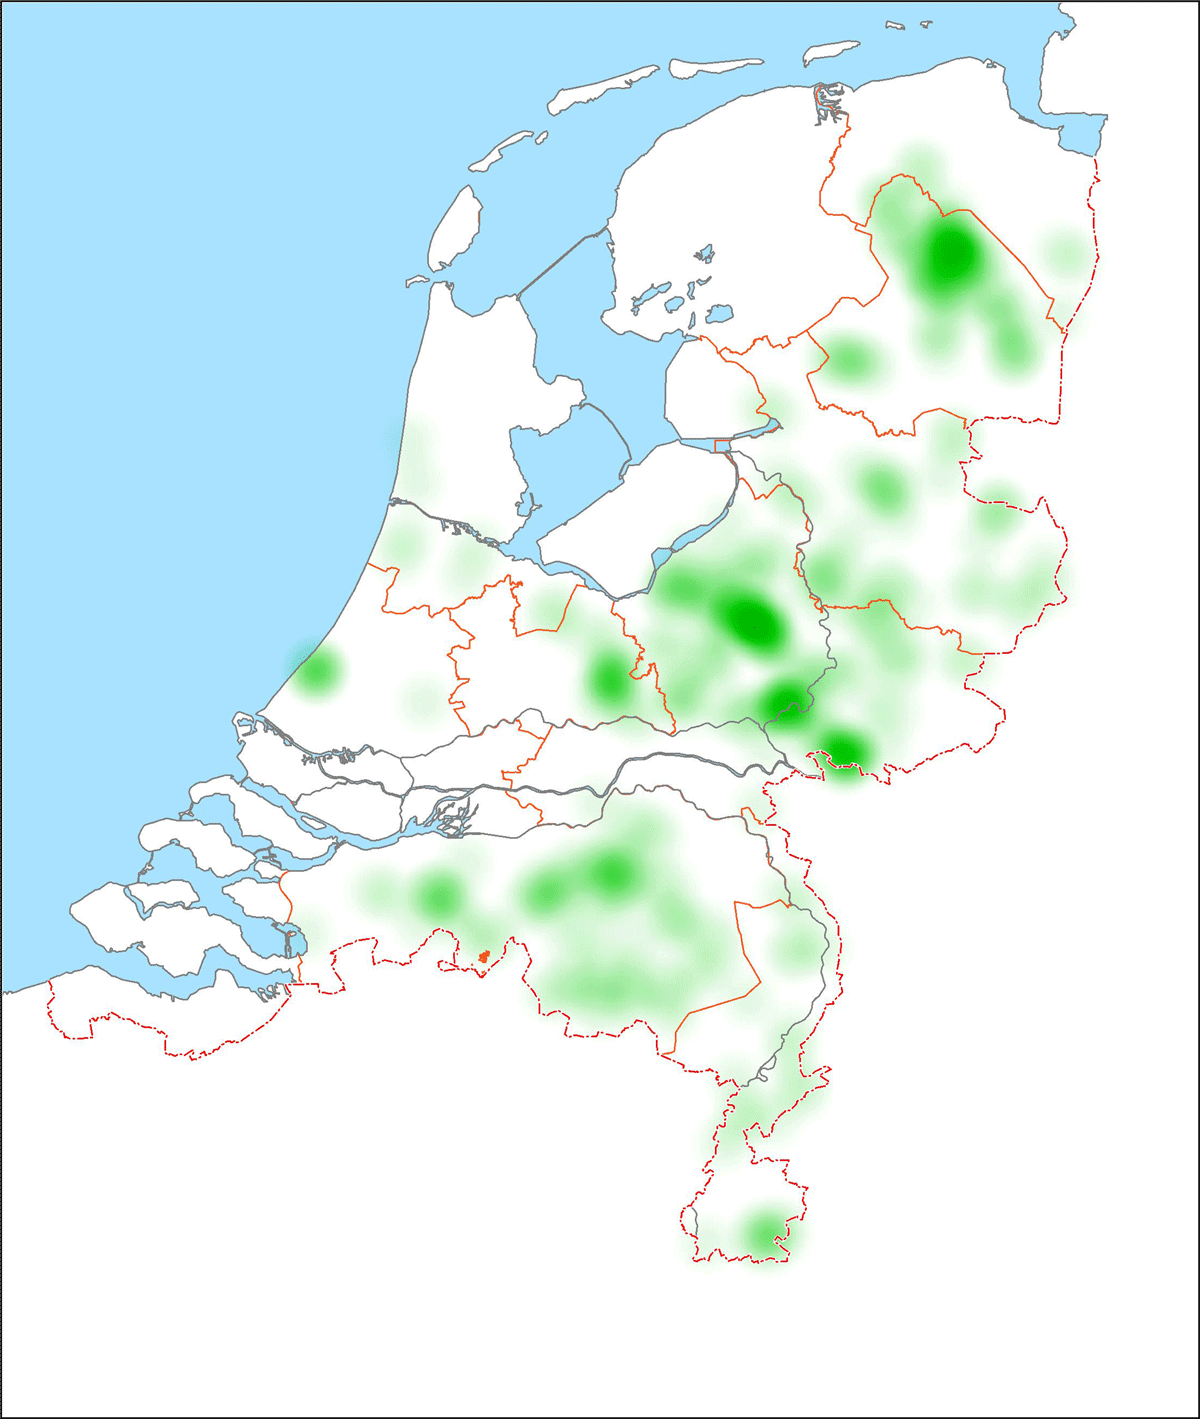
Figure 4
Indicative distribution map of woodland mentioned in historical sources (period 2: AD 1250–1650).
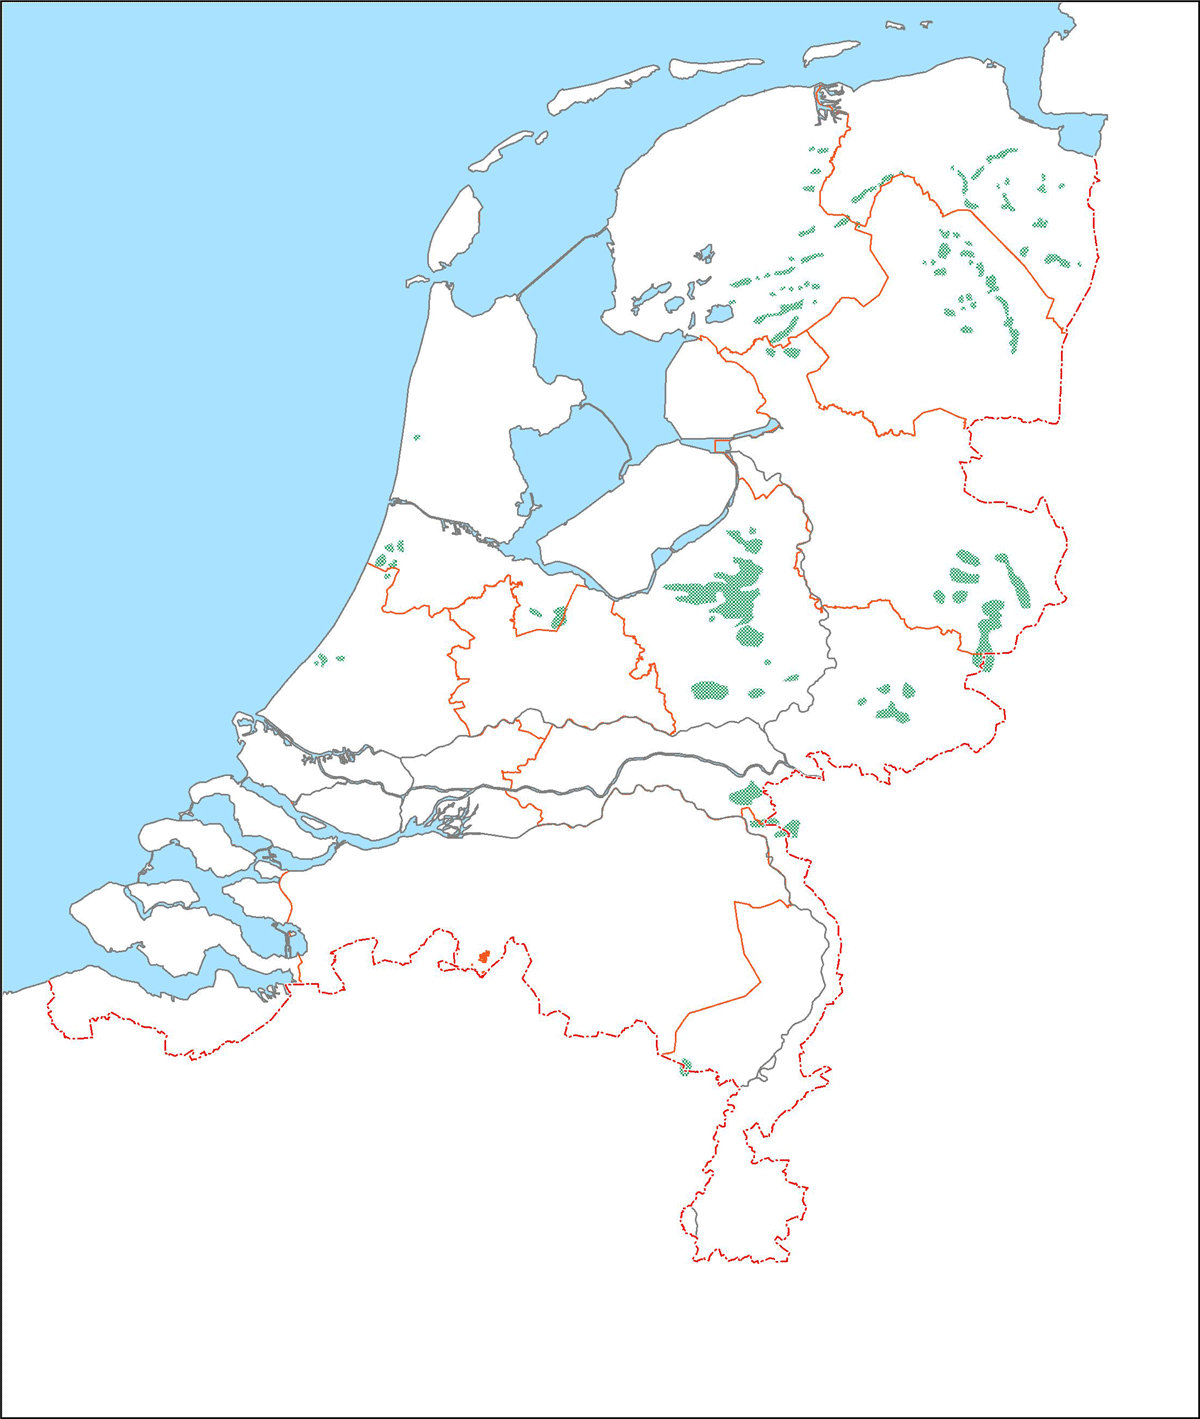
Figure 5
Woodland indicated on the maps of the Atlas sive Cosmographicae Meditationes de Fabrica Mundi et Fabricati Figura, or Mercator/Hondius atlas (1607).
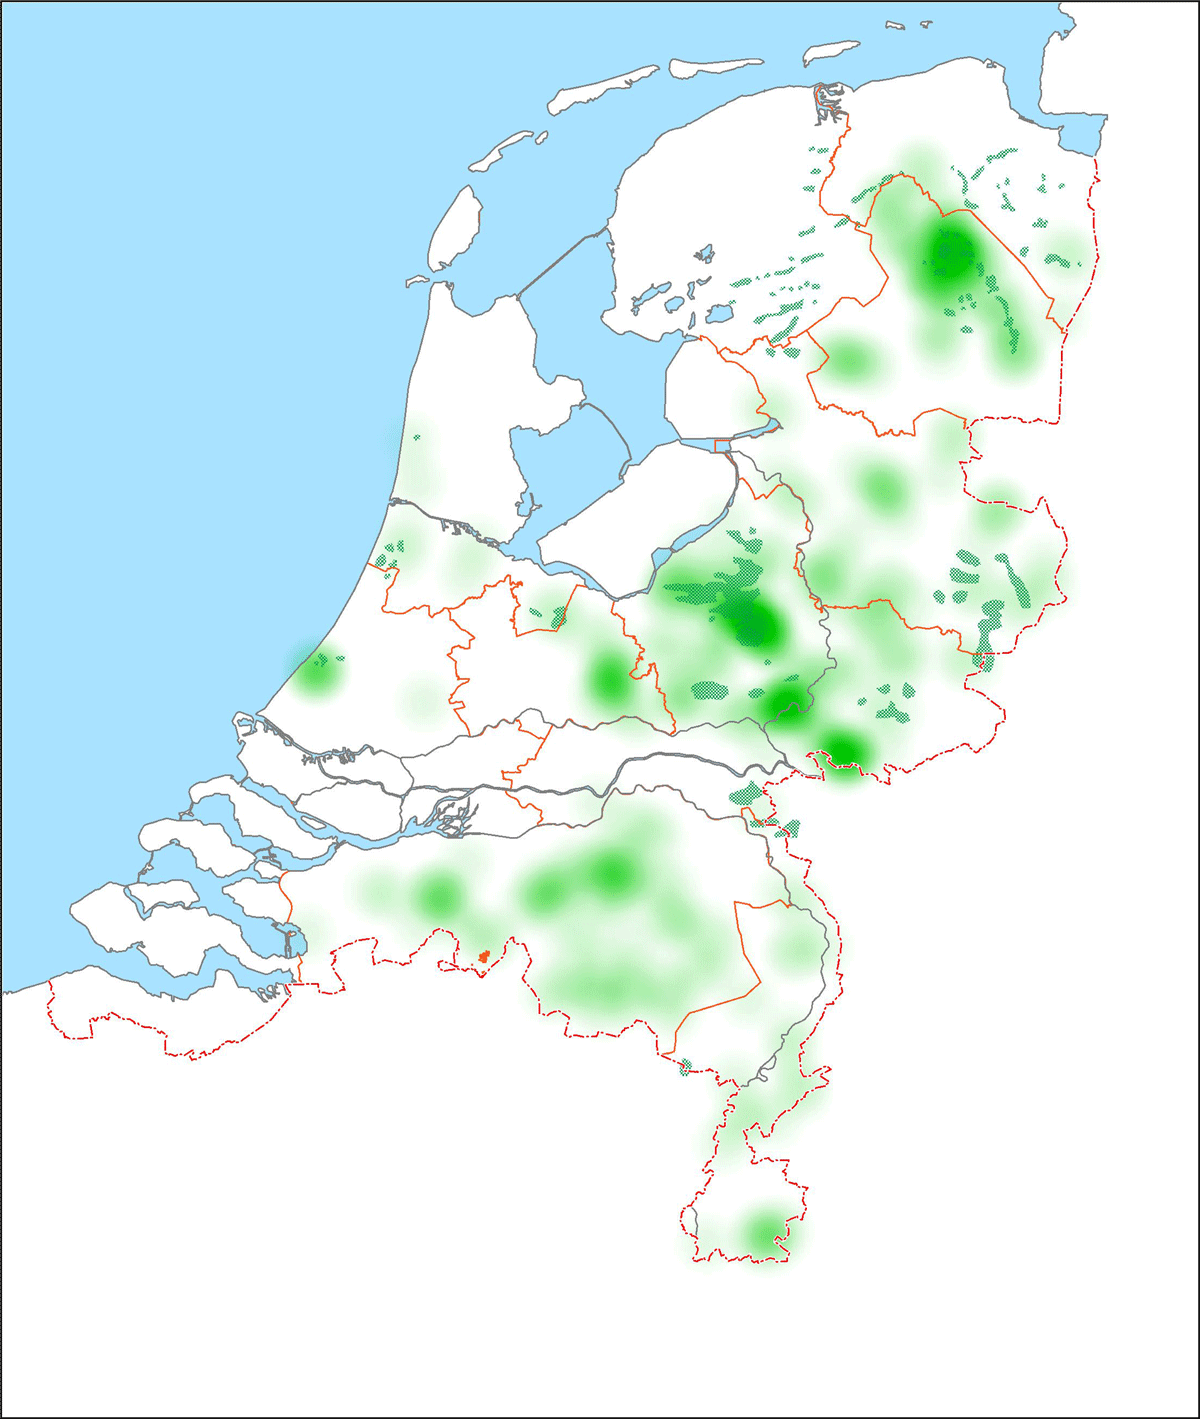
Figure 6
Woodland indicated on the maps of the Atlas sive Cosmographicae Meditationes de Fabrica Mundi et Fabricati Figura, or Mercator/Hondius atlas (1607), compared with the indicative distribution map of historical woodland references (period 2, AD 1250–1650).
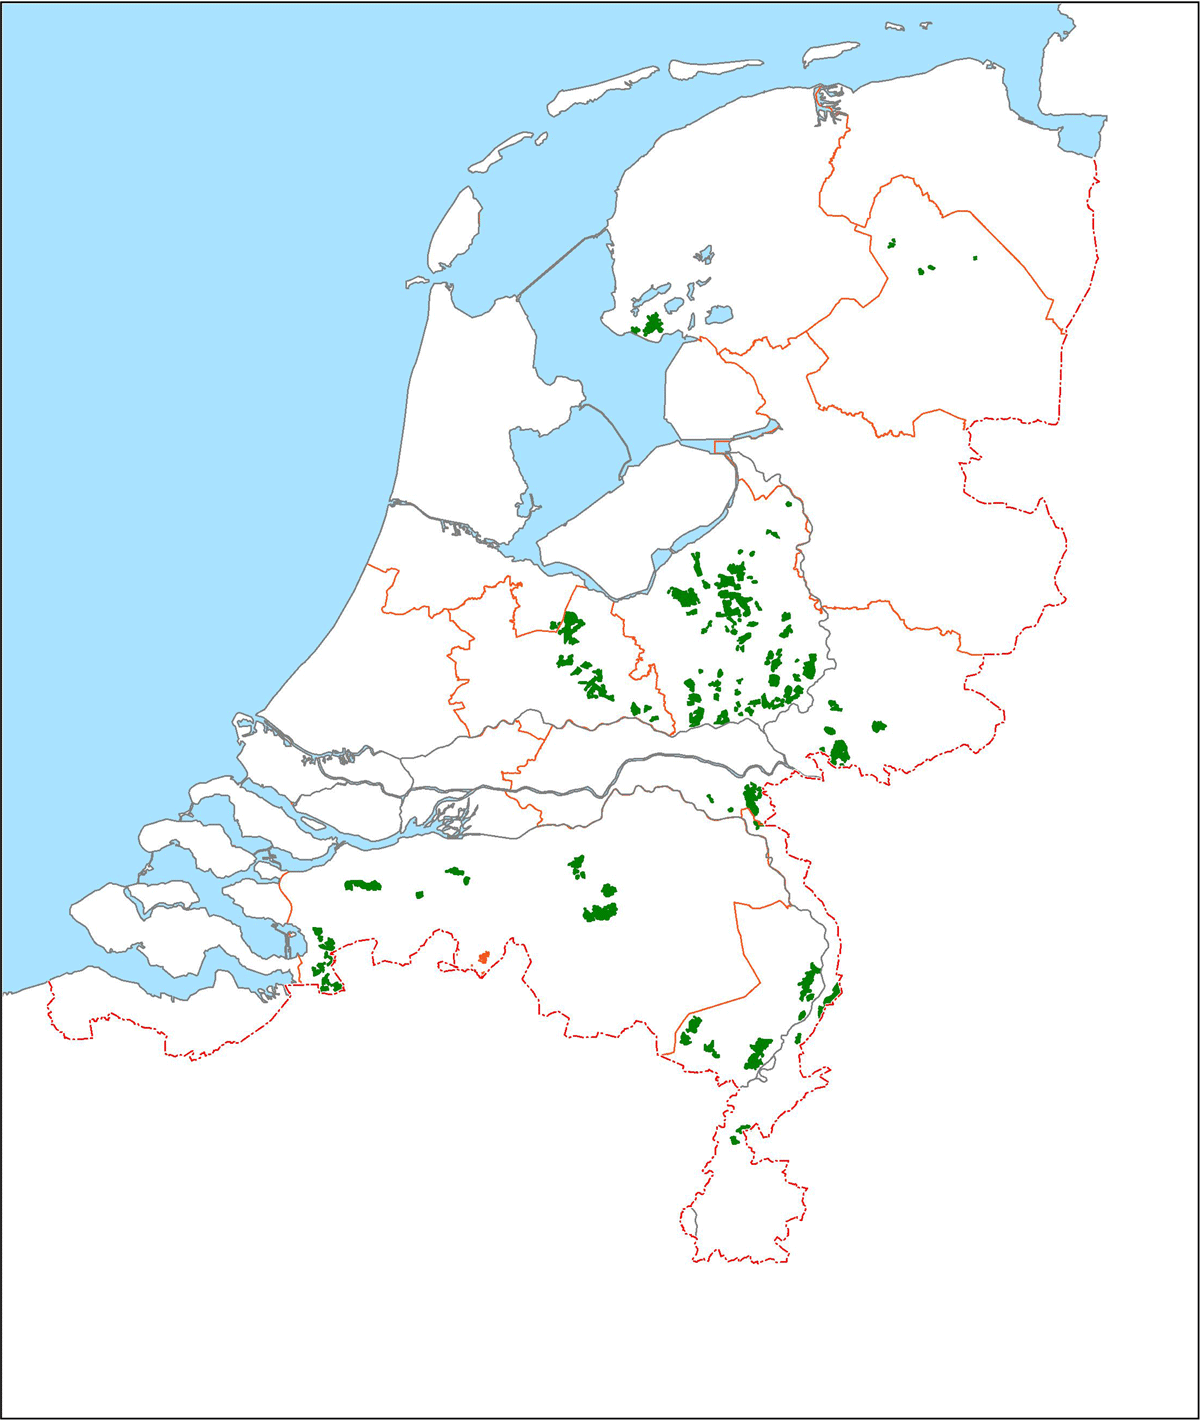
Figure 7
Distribution of ‘ancient woodland’, based on HISTLAND (Dirkx and Nieuwenhuizen, 2013).
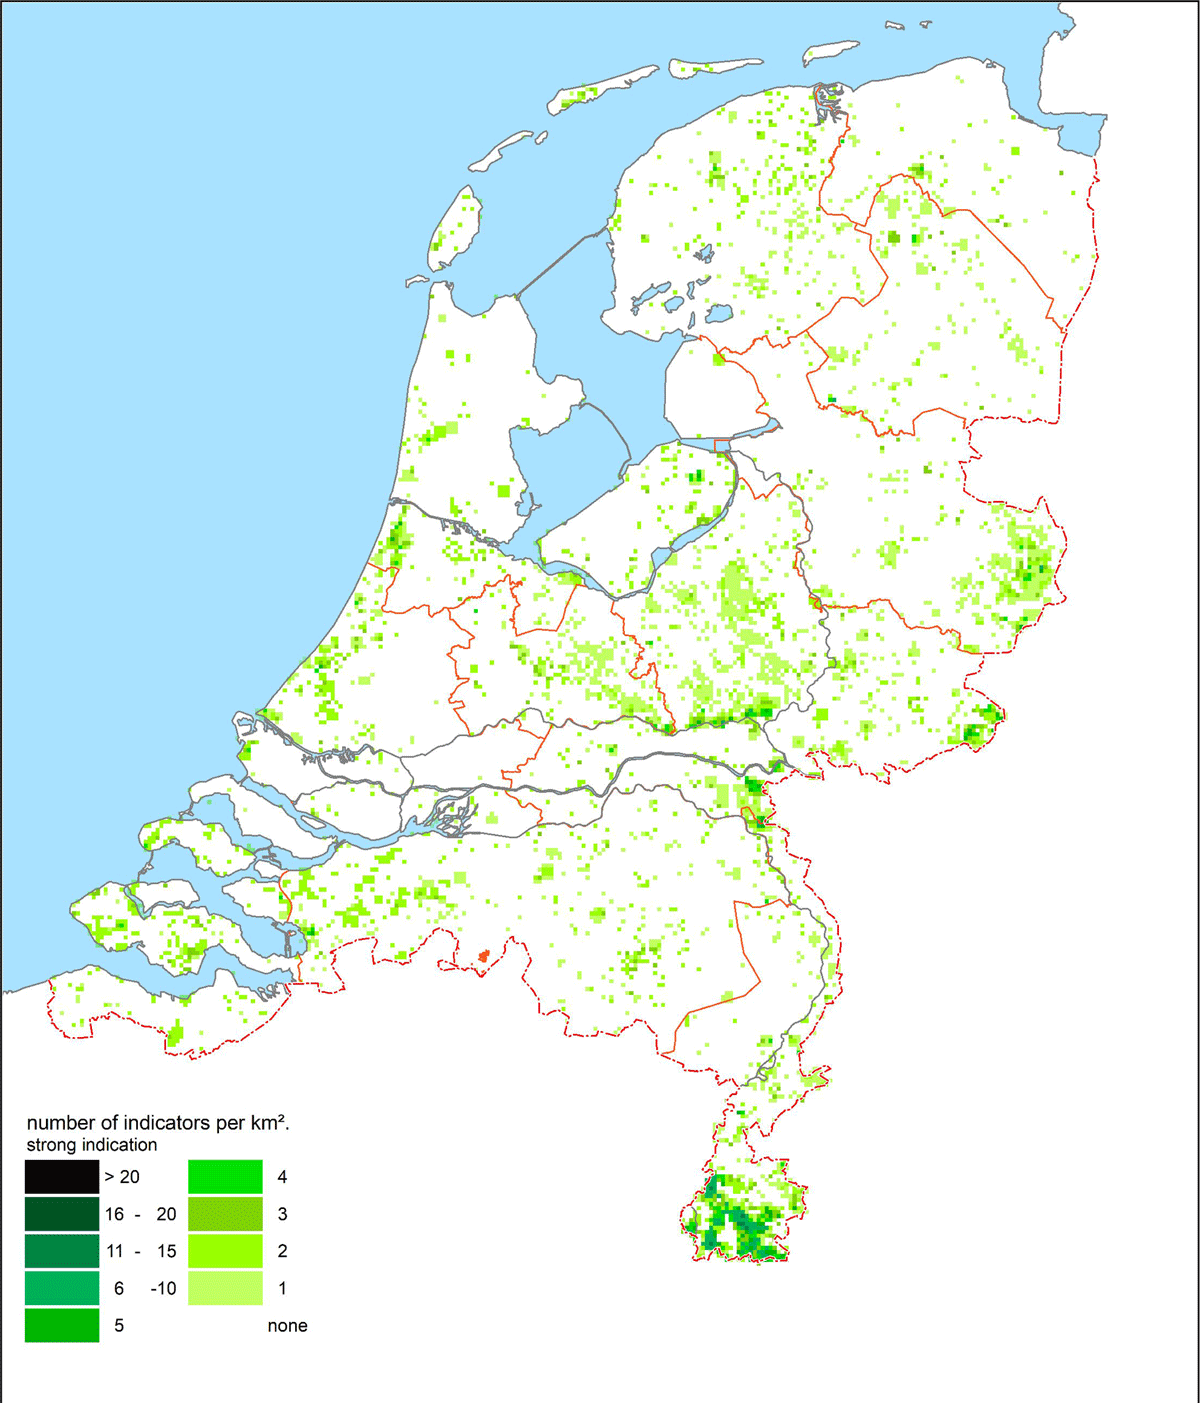
Figure 8
Distribution per km2 of the most indicative ancient woodland indicator plants (with thanks to Dr Otto Brinkkemper, RCE).
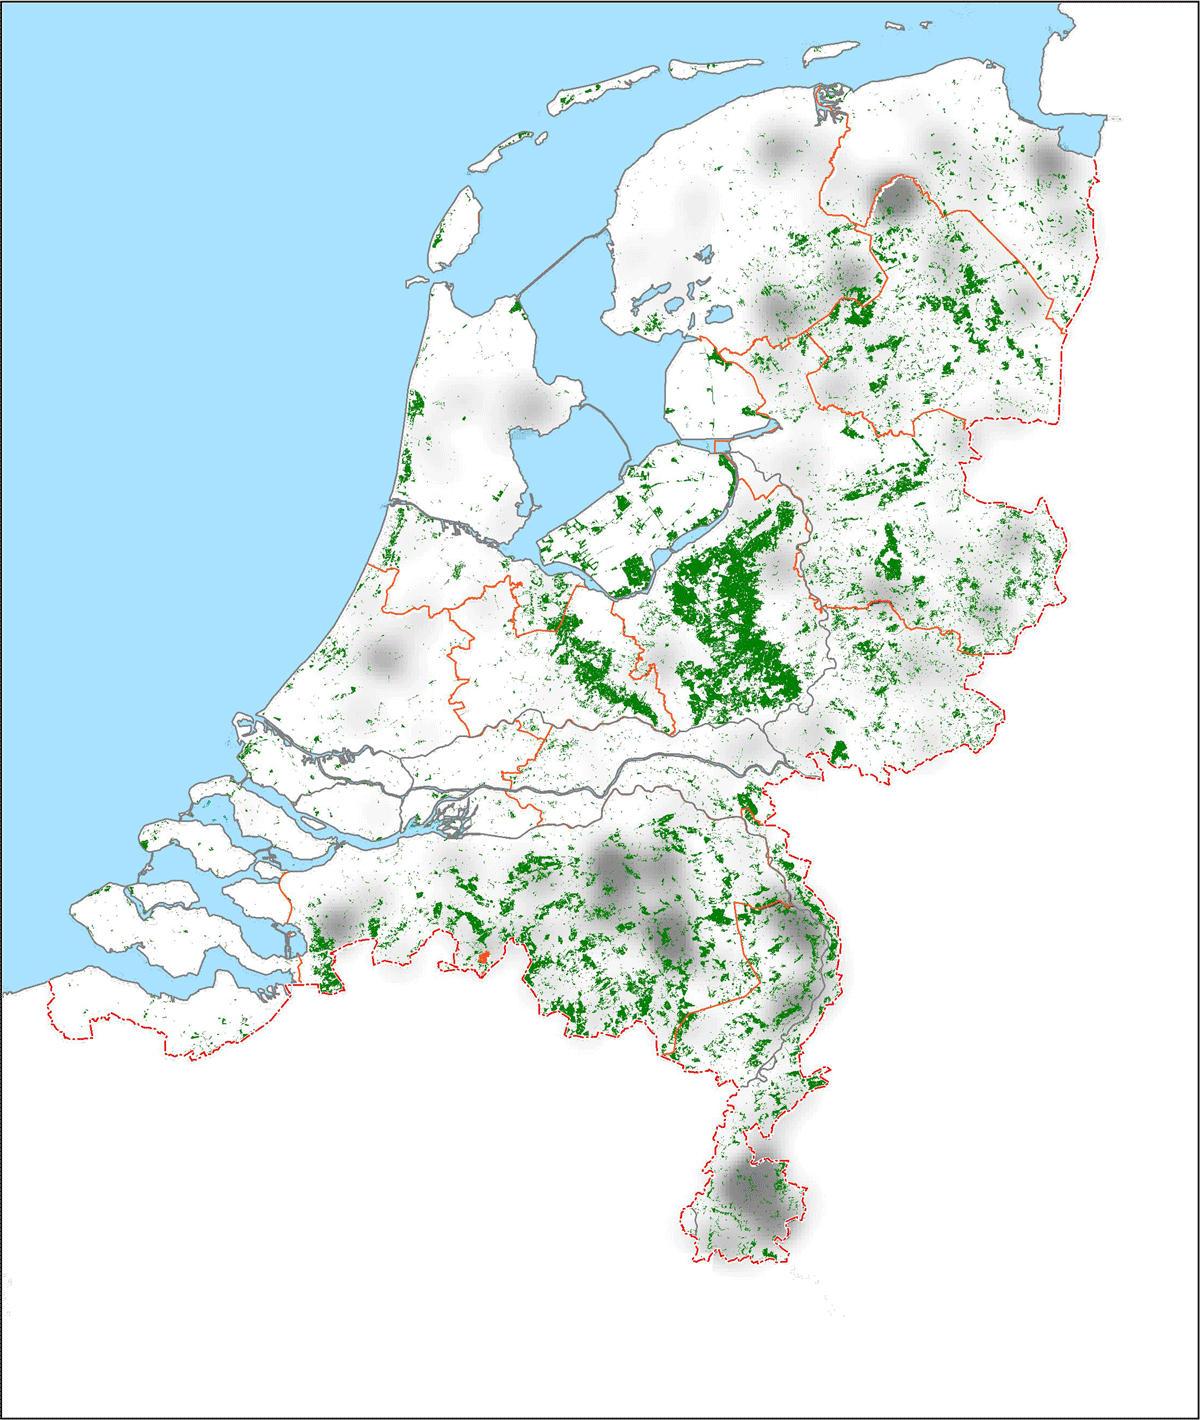
Figure 9
The distribution of woodland-related place names (indicative distribution map period 1: AD 750–1350) differs fundamentally from that of modern woodland (green).