
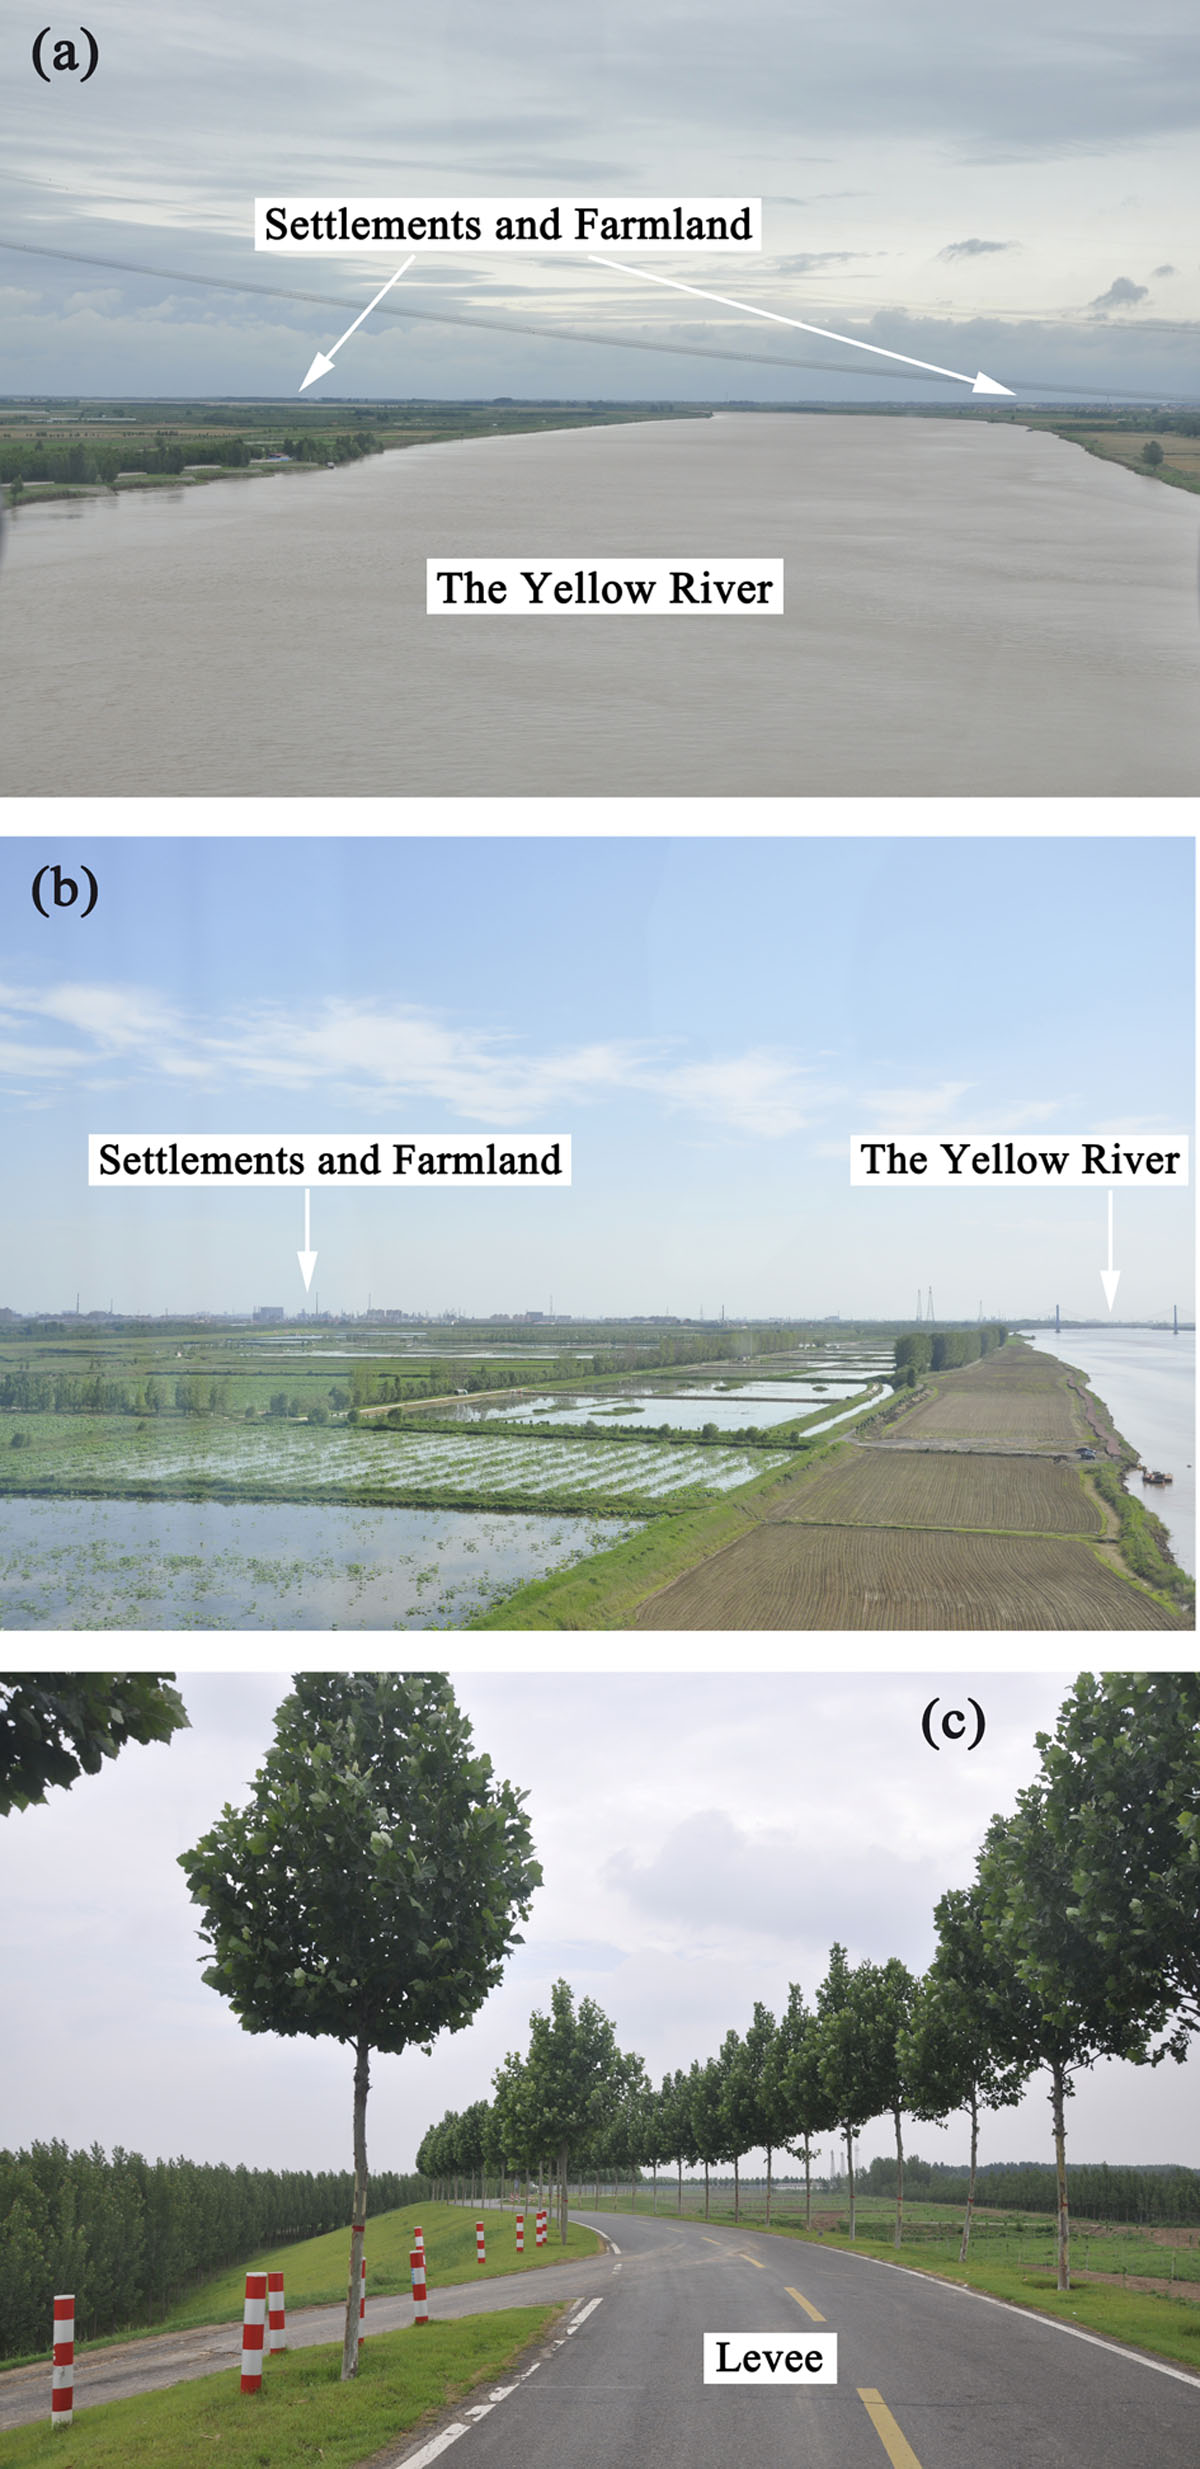
Figure 1
Settlements, farmland and a levee in the Yellow River Delta. (a) the photo taken on the pontoon bridge near Ningjia village, Kenli District, Dongying City; (b) the photo taken on the Dongying Yellow River Bridge in Kenli District, Dongying City; (c) the photo taken near the Lijin Hydrological Station, in Lijin District, Dongying City.
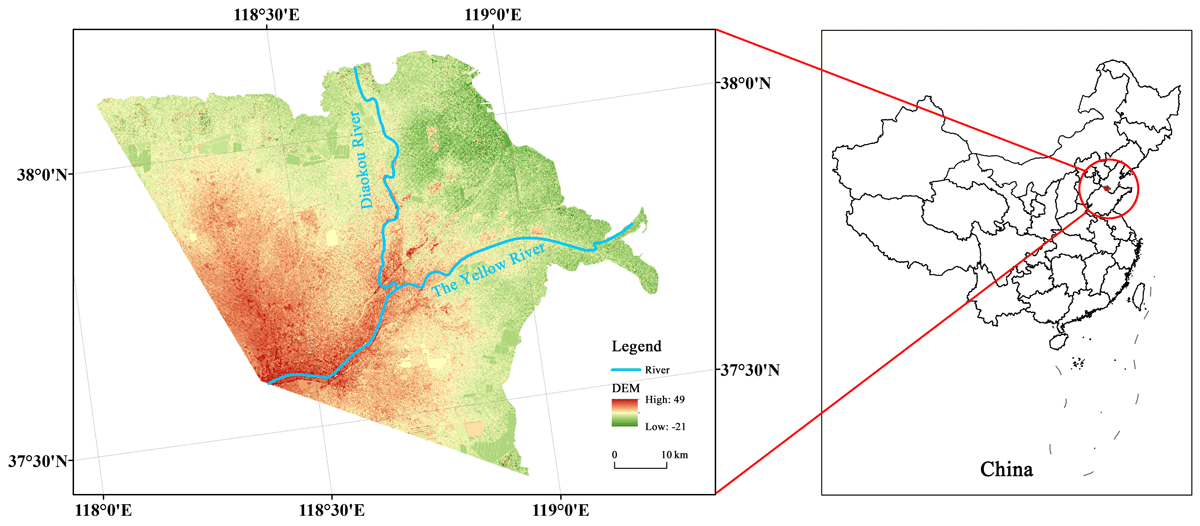
Figure 2
Yellow River Delta.
Table 1
History of the YRD distributary channels and avulsions since 1855 (Administration Bureau of the Yellow River Estuary, the Yellow River Conservancy Commission, 1995).
| NO. | AVULSION YEAR | AVULSION LOCATION | LOCATION OF CHANNEL MOUTH | CAUSE OF AVULSION | TIME INTERVAL TO THE NEXT AVULSION | ACTIVE TIME |
|---|---|---|---|---|---|---|
| 1 | June 1855 | Tongwaxiang | Xiaoshenmiao Village and Oyster Mouth | The first active river since Tongwaxiang crevasse | 33 years and 9 months | 19 years |
| 2 | March 1889 | Hanjiayuan | Maosituo | The breaching due to ice jam in winter | 8 years and 2 months | 5 years and 10 months |
| 3 | May 1897 | Beilingzi | Siwangkou | The dyke breaching due to flood | 7 years and 1 month | 5 years and 9 months |
| 4 | June 1904 | Yanwo | Lao Hu Mouth, Car Ditch, Noodle Ditch, Tao ‘er River | Crevasse caused by summer flood | 22 years | 17 years and 9 months |
| 5 | June 1926 | Balizhuang | Old Diaokou | Crevasse caused by summer flood | 3 years and 2 months | 2 years and 11 months |
| 6 | August 1929 | Jijiazhuang | Nanwang River; Siwangkou old River Course; Song Chunrong Ditch; Qingtuozi | Artificial breaking diversion | 5 years | 3 years and 4 months |
| 7 | August 1934 | No. 1 Dam in closure | Sweet Water Ditch, Fairy Ditch, Song Chunrong Ditch | Crevasse caused by summer flood | 19 years | 9 years and 2 months |
| 8 | July 1953 | Xiaokouzi | Fairy Ditch | The artificial course diversion | 10 years and 5 months | 10 years and 5 months |
| 9 | January 1964 | Luojiawuzi | Diaokou River | Artificial diversion | 12 years and 5 months | 12 years and 5 months |
| 10 | May 1976 | West river mouth | Fresh Water Ditch | Artificial diversion | 20 years and 2 months | 20 years and 2 months |
| 11 | July 1996 | Qing 8 Route | Artificial diversion | To date |
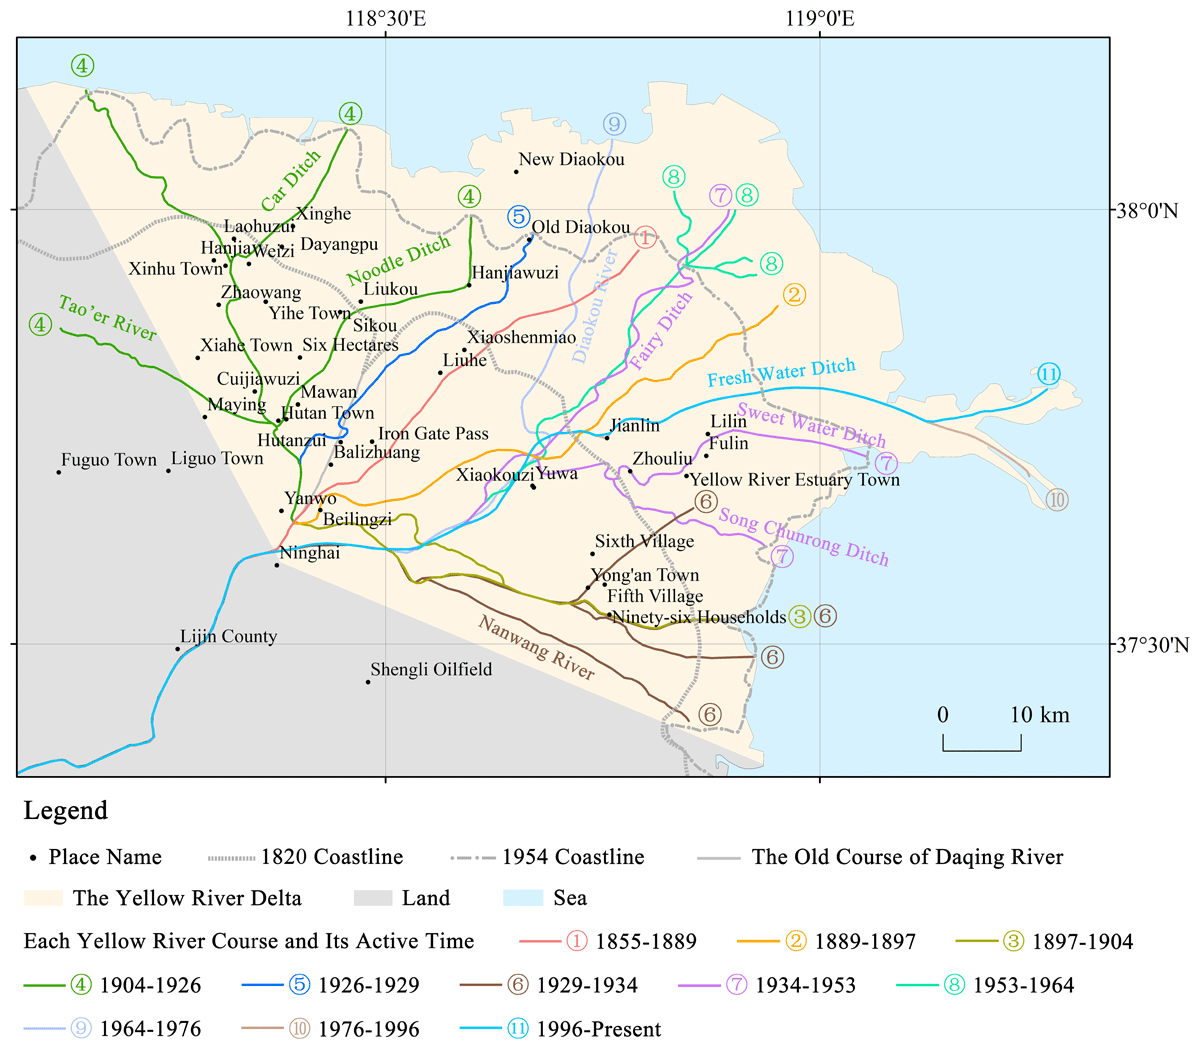
Figure 3
Course changes in the Yellow River Delta.
Table 2
Data sources of rural settlements in the Yellow River.
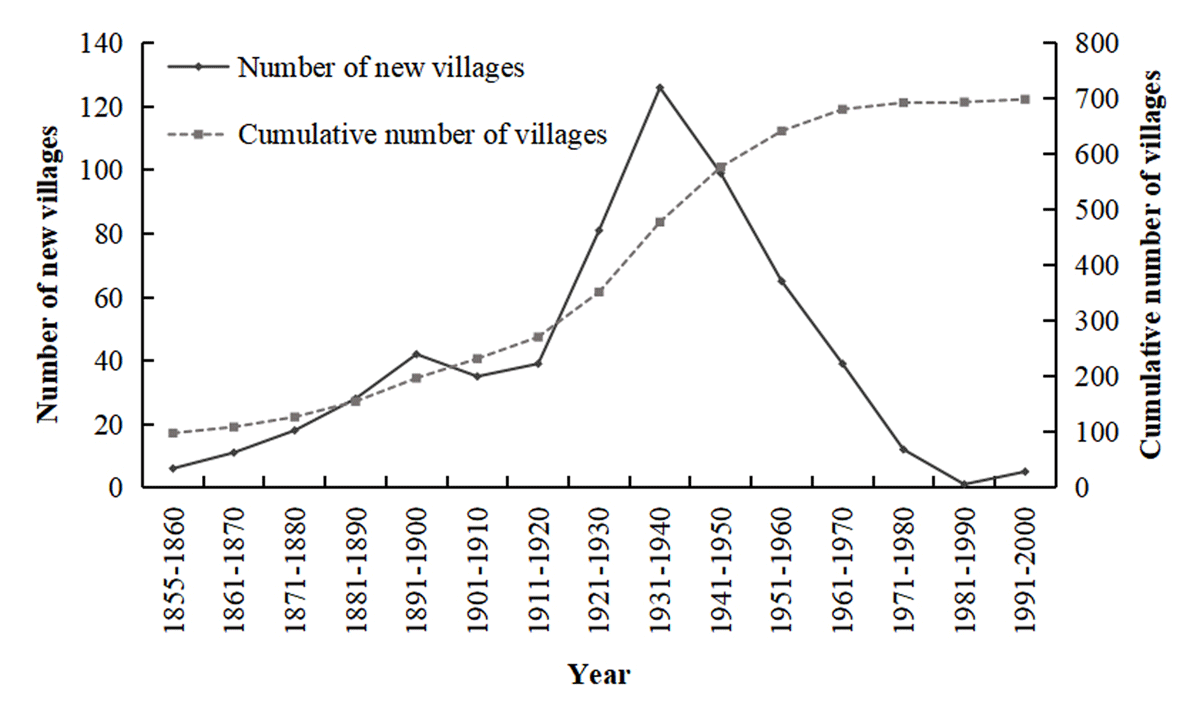
Figure 4
Changes in the number of villages in the Yellow River Delta.
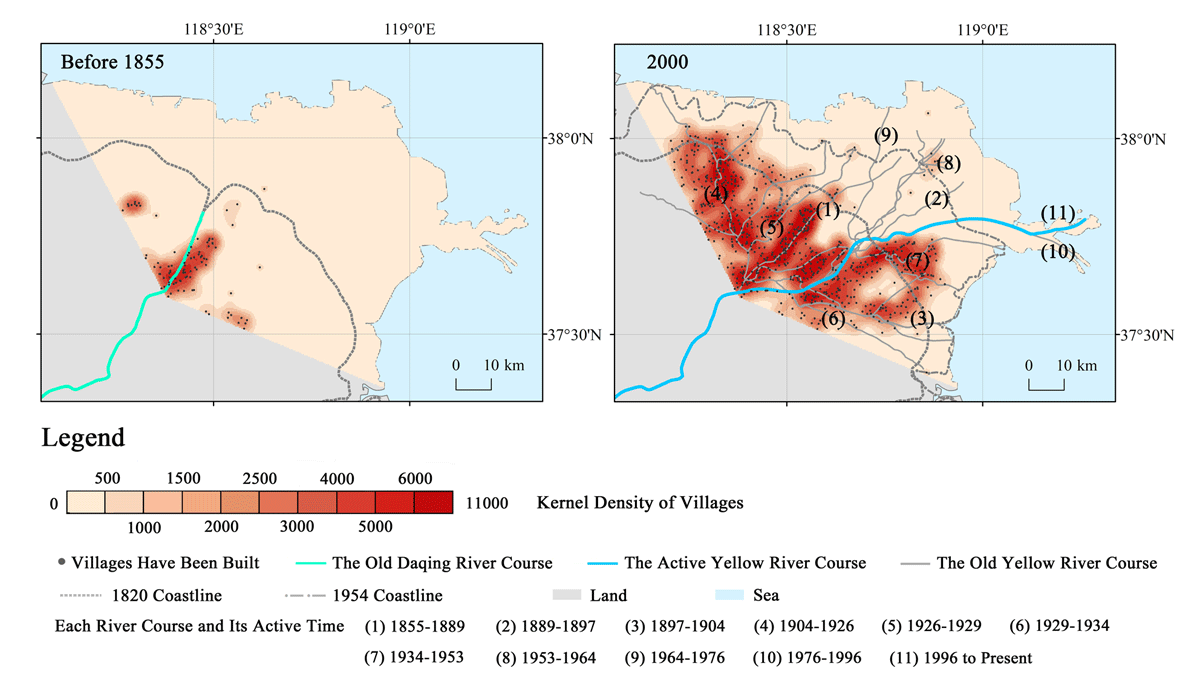
Figure 5
Spatial pattern of villages in the Yellow River Delta.
Table 3
The number and proportion of newly added villages along the Yellow River during each flow period *.
| RIVER COURSE 1 | RIVER COURSE 2 | RIVER COURSE 3 | RIVER COURSE 4 | RIVER COURSE 5 | RIVER COURSE 6 | RIVER COURSE 7 | RIVER COURSE 8 | RIVER COURSE 9 | RIVER COURSE 10 | THE NUMBER OF NEW VILLAGES ALONG THE COURSES IN EACH PERIOD | THE TOTAL NUMBER OF NEW VILLAGES IN EACH PERIOD | ||
|---|---|---|---|---|---|---|---|---|---|---|---|---|---|
| 1855–1889 | N** | 38 | 38 | 48 | |||||||||
| P*** | 79% | 79% | |||||||||||
| 1889–1897 | N | 12 | 15 | 27 | 32 | ||||||||
| P | 37% | 47% | 84% | ||||||||||
| 1897–1904 | N | 6 | 10 | 10 | 26 | 36 | |||||||
| P | 16% | 28% | 28% | 72% | |||||||||
| 1904–1926 | N | 5 | 13 | 11 | 64 | 93 | 107 | ||||||
| P | 5% | 12% | 10% | 60% | 87% | ||||||||
| 1926–1929 | N | 1 | 0 | 3 | 9 | 0 | 13 | 17 | |||||
| P | 6% | 0% | 18% | 53% | 0% | 77% | |||||||
| 1929–1934 | N | 1 | 2 | 4 | 31 | 2 | 4 | 44 | 51 | ||||
| P | 2% | 4% | 8% | 60% | 4% | 8% | 86% | ||||||
| 1934–1953 | N | 7 | 5 | 10 | 87 | 15 | 56 | 27 | 207 | 217 | |||
| P | 3% | 2% | 5% | 40% | 7% | 26% | 12% | 95% | |||||
| 1953–1964 | N | 2 | 1 | 0 | 4 | 11 | 1 | 59 | 3 | 81 | 82 | ||
| P | 2% | 1% | 0% | 5% | 14% | 1% | 72% | 4% | 99% | ||||
| 1964–1976 | N | 3 | 1 | 0 | 4 | 2 | 1 | 6 | 1 | 0 | 18 | 18 | |
| P | 16% | 6% | 0% | 22% | 11% | 6% | 33% | 6% | 0% | 100% | |||
| 1976–1996 | N | 1 | 0 | 0 | 1 | 0 | 1 | 7 | 2 | 0 | 0 | 12 | 13 |
| P | 8% | 0% | 0% | 8% | 0% | 8% | 54% | 15% | 0% | 0% | 93% | ||
| The total number of new villages along each channel | 76 | 47 | 38 | 200 | 30 | 63 | 99 | 6 | 0 | 0 | |||
[i] * Villages within 5 km of each river course are counted as coastal villages of each old route
** The number of newly added villages along each course.
*** The proportion of newly added villages along courses to the total number of new villages in the period.
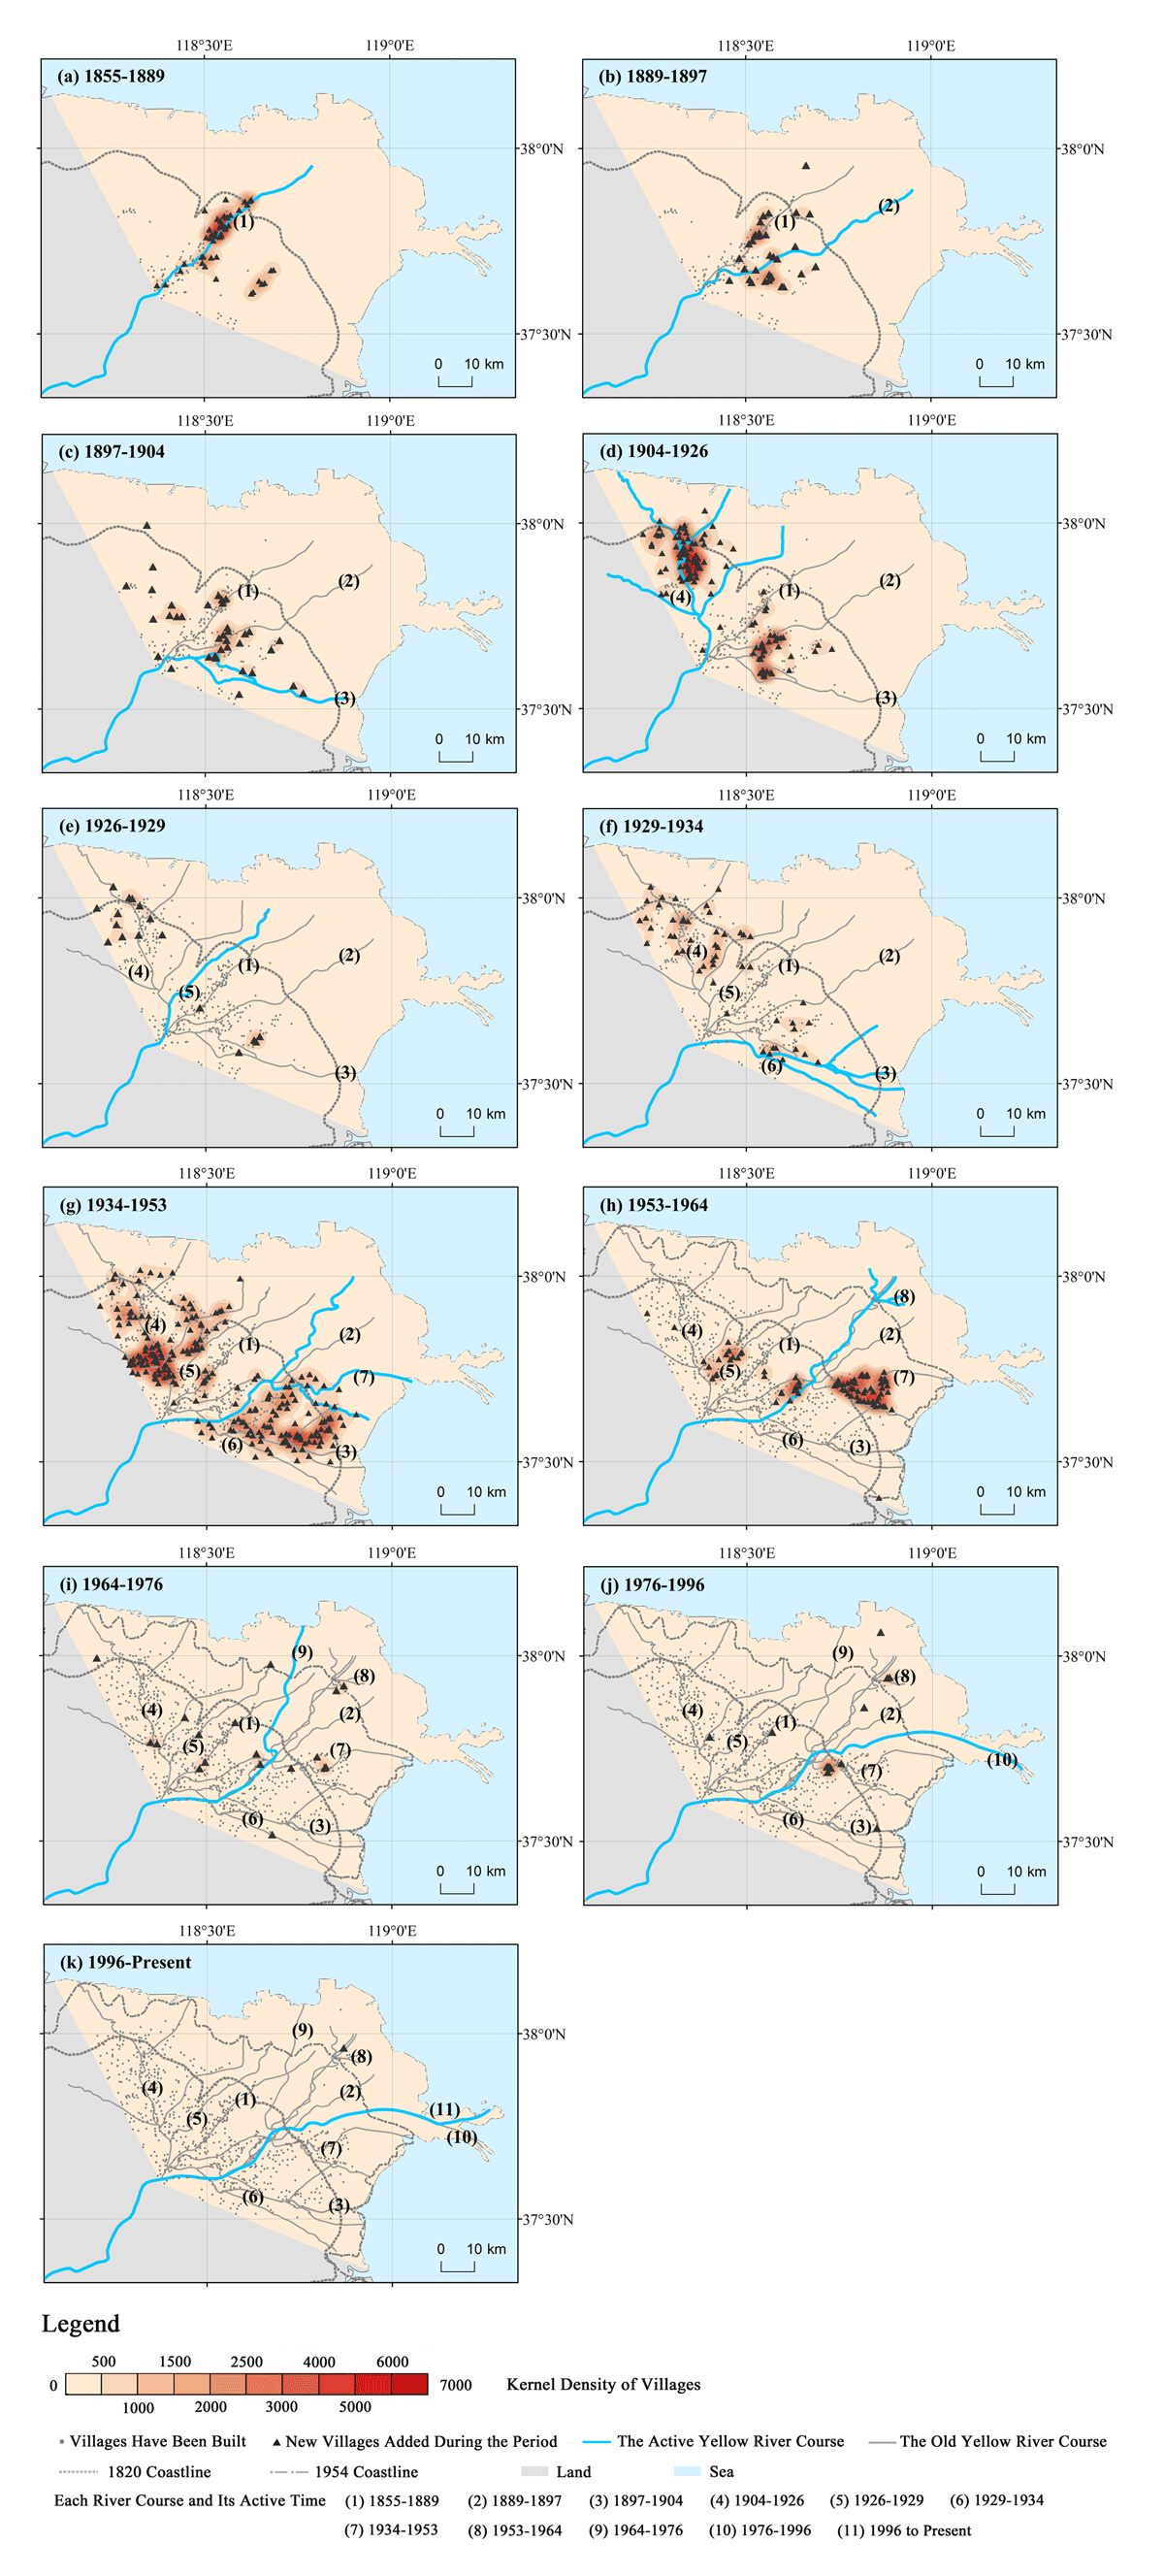
Figure 6
Density distribution of newly added villages in the Yellow River Delta during different periods after 1855.