
Table 1
Introductory programme tracks 2011–2019.
| IP programme track | Aim | |
|---|---|---|
| Preparatory programme | Replaced by program-oriented choice July 2019 | Making students eligible for a 3-year national programme within a year |
| Program-oriented individual choice | Making students eligible for a 3-year national vocational programme within a shorter time (the only IP alternative with entry requirements) | |
| Vocational introduction | Making students in need of a more extensive completion eligible for a vocational programme and prepared for work | |
| Individual alternative | Preparing the student for other education, work introduction, or work | |
| Language introduction | Making newly arrived migrant youths eligible for upper secondary education, focusing on the acquisition of the Swedish language | |
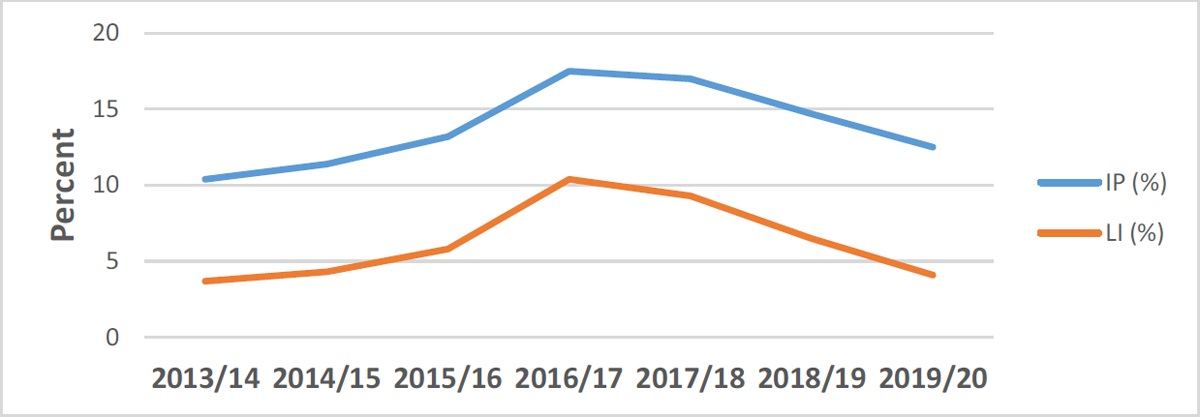
Figure 1
Students in all five IP tracks and in LI 2013/14–2019/20 as a proportion of all upper secondary school students (%). Calculations based on data from Statistics Sweden.
Table 2
Employment, income, demographic data, and education in the three municipal groups (2018).
| Structural aspect | Commuter municipalities | Small cities/towns | Rural municipalities | All Sweden |
|---|---|---|---|---|
| Working population 20–64 years (%) | 83 | 81.2 | 79.9 | 80.6 |
| Unemployment 18–64 years, prop. of pop. (%) | 4 | 6.4 | 7.3 | 6.1 |
| Unemployment 16–24 years, prop. of pop. (%) | 3.0 | 6.0 | 7.2 | 4.7 |
| Average taxable income, 1000 SEK/inhabitant | 231 | 197 | 180 | 194 |
| Age dependency ratio | 0.8 | 0.85 | 0.94 | 0.87 |
| Change in population during the last 5 years (%) | 8.5 | 4 | –0.3 | 4.2 |
| Inhabitants 25–64 years with a tertiary education degree (%) | 45.5 | 35.6 | 25.9 | 33.3 |
[i] Compilation based on searches in the KOLADA database.
Table 3
Proportion of students eligible for national upper secondary education in the three municipal groups and the proportion of newly arrived grade 9 students in 2018 (%).
| Commuter | Small city | Rural | |
|---|---|---|---|
| Grade 9 students eligible for an academic upper secondary programme | 86 | 80 | 78 |
| Grade 9 students eligible for a vocational upper secondary programme | 89 | 83 | 81 |
| Grade 9 students eligible for a vocational upper secondary programme (newly immigrated students excluded) | 92 | 87 | 86 |
| Newly arrived students in grade 9 (%) | 5 | 8 | 12 |
[i] Compilation based on searches in the KOLADA database.
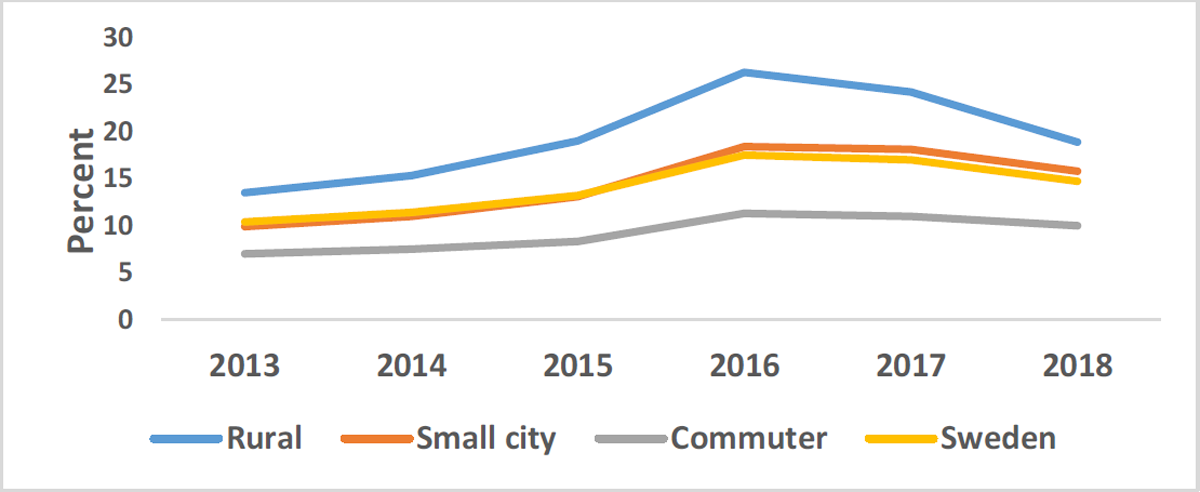
Figure 2
Students in the IP from 2013/14 to 2018/19 in Sweden as a proportion of all upper secondary school students (%) in the three categories of municipalities.
Source: KOLADA.
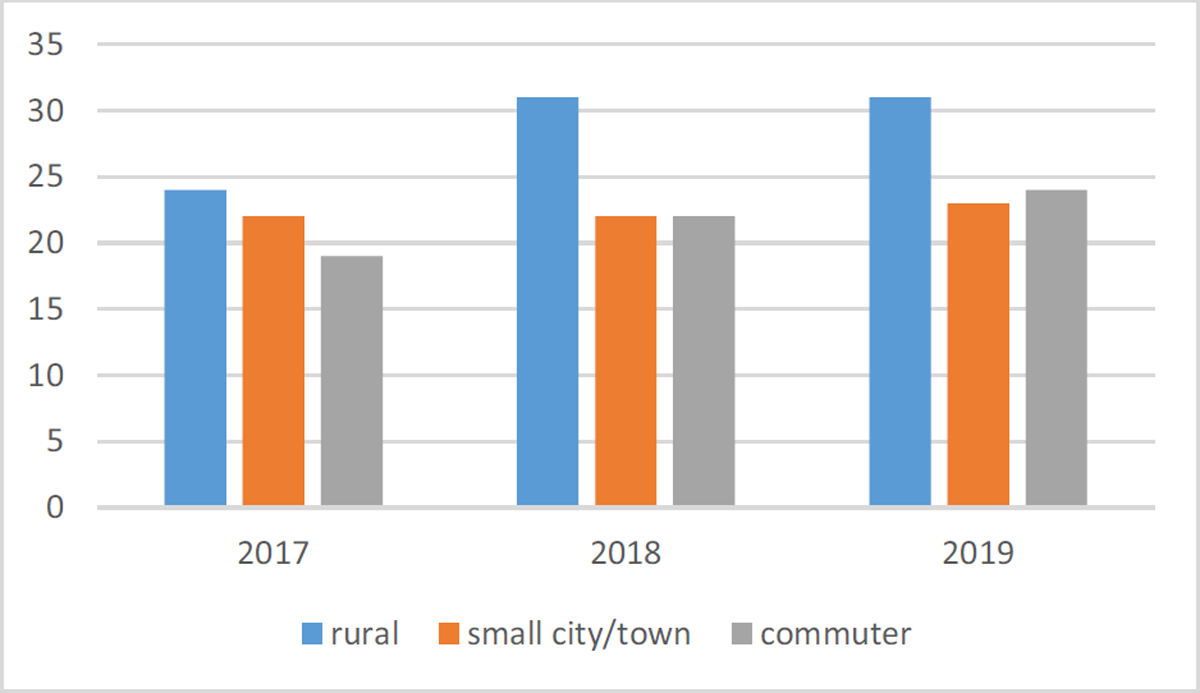
Figure 3
USE students from public schools with a degree or study certificate within 4 years from starting at an IP (%).
Source: KOLADA.
Table 4
Access to qualified staff and competence development opportunities (N = 139).
| Proportion of respondents who fully or partially agree with the statement (%) | Commuter | Small city | Rural |
|---|---|---|---|
| Most of the teachers have a teacher education degree | 94 | 93 | 86 |
| Most of the teachers have a degree in the subjects they are teaching | 91 | 91 | 79 |
| The availability of staff speaking several languages is good | 71 | 71 | 57 |
| The availability of special education competence is good | 67 | 77 | 73 |
| The availability of trained study and vocational counsellors (career counsellors) is good | 79 | 92 | 73 |
| Teachers and other IP staff are continuously offered opportunities for competence development | 60 | 77 | 64 |
[i] Source: Questionnaire to head teachers and career counsellors 2018.
Table 5
Design and work of IP.
| Proportion who fully or partially agree to the statement (%) | Commuter | Small city | Rural |
|---|---|---|---|
| Students’ previous knowledge is mapped and assessed at an early stage | 79 | 86 | 80 |
| The individual study plan is primarily designed in line with the student’s needs and interests | 71 | 79 | 82 |
| The individual study plan is relatively standardised | 60 | 72 | 64 |
| There is a broad supply of compulsory school subjects | 79 | 86 | 93 |
| Students are tutored in their mother tongue | 67 | 67 | 56 |
| The education is adapted to the individual student’s needs to high extent | 64 | 88 | 82 |
| The education is relatively standardised | 57 | 51 | 56 |
[i] Source: Questionnaire to head teachers and career counsellors in 2018.
Table 6
Career counselling as part of the IP.
| Proportion who fully or partially agree with the statement (%) | Commuter | Small city | Rural |
|---|---|---|---|
| The student learns about educational alternatives through recurrent activities | 67 | 83 | 73 |
| The student learns about the labour market through recurrent activities | 67 | 64 | 61 |
| There are good opportunities to discuss future educational and vocational choices with a career counsellor | 83 | 95 | 86 |
| Career counsellors, teachers, and other staff collaborate in matters concerning students’ educational and vocational choices | 71 | 85 | 77 |
[i] Source: Questionnaire to head teachers and career counsellors in 2018.
Table 7
Organisation, support, and collaboration.
| Proportion who fully or partially agree with the statement (%) | Commuter | Small city | Rural |
|---|---|---|---|
| IP education and its students are geographically separated from the rest of the school | 27 | 21 | 13 |
| IP education and its students are highly integrated in my school’s work | 44 | 63 | 58 |
| The work with the IP is actively supported by the leaders of my school | 67 | 88 | 87 |
| There is a clear division of responsibilities between the different actors working with the IP | 68 | 81 | 89 |