
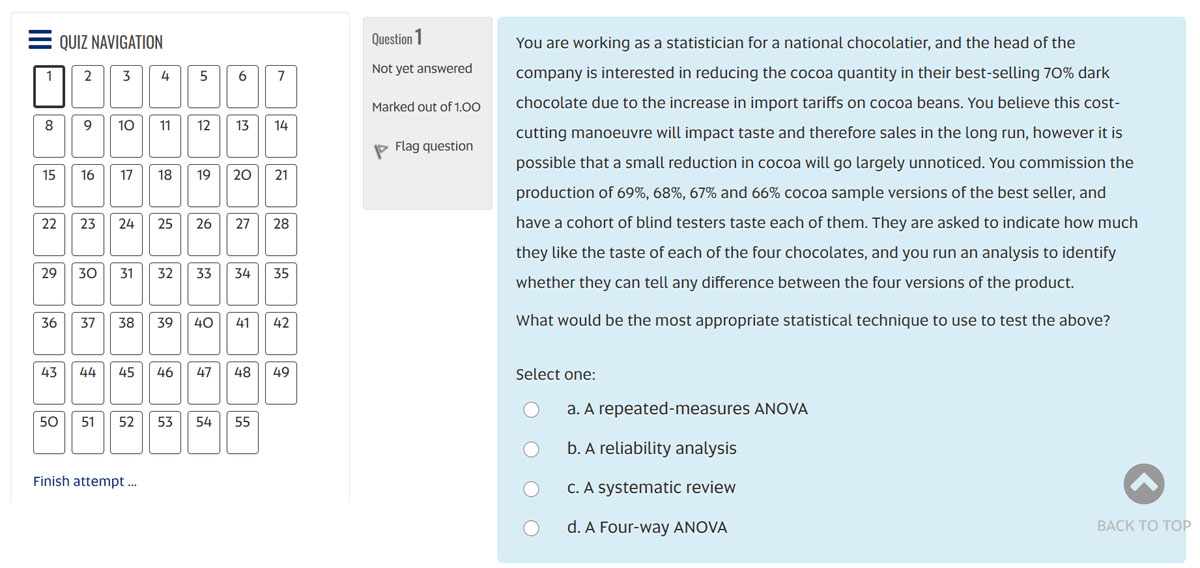
Figure 1
Example Applied Exam Question (level: easy).
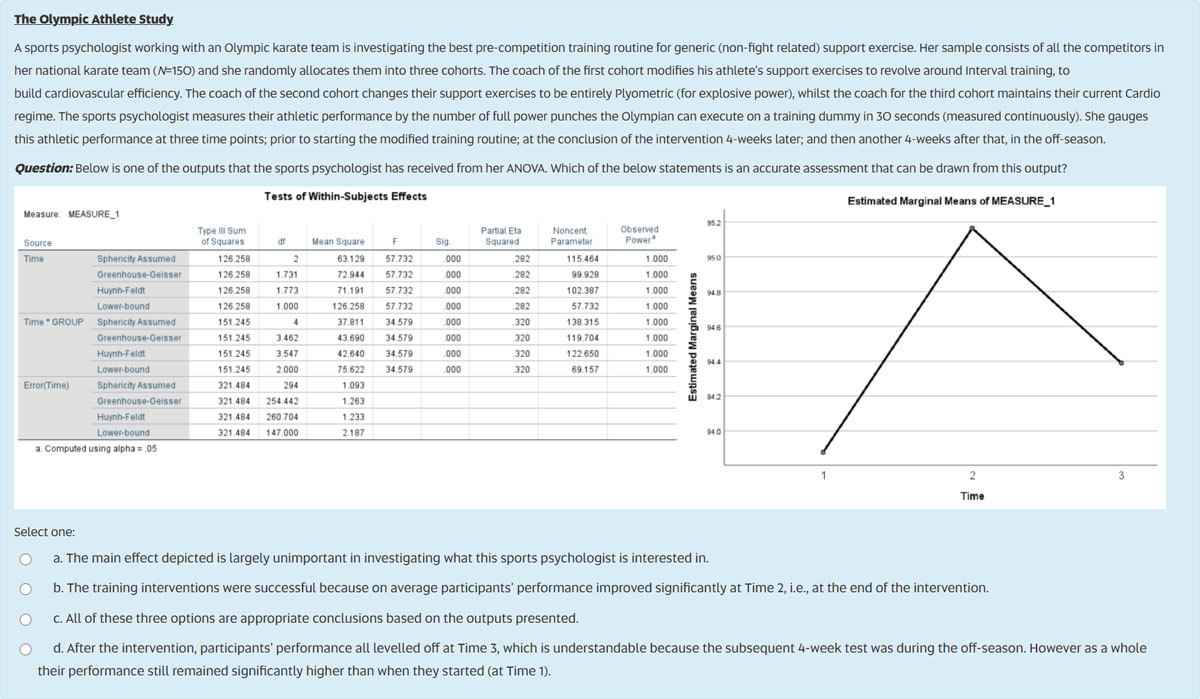
Figure 2
Example Applied Exam Question (level: difficult).
Table 1
Correlations for 2019 and 2020 Psychology Statistics Assessments.
| ASSESSMENT | 2019 | 2020 | |||||
|---|---|---|---|---|---|---|---|
| RESEARCH REPORT | PROGRESS QUIZ | TRADITIONAL EXAM | RESEARCH REPORT | PROGRESS QUIZ | APPLIED EXAM | ||
| 2019 | Research Report | 1 | .30*** | .59*** | . | . | . |
| Progress Quiz | .30*** | 1 | .41*** | . | . | . | |
| Traditional Exam | .59*** | .41*** | 1 | . | . | . | |
| 2020 | Research Report | . | . | . | 1 | .35*** | .54*** |
| Progress Quiz | . | . | . | .35*** | 1 | .39*** | |
| Applied Exam | . | . | . | .54*** | .39*** | 1 | |
[i] Note: *** p < .01; N = 104(2020); N = 81(2019); Spearman correlation for Exam & Report; Kendall’s Tau for correlations involving Progress Quiz.
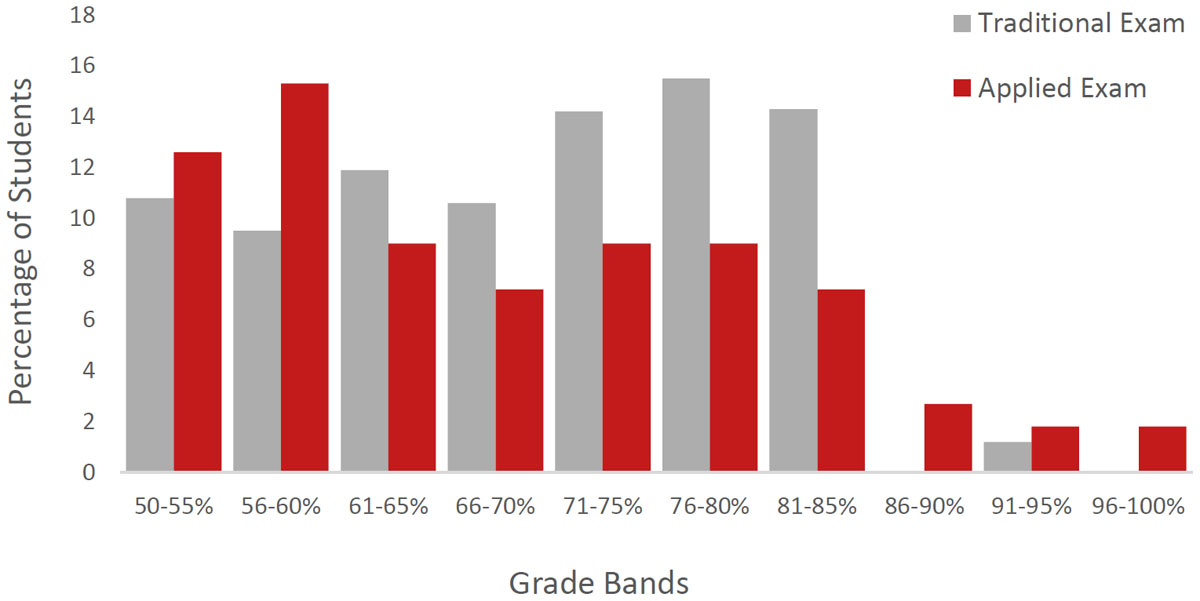
Figure 3
Exam grade percentage brackets for the 2019 Traditional vs. 2020 Applied Multiple-Choice Exams.